
Gold's 72-Day Time Cycle
Since the March 8, 2022 peak of 2083.70 for Gold, the metal has fallen some 11.2% into the most recent swing low, its largest percentage decline of 2022. Having said that, the metal is still up slightly for the year overall, and is expected to see another rise in the coming months, following the completion of the current decline.
With the above said and noted, the current correction is coming as a result of the 72-day cycle in the Gold market, which is one of the more dominant cycles that we track. This wave topped at the early-March highs, and was expected to give way to a sharp decline off the top - which we have obviously seen over the past two months.
The chart below shows our 72-day cycle in the Gold market:
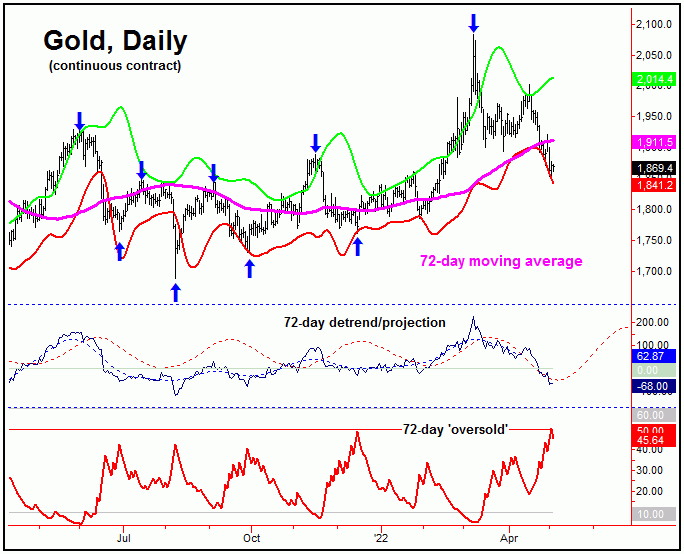
In terms of price, my rule is that a valid cycle will revert back to a moving average of the same length, doing so better than 85% of the time. With that, our call was for a minimum correction back to this 72-day moving average before this wave bottomed out, something which has been satisfied with the recent decline.
In order to set up the next good buy signal for Gold, I like to see our 72-day 'oversold' indicator (which moves inversely to price - similar to the VIX, vs. the U.S. stock market) spiking above its upper reference line - which the recent action has seen. I would also like to see daily close below our lower 72-day cycle band indicator, with the combination of these seen on the same trading day - and often seen near key lows for this 72-day wave.
With our 72-day cycle at or into normal bottoming range, its next low is due to materialize at anytime. However, it is too early to confirm the next upward phase of this wave to be back in force, with Gold needing to take out a key upside 'reversal point' for price - a number which we are watching closely in the days ahead, with precise details noted in our Gold Wave Trader market report.
With the above said and noted, we could see another short-term rally phase for Gold, but would have to lean the odds in favor of a lower low still out there for this 72-day wave. Once this low is in place, then the probabilities will favor another sharp rally phase in the months to follow, ideally playing out into mid-Summer of this year.
For the mid-term picture, the next rally up should top a larger 310-day cycle that we track, which is shown on the chart below:
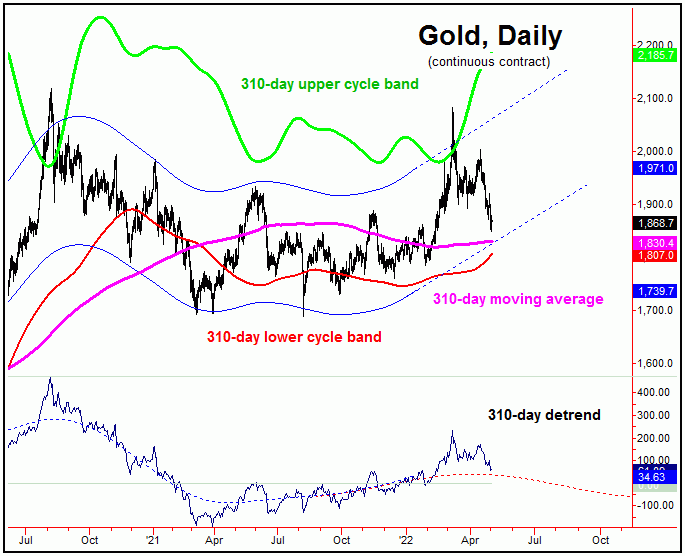 In terms of price, next key support level looks to be the 1830's for Gold - which is near our lower (and currently rising) 310-day cycle channel. This level is also where the metal closed last year - and near where it began this year - and thus is worth keeping a close eye on going forward. This 1830's level (plus or minus) ideally needs to contain the current correction phase with the smaller 72-day wave - if higher highs are still out there for the metal into mid-Summer of this year.
The Bottom Line
The bottom line with the above is that the current correction phase with the 72-day wave is favored to end up as countertrend, against the December, 2021 and January, 2021 price lows. If correct, then the probabilities are above-average that a push back above the 2083 swing top will be seen into mid-Summer of this year, then to be on the lookout for the next peak with the larger 310-day component. Stay tuned.
Jim Curry
The Gold Wave Trader
http://goldwavetrader.com/
http://cyclewave.homestead.com/
Jim Curry is the editor and publisher of The Gold Wave Trader and Market Turns advisories - each of which specializes in the use of cyclic and statistical analysis to time the Gold and U.S. stock markets. He is also the author of several trading-related e-books, and can be reached at the URL's above.
About the author


Chief Analyst & Editor
Jim Curry became involved in the markets as an investor in 1988. In the early 1990's he stumbled upon a book/methodology that would change the way he looked at the markets forever. That book was J.M. Hurst's the Profit Magic of Stock Transaction Timing. Hurst's concepts seemed to make perfect sense to Jim, and he has spent the years since coming up with his own cycle/technical analysis methodology.
In 1998 Jim put his cyclic methods to the test by entering the Etrade national options-trading competition, twice (his only two entries ever into the competition). In the first contest he finished in the top 10 out of over 150,000 entrants; in the second entry into the same contest, he just narrowly missed finishing in first place - over quadrupling a $100,000 account in the contest's short time span.
What you are seeing when you view my market reports is a collection of over 30-years of experience in both numeric analysis and spectral methods - and in actually trading the methodology for myself and for the subscribers of my Gold Wave Trader (which covers Gold) and Market Turns (covering U.S. stocks) reports.
You can visit his websites at: http://goldwavetrader.com/ and http://cyclewave.homestead.com/