There are four gold charts (source) in this article. All charts are plotted using monthly average closing prices. I will provide commentary after each chart and then summarize at the end. First chart…
Gold Prices – 5 Year Historical Chart
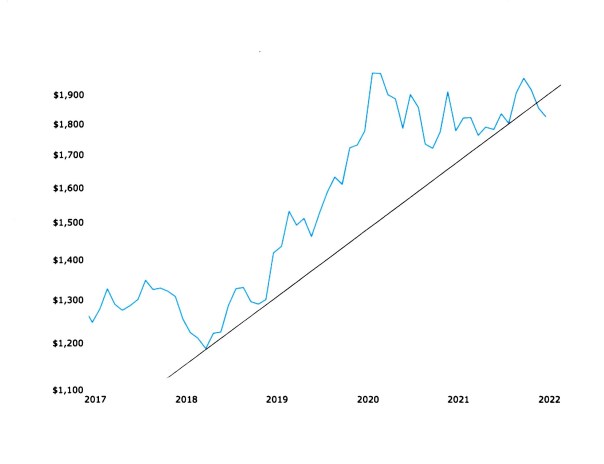
As is seen in this first chart (above), there is a moderately long and steep uptrend for the gold price dating back four years to 2018. That uptrend line appears to be broken to the downside and occurred during June. Another, steeper uptrend line (not shown) was broken last year in September 2021. Second chart…
Gold Prices – 5 Year Historical Chart (Inflation-adjusted)
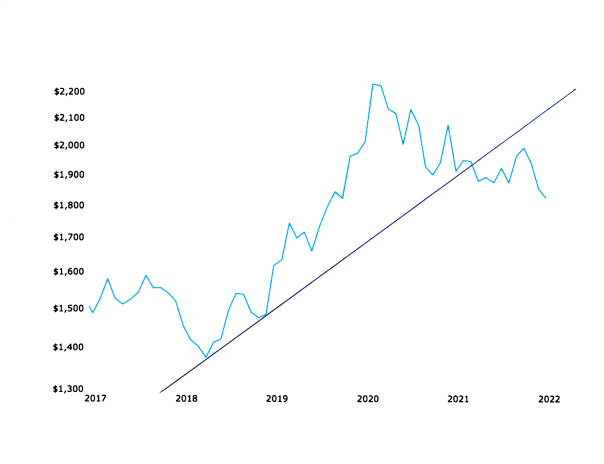
The chart immediately above is similar to the first chart except that all prices have been adjusted to account for the effects of inflation. Hence, the 2018 low price of $1183 oz. is now $1389 oz. in today’s dollars.
As is the case in the first chart, there is an uptrend line of support dating back to the 2018 low which was been broken to the downside. The break occurred in September 2021 and the broken uptrend line is the same as that which was referenced and not shown in the first chart.
For the third chart, we will expand the time horizon to ten years…
Gold Prices – 10 Year Historical Chart
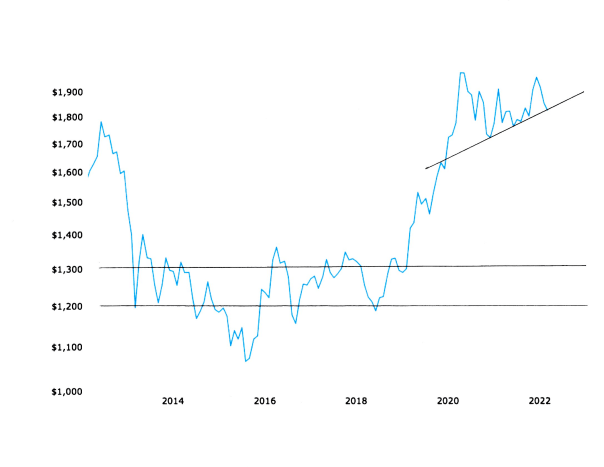
There is a different, shorter uptrend line on the above chart than in the first two charts. It dates back to the lows for gold in early 2020. Seemingly, that uptrend line has not been broken. However, that is not the case.
Gold prices are currently one hundred dollars per ounce below the ending price point on the chart above ($1817 oz. for June 2022). That is true for all of the charts shown in this article.
Also showing is a possible zone ($1200-1300 oz.) of support for the gold price, depending on how low it goes.
Our fourth and final chart shows a ten year history, too. As before, this chart also shows prices that have been adjusted for the effects of inflation…
Gold Prices – 10 Year Historical Chart (Inflation-adjusted)
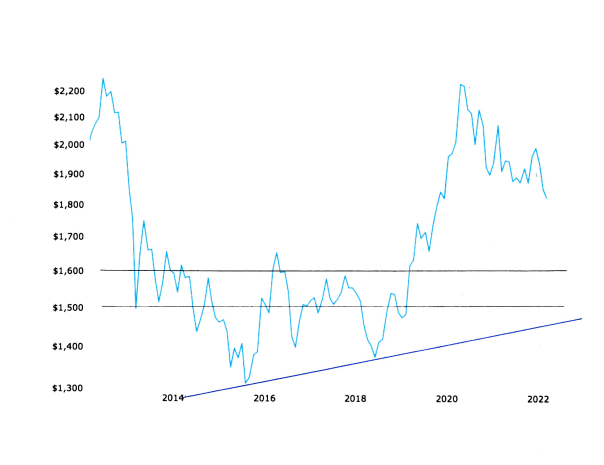
As in chart three, we have included the possible zone of support for gold prices. With the adjustments for inflation, though, that same zone is now $1500-1600 oz; which sounds much better if you are looking for a possible stopping point for the gold price on the downside.
Also in our final chart is a longer line of support dating back to the primary low point in December 2015. Near term, the gold price could drop as low as $1450 oz. without breaking that uptrend line.
SUMMARY
According to the charts we have viewed in this article…
- Gold appears to have broken below short and mid-term support.
- Possible slowing of gold price descent could come somewhere between $1500-1600 oz.
- Longer-term support for gold could come in at $1450-1475 oz.
Any concerns regarding the significance of the three observations above are heightened by the fact that gold is currently one hundred dollars per ounce below the ending price points on all four charts in this article. (also see Understanding Profit Potential In Gold)
(Important note: references to prices on the charts in this article and for future possible price action are based on monthly average closing prices. For example, the intraday high for gold in August 2020 was $2058 oz., but the high for gold based on monthly average closing prices was $1971 oz. in July 2020.)
Kelsey Williams is the author of two books: INFLATION, WHAT IT IS, WHAT IT ISN’T, AND WHO’S RESPONSIBLE FOR IT and ALL HAIL THE FED!
About the author

Analyst, Author, and Owner of Kelsey's Gold Facts
Kelsey Williams has more than forty years experience in the financial services industry, including fourteen years as a full-service financial planner. His website, Kelsey's Gold Facts, contains self-authored articles written for the purpose of educating and informing others about gold within a historical context. In addition to gold, he writes about inflation and the Federal Reserve.
Kelsey is the author of two books: INFLATION, WHAT IT IS, WHAT IT ISN'T, AND WHO'S RESPONSIBLE FOR IT and ALL HAIL THE FED!
Kelsey Williams is available for private consultations, public speaking, and interviews at kwilliams@kelseywilliamsgold.com