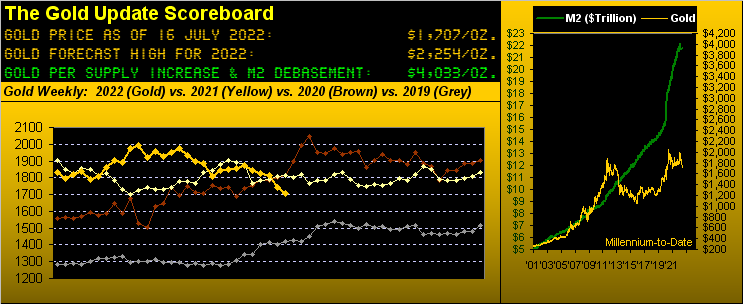
Since the commencement of the 21st Century (1,123 weeks ago), Gold -- including this current stint -- has recorded five consecutive down weeks on ten occasions, five of which were extended to six consecutive down weeks, and in turn from which three were extended to seven consecutive down weeks. Seven: that's the record, should you be scoring at home.
And to reiterate our request in last week's missive: "...please no 'Dollar strength'/rising rates comments from the low-information crowd..."
"But that is the precise mainstream explanation that's been going around, mmb..."
No argument there, Squire. The CWC ("Conventional Wisdom Crowd") inarguably believes that when the Dollar goes up, Gold goes down; and/or when interest rates go up, Gold goes down. The entire FinWorld today thus must be Long the Dollar and Short both the Bond and Gold. 'Tis so easy that even an entity to take the other side of the trade isn't necessary.
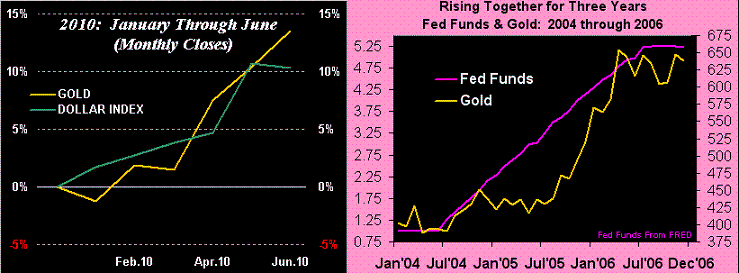
That stated, we've the following remindful reprise, (with respectful patience to our long-time readers who already well understand this, however we've new ones regularly coming on board). The left-hand panel below shows the first six months of 2010 depicting "Dollar strength" and rising Gold, both exceeding +10% increases. The right-hand panel depicts three years (2004 through 2006) of FedFunds rate increases from 1% to 5% ... along with rising Gold, indeed by better than +50%. Don't think it shan't happen again, (and do clue-in the CWC):
Regardless, in settling out the week yesterday (Friday) at 1707 (dipping en route to as low as 1695), Gold today is priced at but 42% of its currency debasement value: 4033. (Upon price inevitably reaching there in whatever coming year, you might recall this week's piece). 'Course, before its gets there price need first meet our forecast high for this year of 2254.
How does that happen? By simple math as applied to the market's bid/offer mechanism. 'Tis widespread said amongst the Gold community that 0.5% of managed portfolios carry Gold exposure. (To be sure, that is a bit specious as certainly many more portfolios carry S&P 500 Index exposure, which by default includes mighty Newmont [NEM]). But to press home the point: if the current ratio of 1 in 200 managed portfolios having Gold exposure was increased to 1 in 100 -- which for you WestPalmBeachers down there means twice as many portfolios were to carry Gold exposure -- even Goldman Sachs' call for Gold 2500 this year can be reached as the "M Word" crowd's suspicious COMEX price suppression gets hoovered.
Can it happen? "Nobody Knows Anything" (hat-tip RJM). However a little histoire goes a long way. Remember the Black Swan (aka FinCrisis) of 2008/2009? All five primary BEGOS Markets took a material hit (Bond / Euro / Gold / Oil / S&P). Fast forward to today, and does it feel a bit familiar? (To wit: upon last Wednesday's issuance of StateSide retail stagflation for June, the S&P 500 futures traced a range of 113 points in five minutes; that exceeds the S&P's entire yearly trading range from each of 1988 through 1994).
The key point is: Back during ole Black Swanee, do you remember which market sustainably bottomed essentially four full months before the S&P? Gold. Moreover, has the S&P bottomed as yet for 2022? By our analysis: hardly. And so given, Gold can get "real popular real fast": just recall 2008/2009.
What has yet to receive substantive popular admission is the U.S. being well into recession. Rather, its StateSide existence is more a State of Denial. Bloomy just presented the results of their having surveyed 34 economists: these are those high-level, supposedly in the know folks, right? Get ready: less than half (47.5%) see the U.S. as going into recession within the next year!
You know, and we know, and every one of our valued readers from Bangor, Maine to Honolulu and right 'round the world knows that the U.S. already has been in recession since last year! Why is this so hard to disseminate?
"Because inflation is counted as growth, mmb..."
Asininely 'tis, Squire. 'Course, that'll be put to bed come 28 July when the Stateside Gross Domestic Product for Q2 is reported with a minus ("-") in front of the number for the second consecutive quarter, formally making recession "official". But until then, they'll continue to pretend.
To which end, we've coloured the Econ Baro's normally blue line a bit as follows. Data basically reported for Q1 is the rose line, (Q1 GDP you'll recall being finalized at -1.6%). And data basically for Q2 is the to-date puke-green line. What's your Q2 GDP % view?
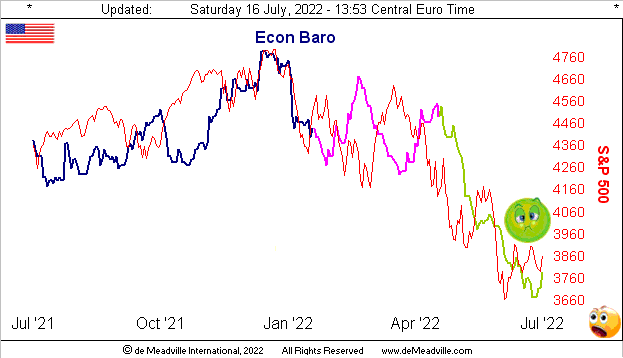
Sickly or then some, 'twasn't an all-bad week for the Baro. The New York State Empire Index after being negative for both May and June turned positive for July; the month's University of "Go Blue!" Michigan Sentiment Survey survived the consensus expectation for it to sink sub-50; and June's Retail Sales went from May shrinkage to growth. Still, Industrial Production shrank in June and May's Business Inventories became more bloated.
And then with specific respect to the S&P 500 itself, Q2 Earnings Season is underway. Have you focused on the banks? 11 have thus far reported, of which just three improved over Q2 of a year ago. Uh-oh... "Got Gold?"
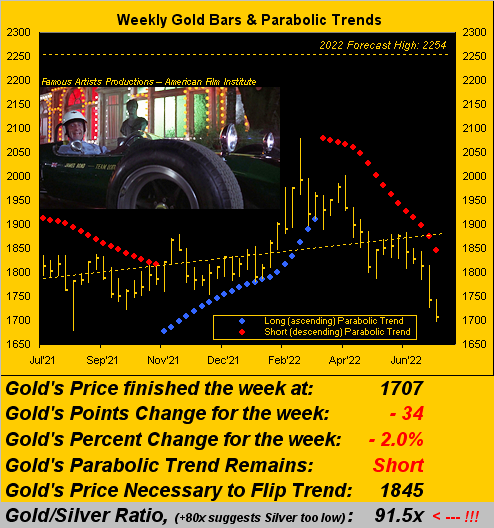
Here next we've got Gold by its weekly bars from one year ago-to-date. 'Tis about as sickly a chart as is the Econ Baro, the great unwashed deeming Gold as a commodity rather than as the gleaming currency it is. And as curious (a nice way of putting it) as is herd mentality at times, price is never wrong. We cannot "will" price to where it "ought be" at 4033; rather what we've got is what you see. But 'twill in due course be back on an up spree. Or to quote Peter Sellers (as both Evelyn Tremble and James Bond) from "Casino Royale" --[Columbia, '67]: "Grand Prix enthusiasts may be worried by the time it's taken me to get into this Lotus Formula Three. They don't realize that although Le Chiffre thinks he has a faster car than me, I am faster in my Lotus Formula Three ...Hee-Hee!":
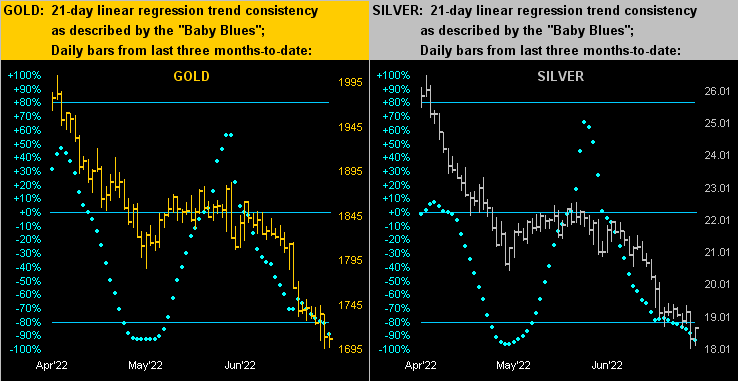
'Course, speed is easily gathered when going downhill as we next see across Gold's daily bars from three months ago-to-date on the left and those for Silver on the right. Mind (by the website) the baby blue dots of trend consistency, for upon their returning back above the respective -80% axes, 'tis suggestive of downtrends having reached the end:
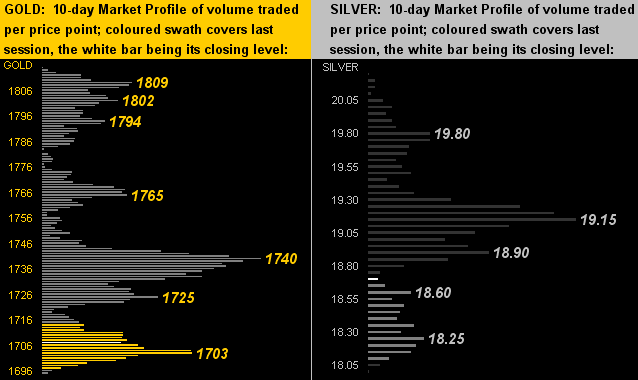
In turning to the 10-day Market Profiles for Gold (below left) and for Silver (below right), there is in both cases a straw-grasped positive: the pricing by volume above current levels (Gold 1707 and Silver 18.66) appears rather porous, suggesting such overhead can be swiftly eclipsed should the precious metals garner some favour. Obviously for Gold the line in the sand is 1740 whereas for Sister Silver 'tis 19.15:
Now let's look at The Gold Stack, a comparatively lowly sight indeed:
The Gold Stack
Gold's Value per Dollar Debasement, (from our opening "Scoreboard"): 4033
Gold’s All-Time Intra-Day High: 2089 (07 August 2020)
2022's High: 2079 (08 March)
Gold’s All-Time Closing High: 2075 (06 August 2020)
The Gateway to 2000: 1900+
The Weekly Parabolic Price to flip Long: 1845
The 300-Day Moving Average: 1833 and falling
The Final Frontier: 1800-1900
The Northern Front: 1800-1750
On Maneuvers: 1750-1579
10-Session “volume-weighted” average price magnet: 1746
Trading Resistance: the Profile's more notables are 1725, 1740 and 1765
Gold Currently: 1707, (expected daily trading range ["EDTR"]: 27 points)
Trading Support: 1703
10-Session directional range: down to 1695 (from 1815) = -120 points or -6.6%
2022's Low: 1695 (14 July)
The Floor: 1579-1466
Le Sous-sol: Sub-1466
The Support Shelf: 1454-1434
Base Camp: 1377
The 1360s Double-Top: 1369 in Apr '18 preceded by 1362 in Sep '17
Neverland: The Whiny 1290s
The Box: 1280-1240
Notwithstanding the foregoing negativity 'round Gold's price, yes, it truly does seem the investing world at large is far behind the valuation scene. Gold is 1707, but by StateSide debasement as noted, we value at the yellow metal at 4033; the S&P 500 is 3863, but by price/earnings means reversion we value the mighty index at 2864. "Behind" indeed as we close with these three brief illustrations:
■ This past Monday, Dow Jones Newswires came with "Republican Party Faces Questions on Its Future as Trump Presidency Ends" ...someone might telex them that 20 January 2021 was a year and a half ago...
■ Then come Tuesday the FinTimes headlined with "Wall Street recession fears stoked by patchy US economic data" ...where have they been these many months...
■ Not to be outdone, DJN returned on Thursday with "People Have Money but Feel Glum—What Does That Mean for the Economy?" ...if your first Big Mac cost 45¢ but is $5.63 today, (+1,151% from '67),'tis reason to so feel...
--> Gold since '67 (from $35 to $1,707 today): +4,777%. You have held on to your Gold, right?

Cheers!
...m...
www.deMeadville.com
www.TheGoldUpdate.com
The Gold Update by Mark Mead Baillie --- 661st Edition --- Monte-Carlo --- 16 July 2022 (published each Saturday) --- www.deMeadville.com

