
- Bank analysts and excited gold bugs alike are near-unanimous in forecasting that higher prices are coming when the current consolidation ends.
- Are they correct? Well, there’s no question that de-dollarisation continues; central banks, foreign governments, and family offices are all concerned that the dollar has been weaponised.
- While US tariff taxes have been softened, the threat of more financial attacks from the government hasn’t gone away, and that’s creating significant interest in gold... interest that is likely here to stay for decades to come.
- Also, the US jobs situation is shaky, with AI likely gobbling up far more jobs (and faster) than anticipated. The government hasn’t cut spending much, but there’s no big increase either, which could begin to weigh on GDP.
- Further, wage growth continues to lag “boots on the ground” inflation. Clearly, it wouldn’t take much to create a global citizen stampede into gold, and it’s already happened in Australia.
- Please click here now. Click to enlarge. The citizens of India are the world’s most aggressive buyers when there’s a significant sale (for either price or time). October saw heavy Diwali-related buying… and strong demand related to the 10% sale in the price.
- Regardless of whether gold goes higher in the manner anticipated by most analysts or not, what’s most important is this:
- Gold is supreme money. There are no contenders to its mighty throne. When gold goes on sale, it must be bought. The only issue for investors to contend with is how much to buy.
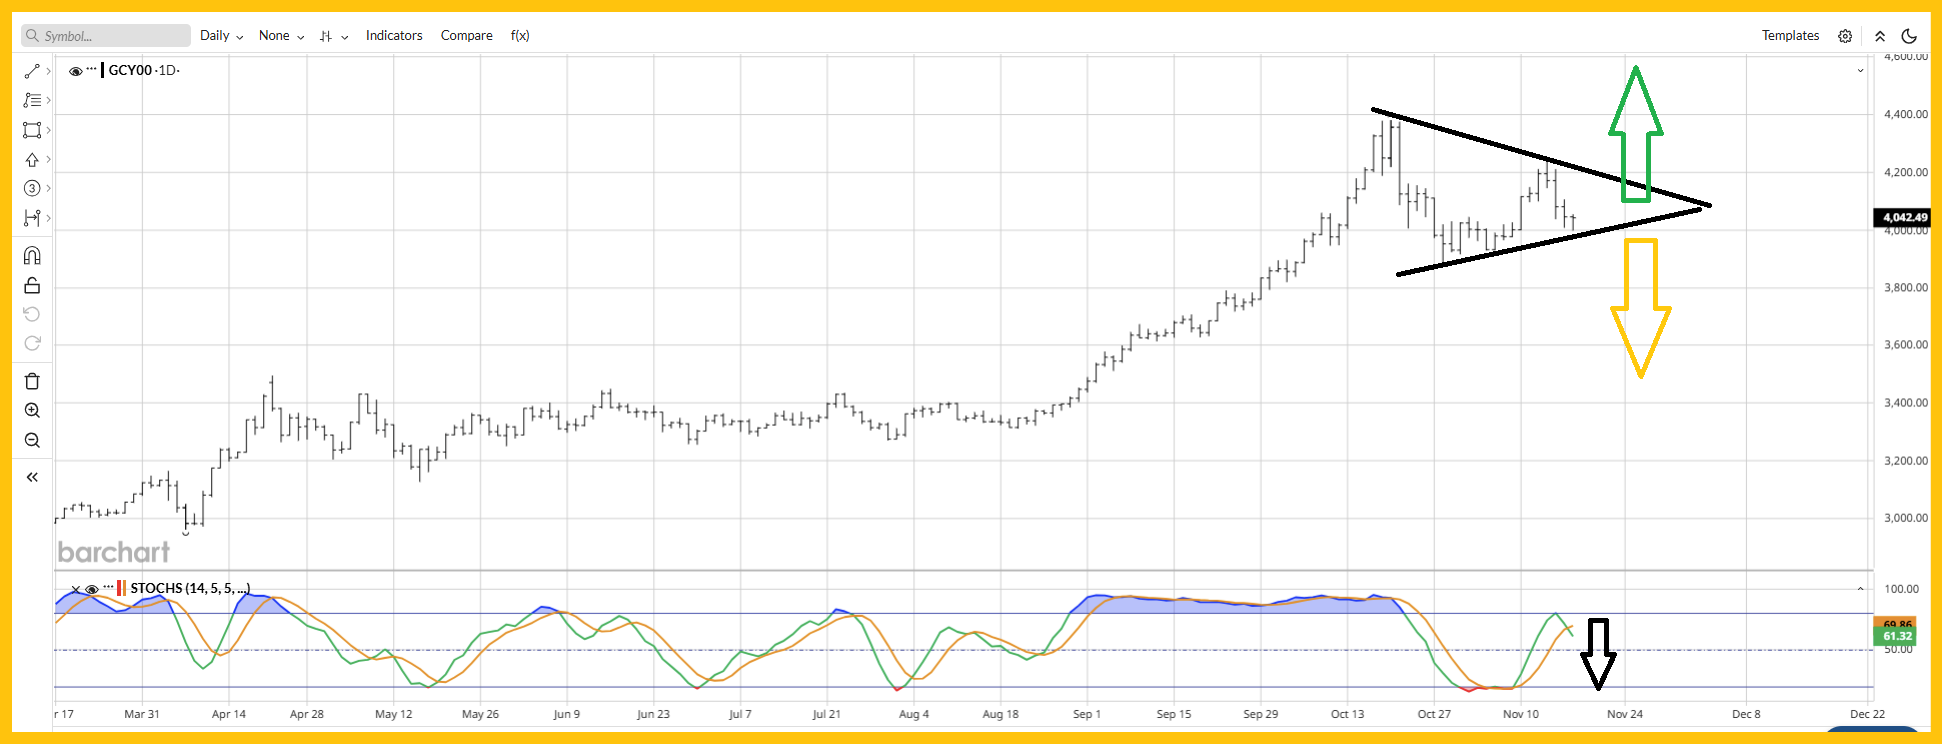
- What about the technical action? Please click here now. Click to enlarge this daily chart. There’s a significant triangle pattern in play.
- Basis Edwards & Magee (the “chart bible” authors), these formations have a rough 67% chance of consolidating the existing trend, which in this case is up. Stochastics (14,7,7 series) is a bit of a fly in the bullish ointment. It’s flashing a sell signal.
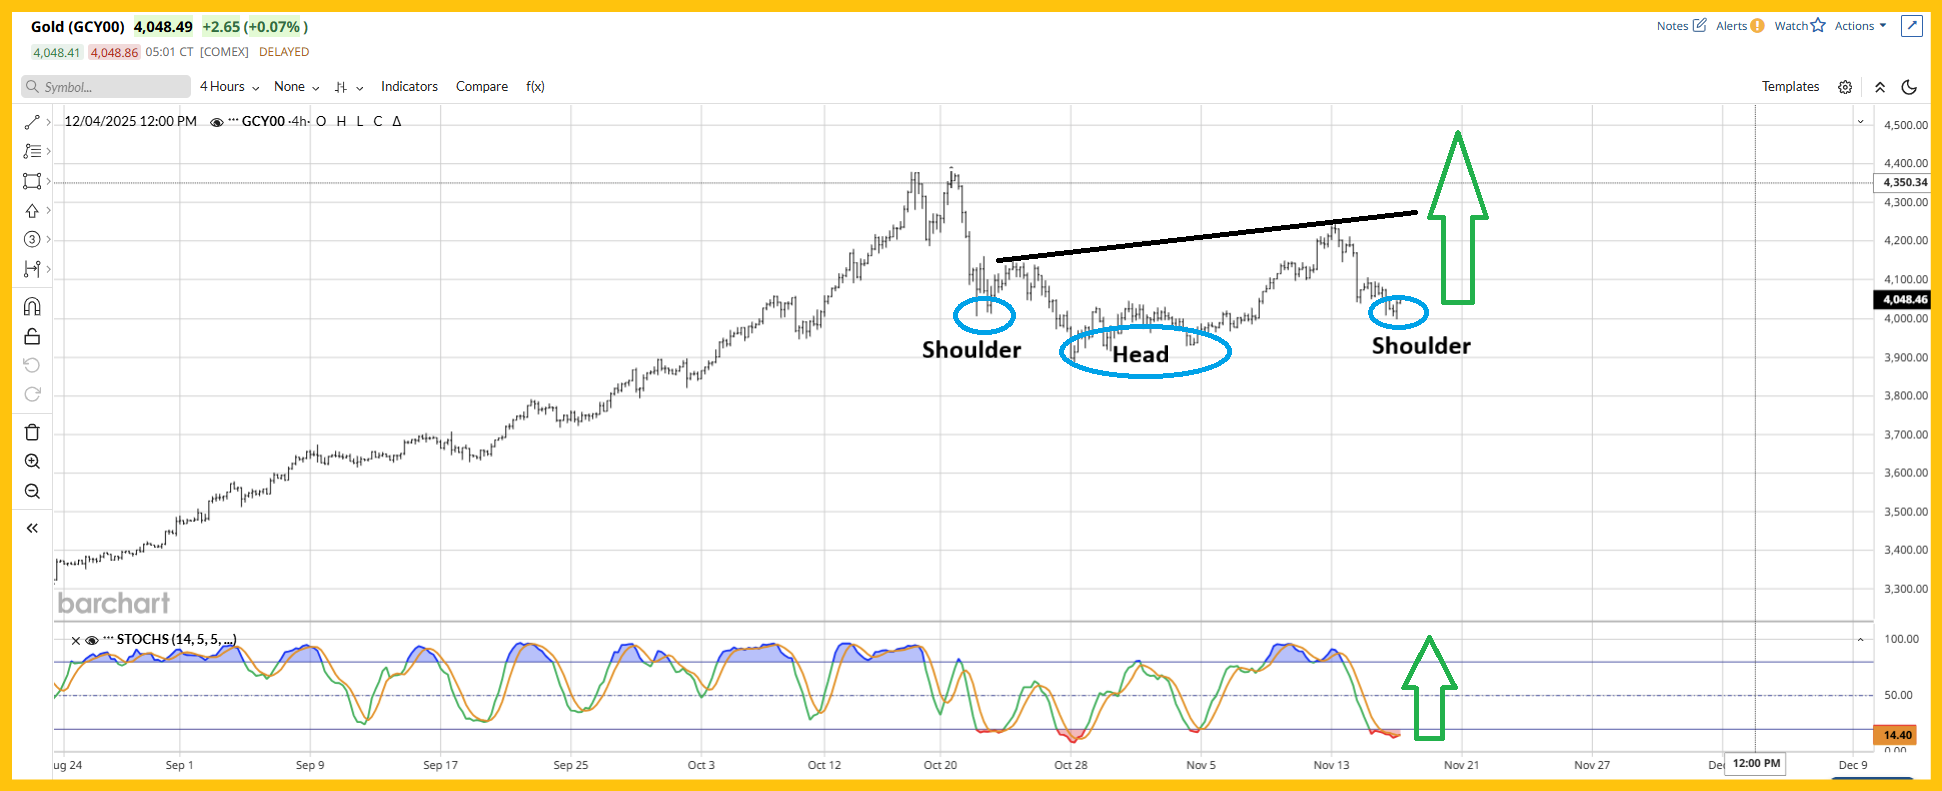
- For a closer look at supreme money gold versus inferior US fiat, please click here now. Click to enlarge. On this four-hour bar chart, Stochastics is much perkier, and an inverse H&S pattern is in play.
- As long as the price doesn’t go too much under the big round number of $4000, that H&S pattern stays alive and suggests a rush to fresh highs is imminent.
- Please click here now. Click to enlarge this key weekly chart. If gold fails to rally and instead drops into my huge buy zone of $3500-$3200, it’s clear that India’s “titans of ton” will be near-maniacal buyers as that event occurs.
- In such a situation, I’ll dare to suggest that all gold bugs in the West may want to buy with that same level of excitement.
- The bottom line: in the Asia-dominated gold bull era, using gold like a stock to make fiat profits is a questionable endeavour at best. Now it’s all about… getting more gold!
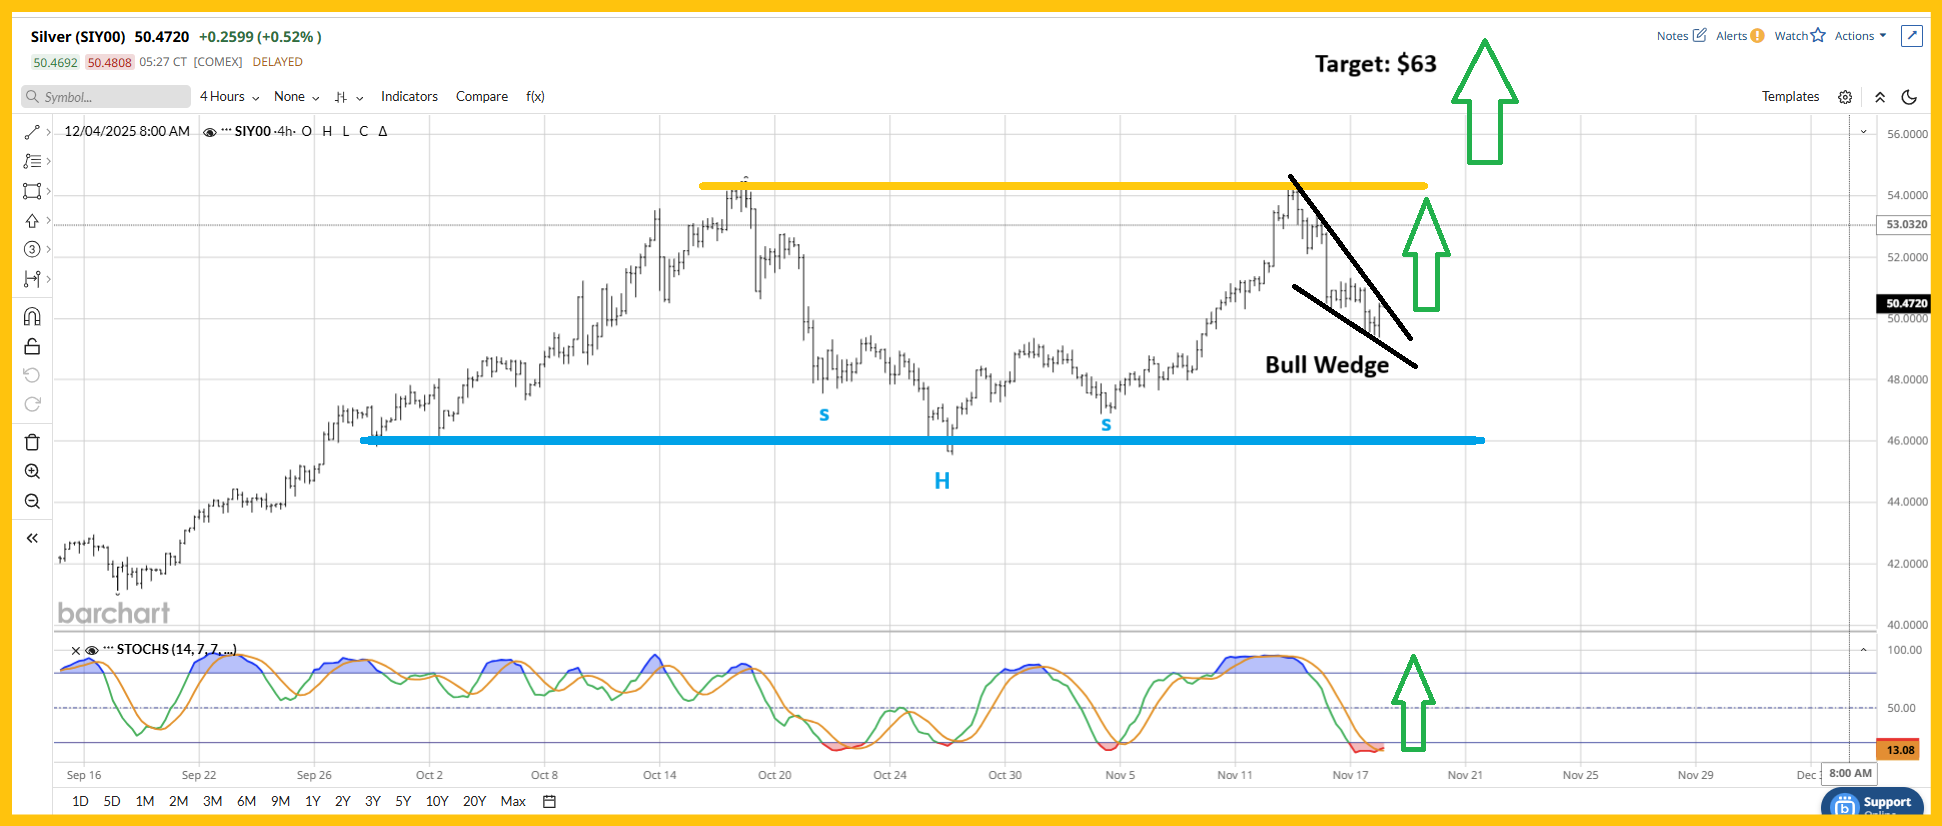
- For a look at silver, please click here now. Click to enlarge. Silver looks enticing. There’s a range trade between $46 and $54 with clear inverse H&S action in play. The bull wedge could mark the end of the consolidation and help launch a breakout above $54.
- A move to the rough $63 target range would turn the $54 area into the biggest floor of support in the history of the silver market. I also have additional target prices of $80 and $100, and those come into play if $63 is hit while gold trades above $4400.
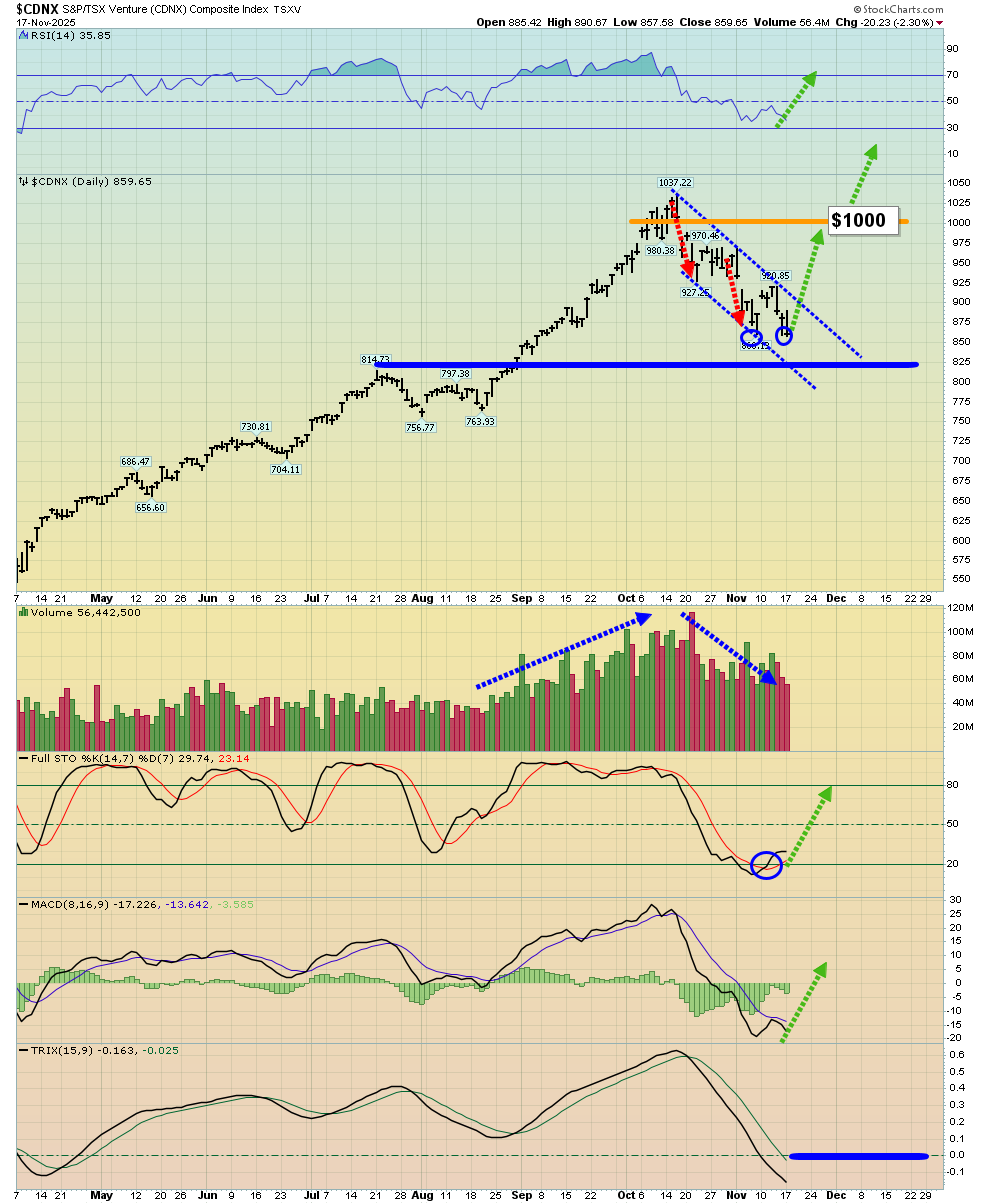
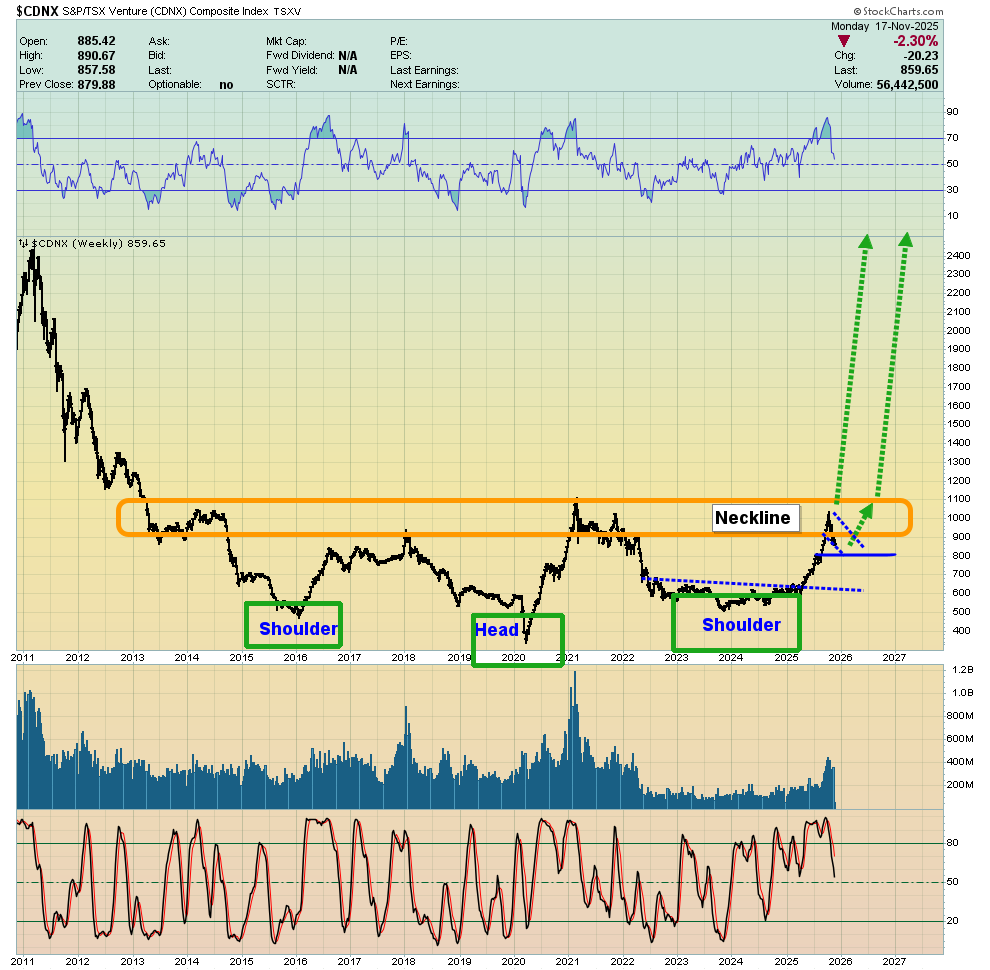
- The miners? Please click here now. Click to enlarge this CDNX daily chart. The outrageously overvalued US stock market has begun to show concerning action, and that’s put a bit of pressure on the CDNX stocks.
- Please click here now. Click to enlarge this weekly chart. Unlike the stock market, the CDNX pullback was expected to occur at the 900-1100 neckline zone of the huge H&S pattern… and it’s orderly.
- The big news for junior mine stock enthusiasts is the Canadian “MPO” (Major Projects Office), which is fast-tracking “incredibly important” projects of potential size.
- In turn, that’s creating a huge competition amongst the junior miners to get on the prospective projects list. A breakout over 1100 for the CDNX should be accompanied by key breakouts in the GDXJ and GDX ETFs.
- Junior mine stock investing isn’t for everyone, especially with size, but as this gargantuan gold bull era rollout continues, these miners look set to outperform everything!
- Please click here now. Click to enlarge this stunning GDX weekly chart. A new and ultra-bullish scenario is presenting itself, which is a gigantic cup and handle pattern with the handle likely only beginning to form from around $100.
- Gamblers can buy near $67 or on a breakout over $85. Investors should already be in and holding large positions with a very big grin!
Thanks!
Cheers
St
About the author
