
Recall a week ago (per “Gold Gives Thanks as the Economy Tanks”) our having itemized an array of fundamental Gold positives, albeit there still continue technical Gold negatives, price thus having been somewhat conflicted. However, as rightly therein written: “… at the end of the day — regardless what technicals shout — ’tis by fundamentals Gold will out …”
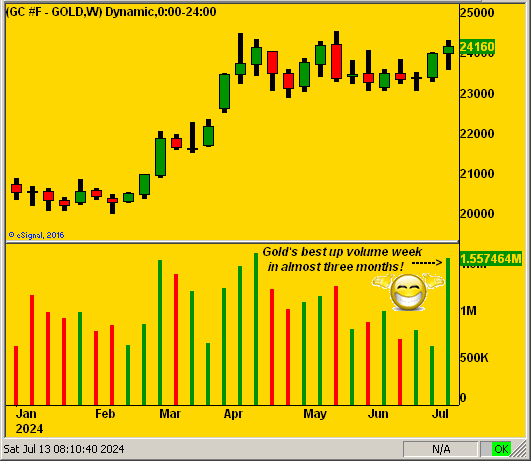
And that recently appears to be the case. True, by its weekly technical measures, Gold just concluded its third consecutive week of parabolic Short trend — and moreover — fifth consecutive week of negatively disposed MACD (moving average convergence divergence). But in settling yesterday (Friday) at 2416, ’twas Gold’s highest weekly close since that ending 17 May — and further — its third straight weekly gain.
Also, of substantive import by trading range, Gold stands just -38 points below its All-Time Intraday High of 2454 (20 May) in the context that price’s expected weekly trading range is now 79 points. In other words (for you WestPalmBeachers down there), Gold is well within range of recording a fresh All-Time High in the ensuing week. Too, this past week’s contract volume was the most for an up week since than ending 19 April. Here ’tis by the weekly candles year-to-date:
Indeed, one might take those other negative technicals and actually “dispose” of them. For with inflation having been tamed (depending on one’s media source of choice) in June as ’twas in May, cue the Federal Reserve to merrily say “Olé! Let’s cut rates today!” Or at least come their Open Market Committee’s 31 July Policy Statement.
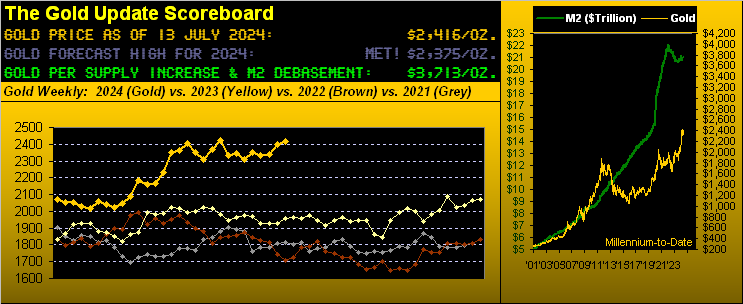
Thus Gold gets the bid as this past week it did, notably so on such cited supportive volume. For Gold to truly get up and go, it requires that kind of improved participation (dare we use the “woke” word “awareness”). And the more who are aware the StateSide economy (as we’ll see) is crumbling — plus Gold by the opening Scoreboard’s valuation of 3713 being presently priced at but 65% (2416) of that measure — the sooner Gold can materially “get off the schneid”.
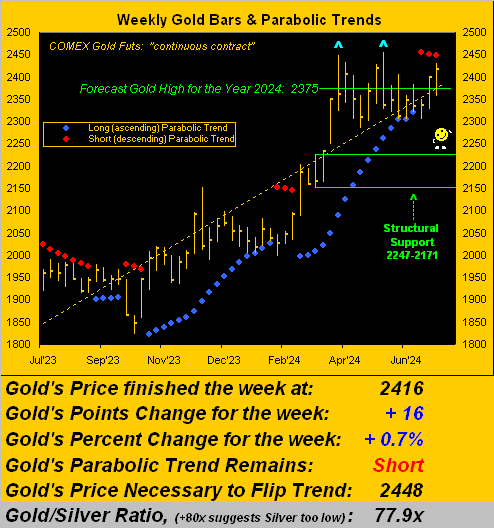
Notwithstanding all this mirth, from the “Keeping Our Feet on the Ground Dept.” we’ve Gold’s weekly bars below from one year ago-to-date. Therein we’re mindful of these three highlights:
- Recall Gold’s “double-top” from this past April-May: the two light blue markers need be eclipsed;
- The red-dotted parabolic Short trend, now three weeks in duration, also need be eclipsed;
- The 2247-2171 structural support remains a viable test at least until the next fresh All-Time High.
But on balance by this graphic, Gold looks poised to break out to the upside, certainly supported (understatement) by its aforementioned fundamental positives:
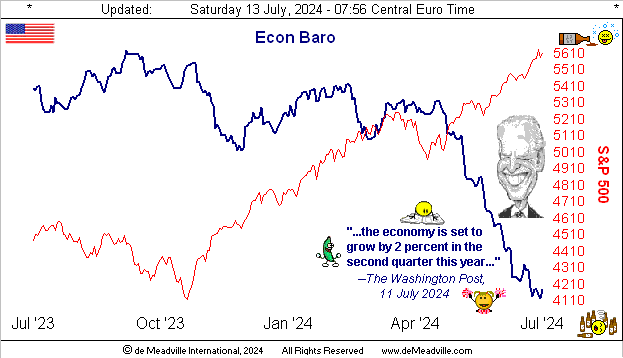
Now in concert with the FOMC almost certainly — indeed obligedly –voting to cut rates at its 30-31 July meeting, let’s next update the teased “crumbling” Economic Barometer. Indeed in morphing from less hawkish to more dovish FedSpeak this past week — notably so from FedChair Powell at his Congressional Humphrey-Hawkins (no pun intended) testimony — we’re thinking that some of you valued readers actually did fax the prior missive’s Econ Baro to the Fed, for which you’ve done the monetary world a favour. To wit in paraphrasing The Chair: maintaining the current “high” level of Fed interest rates could adversely affect the economy. (Really?)
To be sure, despite NBC’s Christopher Loffredo Hayes having just on Friday stated “When you consider where we stood in 2020, Biden’s tenure has been the most successful macroeconomic stewardship of any president in my lifetime”, the math belies that: the Baro’s 50-day trading plunge from 29 April through 11 July is its worst drop across any like period since ’twas created in 1998. And as for Gross Domestic Product achieving an annualized 2% growth rate for Q2, we’ll believe it when we see it (on 25 July). In the interim: “Got Gold?”
Too, there’s the punch-drunk S&P 500, which this past week traded to a record-high 5656, the “live” price/earnings ratio settling Friday now 43.8x with a dividend yield of 1.311%; that for the U.S. Three-Month Treasury Bill is 5.198%. ‘Course, when it all goes wrong, folks love to commiserate when crying in their beer. To quote one Bopper Bip: “Ya know, I was gonna sell at the high [yeah right], but then doubled way too soon on the dip…” Breaking News: A third 50% means-reversion “dip” in this still young century wouldn’t be an unlikely trip, (just in case you’re scoring at home, Mr. Bip).
“But there’s all that liquidity in the system so stocks can’t go down, mmb…"
Or is there really, Squire? The S&P finished the week with a market-capitalization of $49.1T supported by a liquid U.S. money supply (M2 basis) of $20.1T. That ostensibly means there’s 2.3x as much money invested in the S&P 500 than readily exists. Hence our oft-quipped moniker for anticipating the “Look Ma! No Money!” crash. “Hey Mabel! The broker says their IOU is still good for another 18 months as long as we commit to buy some GameFlop!”
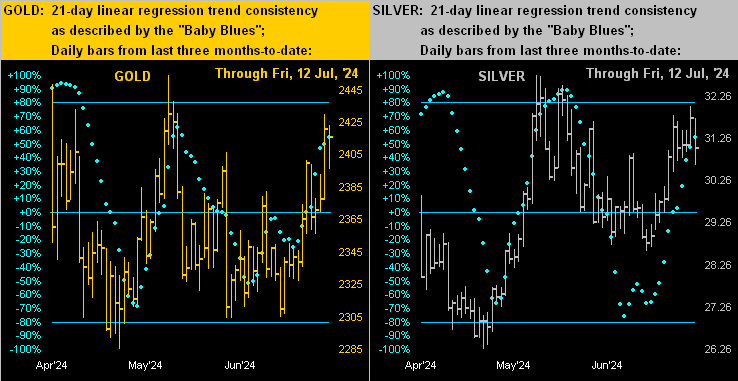
Hardly looking to stayed paired with any negative technical flop are the precious metals. Turning to our two-panel graphic of the daily bars across the past three months-to-date for Gold on the left and for Silver on the right, both metals’ tracks appear quite healthy since late June, their baby blue dots of regression trend consistency scampering along to the upside:
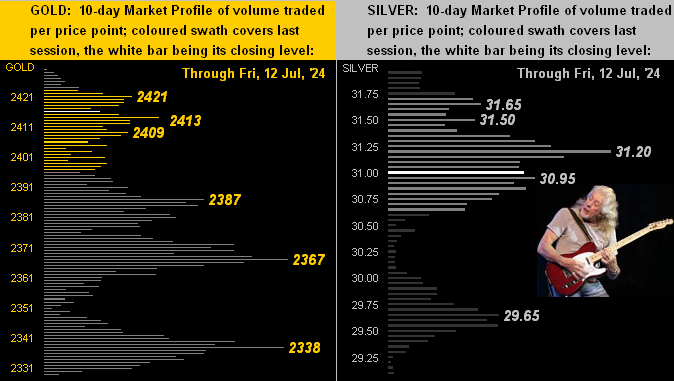
Too, we have the dual-panel display for Gold’s 10-day Market Profile (below left) and that for Silver (below right). The yellow metal’s two nearby volume support prices are 2387 and 2367 as labeled, whilst for the white metal, although 29.65 would seem safe, getting back above 31.20 — her most commonly traded price of the past fortnight — would allow for more upside ![]() “Room to Move”
“Room to Move” ![]() –[John Mayall, ’69]:
–[John Mayall, ’69]:
Now to wrap ahead of 14 incoming metrics due next week for the Econ Baro, we (being from a media family) are reminded that one’s choice of news source doesn’t necessarily convey truth. Recall above we alluded to inflation as “having been tamed in June”. Oh to be sure, at the retail level, June’s headline Consumer Price Index was a deflationary -0.1% pace, its first negative reading since that from the COVID Spring (double entendre) in 2020. However: ’twas a different story for wholesale inflation, the headline Producer Price Index rising from a pre-revised -0.2% pace in May to June’s +0.2%. “Whoopsie…” True, the PPI is more erratic than the CPI; but the former does have a leading tendency over the latter. Anyhooo, to our media point with these two quotes:
- Hat-tip Dow Jones Newswires: “Wholesale prices tame in June, PPI finds, and also point to lower inflation”;
- Hat-tip Breitbart Business Digest: “Producer inflation surges much higher than expected; Core inflation hits worst level in a year”.
To the second quote, before you say “No way!”, let’s once again do the math: the 12-month summation of Core PPI through June is at its highest level (+2.6%) in 14 months.
“Well that wasn’t on the TV, mmb…“
Squire, we wouldn’t know, having abandoned FinTV long ago. Either way, let’s cue for our parroting FinMedia colleagues some wisdom from the eternally-iconic Charles M. Schultz:
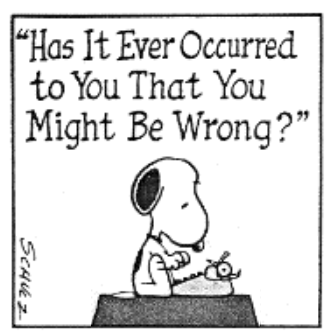
Whilst at the end of the day the media’s life-blood is advertising revenue, when it comes to your wealth management: do the math determinative and keep Gold in the affirmative!
…m…
www.TheGoldUpdate.com
www.deMeadville.com
and now on “X”: @deMeadvillePro
deMeadville. Copyright Ⓒ 2010 - 2024. All Rights Reserved.
About the author
