“Gold Goes Long with Three Golden Goals“
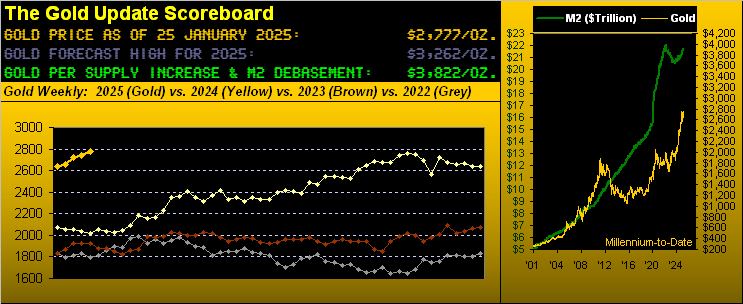
Gold’s weekly parabolic trend finally (after a 10-week Short run) flipped to Long this past Tuesday at 15:19 GMT upon price eclipsing the 2759 level toward settling the week yesterday (Friday) at 2777. ‘Twas a beautiful thAng, and in thanking our valued republishers we penned: “…we look forward to a modicum of rejoicing in next Saturday’s edition …”
Thus without further ado, ’tis to rejoice:
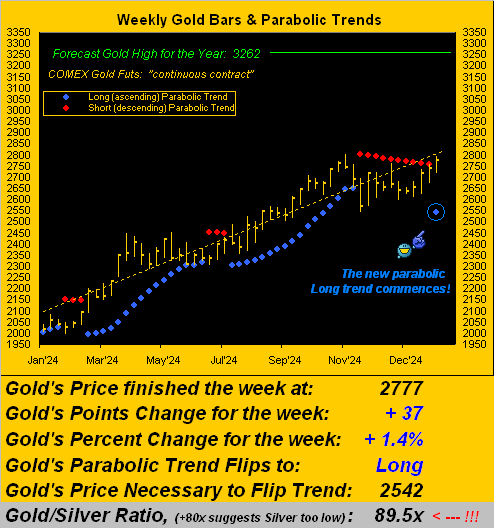
Nevertheless, we indeed employ the noun “modicum” as in this business we know to be measured and math-oriented (unlike much of the modern-day shameless pap that passes for “analysis”: “Well, ya know, the stock’s gonna triple in the next two weeks…” Good grief. Put a sock in in it).
“But to your title’s point about ‘Three Golden Goals’, mmb?”
And point-blank here they are, dear Squire, each being a key Gold price:
- Goal One: 2802 = the next All-Time High for Gold. The present such high (precisely 2801.8) was achieved this past 30 October. When is the next? As soon as Monday given present price (2777) is just -25 points below 2802 with Gold’s EDTR (“expected daily trading range”) per the website now 33 points. Or certainly so within the new week given the EWTR (“expected weekly trading range”) is now 87 points. Thus barring Gold only dropping like a stone from the get-go on Monday, 2802 is (to use a technical term) “easy-peasy-lemon-squeezy” (EPLS).
- Goal Two: 3000 = nothing more than a “milestone” level up through which price shall eventually proceed. Were our numerical world calculated in “Base 8” rather than “Base 10”, 3000 would instead be 5670, bereft of “milestone” meaning. Regardless, Gold 3000 ought bring the mo-mo crowd to the fore in propelling price up even more. ‘Tis achievable during this new Long trend.
- Goal Three: 3262 = our forecast Gold high for this year as reasonably penned in our opening missive this year on 04 January. But is that out of reach for the new Long trend? Probably, (yet see below…)
So in specific context to the above three Gold price goals, let’s go straightaway to the math of what to rationally expect for Gold’s price rise near-term. And no better foundation for which to measure this next Gold up leg than by reviewing price’s performance across the prior ten weekly parabolic Long trends commencing back on New Year’s Eve at the end of 2020. The following table depicts Gold’s respective maximum gains by both price and percentage recorded for each Long trend. We’ll then assess for this new Long trend its potential upside on a conservative, moderate, and aggressive basis:
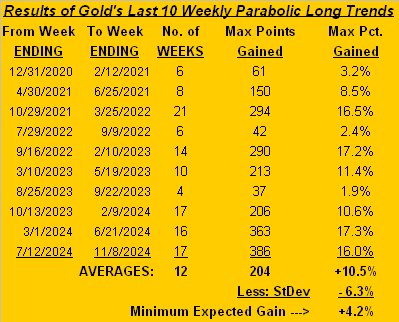
Conservative assessment: as aforementioned, Gold can simply drop like a stone from here, thus rendering useless the above table. But let us focus on the rightmost column “Max Pct. Gained” during the life of each Long trend. Therein the weakest of the bunch is +1.9%. Repeat only that distance this time ’round would nonetheless bring Gold from its present 2777 to 2830 … and thus the attainment of Goal One (2802) as a fresh All-Time High. A bit more realistically, note the average gain of +10.5% — less the standard deviation of -6.3% — in turn leaving +4.2% as a suggested “minimum expected gain”: that yields Gold 2894.
Moderate assessment: simply that average gain of +10.5% which would bring Gold 3069 … and thus the attainment of Goal Two (3000) as a “milestone”.
Aggressive assessment: note in the same “Max Pct. Gained” column there are two instances of Gold exceeding gains of +17%. ‘Tis admittedly a bit of a stretch, but from 2777 to our Goal Three (3262) forecast high becomes a gain of +17.5% … just in case you’re scoring at home. However, given our measured thinking, we’d “expect” at least one more weekly parabolic Short trend to intervene before Gold flies to the 3262 prize.
Indeed, Gold’s low thus far this year is only 2625 (06 January). Recall from our 04 January piece: “…applying the ‘expected yearly trading range’ method, the year’s low approximates … 2507. Then would follow the ascent to [the] forecast high of 3262…”
Thus we ought not be put off upon still lower levels occurring en route. To wit: following next Wednesday’s (29 January) “maintain” Policy Statement from the Federal Reserve’s Open Market Committee comes Friday’s release of December’s Personal Consumption Expenditures Prices. Such “Fed-favoured” gauge is expected to reveal inflation as once again increasing. That in turn opens the door … depending on February and March inflation readings … of a Fed rate hike come the FOMC’s 19 March Policy Statement. Wariness of such could well cap Gold’s up run, making this new Long trend short-lived.
“But mmb, what if the 2625 low is already in for this year?”
Squire, were that to turn out to be the case, then our forecast for a 3262 year’s high may be deemed in hindsight as modest.
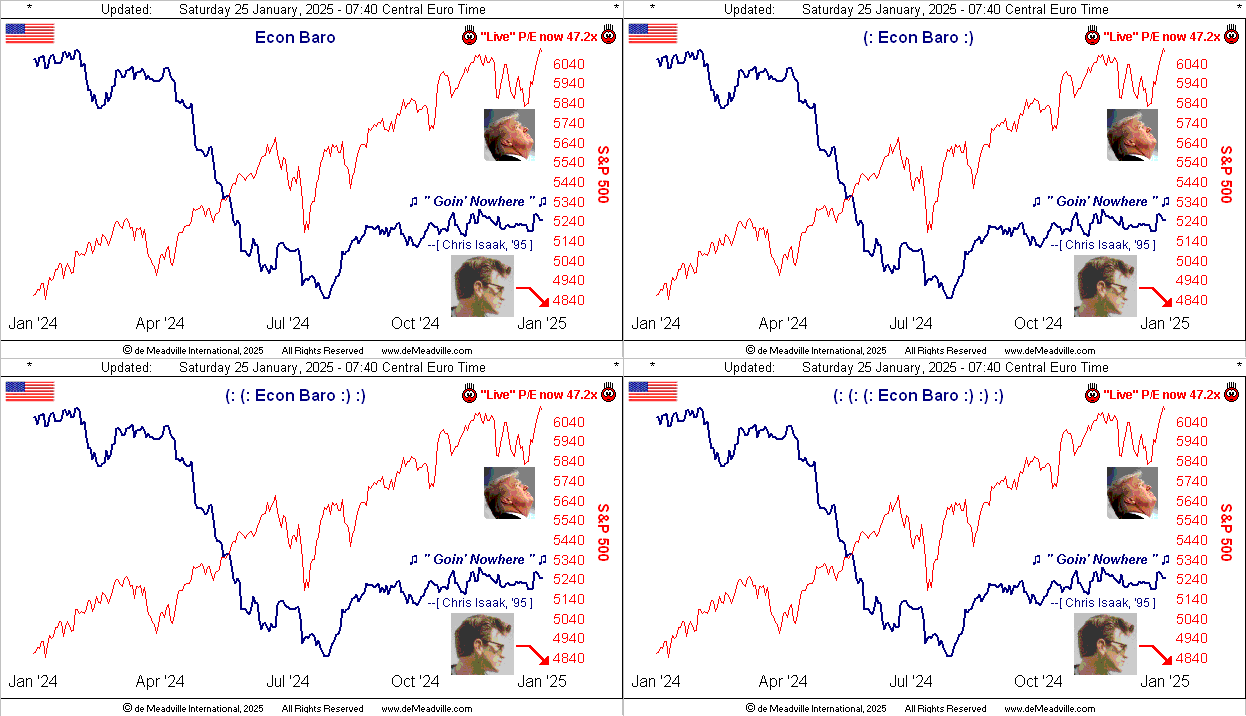
Quintessentially modest across the past four months is our Economic Barometer. And amongst the ensuing week’s incoming set of 13 metrics, two are specific to the first read of StateSide Q4 GDP. Going by the flat Baro below, one cannot anticipate much growth. Consensus suggests a slowing from Q3’s annualized +3.1% to +2.3% for Q4.
But wait, there’s more: the inflation component therein is expected to have risen from +1.9% to +2.4%. In other words for you WestPalmBeachers down there, Q4’s growth is “expected” to be rather stagflative, (such multi-syllabic adjective perhaps a bit much for them).
But way too much for anyone invested in the S&P 500 is its relentlessly high “live” price/earnings ratio of 47.2x. (Note: “AI” says … in using trailing 12-month earnings as do we … ’tis 28.8x; yet another example of Assembled Inaccuracy’s inability to do math). Here’s the picture:
“But Q4 earnings are supposed to be great, eh mmb?”
‘Tis a good news/bad news scenario there, Squire. To be sure for the S&P 500, Q4 Earnings Season is off to an excellent start. Typically for the S&P, about 450 companies report with the season’s calendar guidelines. Thus far, about 12% are in the books, within which 71% have bettered their bottom lines from Q4 a year ago: that is an above-average showing of improvement, and hence ’tis the good news.
Now for the bad news (and if you regularly read us and/or visit the website’s S&P 500 “Valuation and Rankings” page you already well-know this): the overall level of earnings — even as improving — remains ridiculously low compared to what entities are willing to pay to own shares. If in our solar system Earth represents P/E acceptability, the current 47.2x level is on beyond Neptune, past the ex-planet Pluto, indeed reaching galaxies unknown. Again we remind: had COVID never occurred nor the subsequent “creation” of $7T, the S&P today would tolerably be — by today’s actual earnings generation — ’round the upper red line of the 46-year based regression channel:
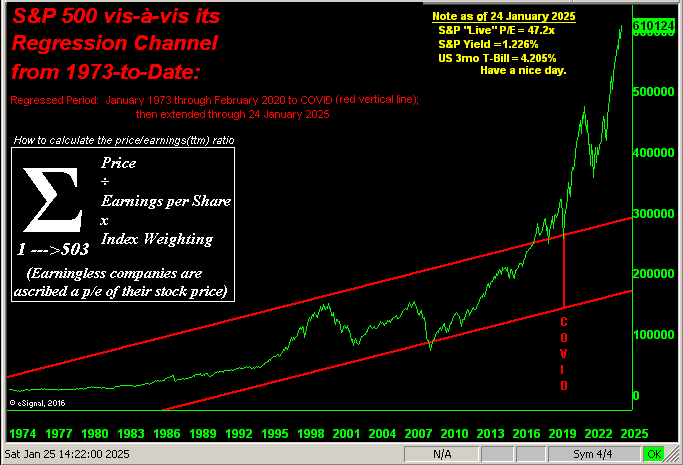
Thus beware to those who roll their eyes over talk of a pending -50% S&P “correction”: the possibility is quite real given we’ve already endured two such “corrections” in just the last quarter century. Remember from the S&P’s high (1553) on 24 March 2000 that it took better than 13 years for the Index to settle just +2% higher? Imagine how that would fare with today’s low-information, short-attention span, instant gratification crowd that vastly populate this Investing Age of Stoopid. In fact, it might be a good idea to invest in diaper manufacturers. For the next like “correction” — regardless of when it comes — shall morph Wall Street emotion from “No Fear!” into “Nuthin’ BUT Fear!”
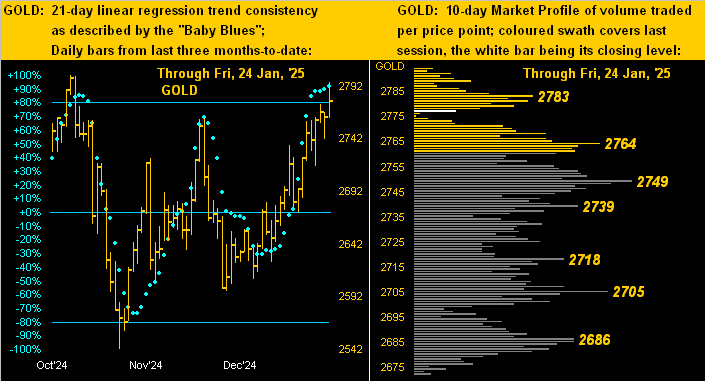
‘Course, then there’s Gold. Ahhh, beautifully wonderful Gold! Here we’ve the two-panel graphic of the yellow metal’s daily closes from three months ago-to-date on the left and 10-day Market Profile on the right. And you know the drill for the baby blue dots of trend consistency: “Follow the Blues instead of the news, else lose your shoes.” Too, there are a bevy of volume-driven price supports as labeled in the Profile:
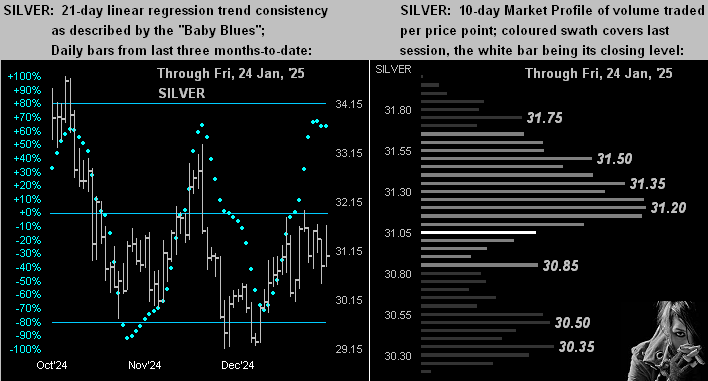
Silver of late has not fared as directly up as has Gold. To the white metal’s like display, wherein (below left) her price has tailed off somewhat and her “Baby Blues” have stalled. You may earlier have noted in Gold’s weekly bars graphic the Gold/Silver ratio now being up to 89.5x, its highest reading in this young year-to-date. And unlike the Market Profile support structure for Gold, Silver’s (below right) appears more overhead resistive. Has Sister Silver exchanged her precious metal pinstripes for her industrial metal jacket, given Cousin Copper having come off of late? ‘Tis on occasion her wont to be a bad girl…
In sum, we anticipate further near-term rising for Gold, barring — as duly noted — an inflation/Fed-hike scare.
Moreover, let’s close with this critical notion: in addition to the three Golden goals herein described, there is, of course, a fourth:
- Goal Four: 3822 = the opening Scoreboard’s current Dollar debasement valuation of Gold, even as adjusted for the yellow metal’s own supply increase. No, we shan’t get there within this new weekly parabolic Long trend, let alone this year. But ’tis sitting out there…

Reprise: “Got Gold?”
Cheers!
…m…
www.TheGoldUpdate.com
www.deMeadville.com
and now on “X”: @deMeadvillePro

