
Let's start with this from the "Percentages Within Percentages Dept.":
■ Across the past six weeks, the price of Gold has risen from as low as 1618 (03 November) to as high as 1823 (05 December) -- what with those Happy +15 points of contract premium that we cited a week ago -- is an all-in gain of +12.6%, (or without the premium +11.7%);
■ However, 77% of the run within that overall gain of +12.6% occurred four weeks prior to that just settled, meaning (for those for you scoring at home) that it took these most recent four weeks to gain the remaining 23% of the +12.6%. Savvy?
Indeed from Gold's 1792 high at that point of nearly four weeks ago (15 November), price has since ascended but +1.7%, (or without the premium +0.9%), ultimately settling yesterday (Friday) at 1809 for (to sate you pessimists out there) its second losing week of the past four, (slight as those two losers have been).
"So what are you implying, mmb? Are you souring on Gold?"
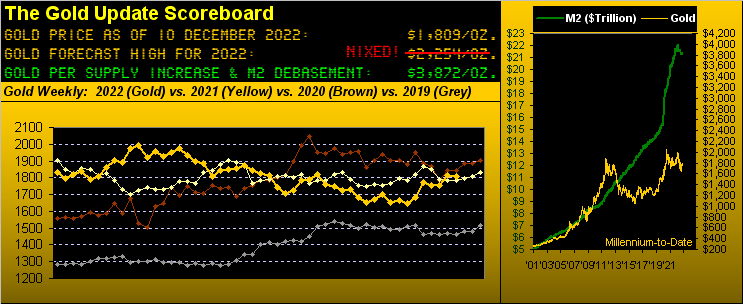
Heavens no, Squire! (He knows that). Rather, we're merely keeping our feet on the ground whilst many around (and eventually rightly so) expect Gold nonetheless to non-stop abound! To be sure, we value Gold right now per the opening Scoreboard at 3872: that's +114% above today's lowly level of 1809. And yet Gold as a primary component of the BEGOS Markets (Bond / Euro / Gold / Oil / S&P) trades just as do they, which hardly is unidirectional. For even if the growing (which is good) Gold hype and fluff isn't enough, the reality for The Now is that price is running out of puff.
For proof sans dispute we've the following two-panel graphic from our increasingly-popular "Others Parrot; We Do The Math Dept."
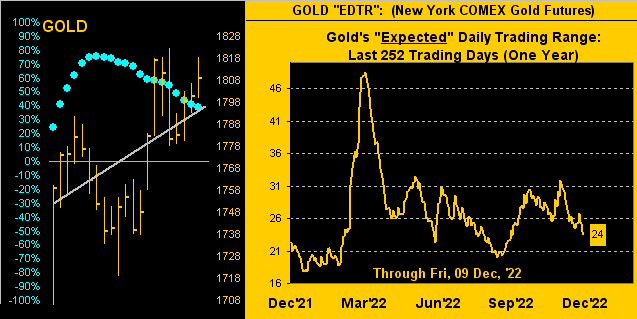
On the left is our familiar chart of Gold's daily bars across the past 21 trading days (one month). Therein we've the grey diagonal linear regression trendline, but also the baby blue dots of that trend's consistency: yes the trend still is positive, however the declining "Baby Blues" are indicative of it being less so. On the right from the website is Gold's "Expected" Daily Trading Range (EDTR) from one year ago-to-date; (for you WestPalmBeachers down there, this is not the price of Gold); the "24" in the box means we expect Gold in its next session (in this case for Monday) to span a range of 24 points between the day's high and low: that is half the range we were seeing back in March as the RUS/UKR war began to unfold, (Gold's price in turn then doing its expected geo-political pop n' flop). The point is: irrespective of Gold not being in near-term trend decline, it is clearly losing some of its zip:
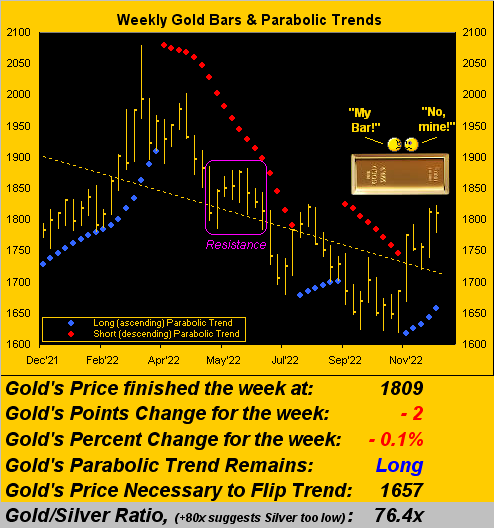
Fortunately in turning to the broader-based chart of Gold's year-over-year weekly bars, the blue-dotted parabolic Long trend now five weeks in length is comfortably in force with an available 152 points of wiggle room between price (1809) and that which would at present flip the trend to Short (1657). Still, we acknowledge that the descending dashed trendline across all 53 weeks has been rotating more and more negatively since that ending this past 24 June. Regardless, as we've citied during this current parabolic Long trend, the typical points follow-through can put Gold above 1900 on this run, (notwithstanding the purple-encircled structural resistance of the 1800s). And dip-buyers are hitting offers such that price has closed near its high for five of the past six weekly bars. Did you too grab some Gold? (Take it easy there, lads...):
Then there's the Economic Barometer which from a year ago-to-date has had more dip than zip (Q1 and Q2), but then exhibited REAL zip (Q3), only to since re-dip but now get some grip (Q4):
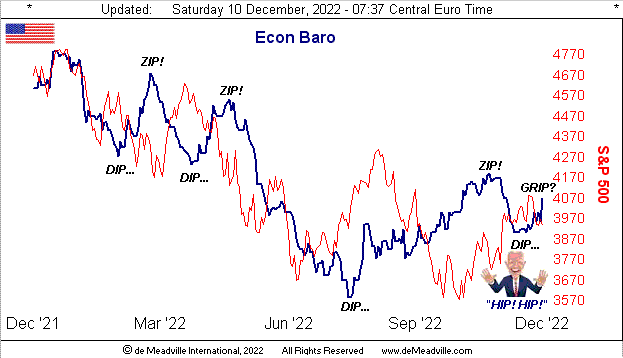
On balance, this past week gave the Baro some grip, albeit within it all came some scare from Core Personal Consumption Expenditures Prices, (aka "The Fed's Favoured Gauge of Inflation"): the measure increased for November by +0.4% or double the expectation of just +0.2% (on the heels of it being just +0.1% in October). We'll see what the Federal Reserve's powers that be have to say via their Open Market Committee's Policy Statement and Powell's Presser come Wednesday (14 December). Still, November's Institute for Supply Management Services reading improved as did December's initial look at the
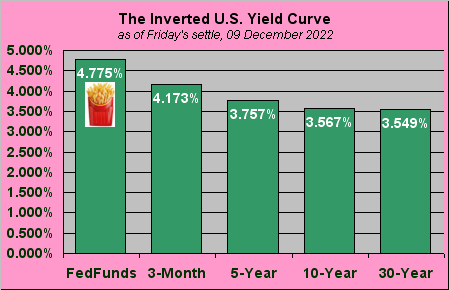
'Course from the "Make More in Less Time Dept." comes the StateSide economic engine's neglected spanner-in-the-works known as the Inverted Yield Curve, (defined in yer Funkin' Wagnalls as "back-assward"). Hey: is that FedFunds Window a "drive-through"? (Or do ya have to be a bank...) Either way, watch this space long enough and you may find in a quarter or two that it has recession written all over it:
Speaking of which, well down-under at Adrian Orr's Reserve Bank of New Zealand, recession is being sought such as to quell inflation by having folks cut their spending. Brings to mind the old line that "Capitalism isn't perfect, but it's the best thing we've got..." given 'tis bi-directional.
Then from Wellington New Zealand, put yourself on a vector of 326° for some 11,000km and you'll learn in Beijing China that PRC exports have flopped the fastest since the creation of COVID-19:  "Hey Nineteen..." --[Steely Dan, '80]. In turn, declining goods' shipments may not bode well for Bentonville
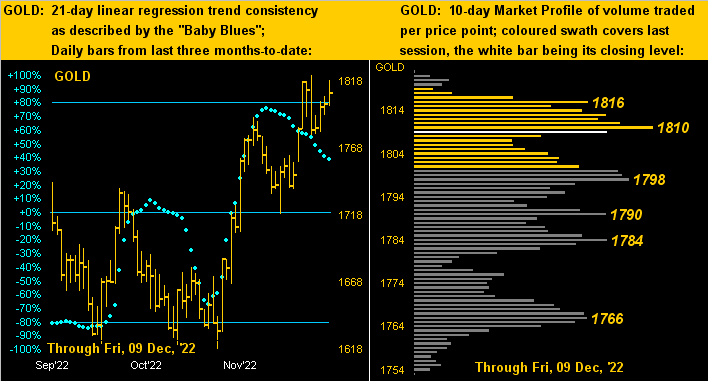
Yet as earlier suggested, you can get Gold valued today at $3,872/oz. via the discount store price of just $1,809/oz. "I'd call that a bargain, The best I ever had..." --[The Who, '71]. 'Tis the level of the rightmost nub in the more expanded three-month view of Gold's daily bars (below left), wherein again the declining "Baby Blues" detect the ongoing uptrend as less consistent. As for Gold's 10-day Market Profile (below right), the aforeshown narrowing of the EDTR is made manifest by the bunching of the volume bars per price point:
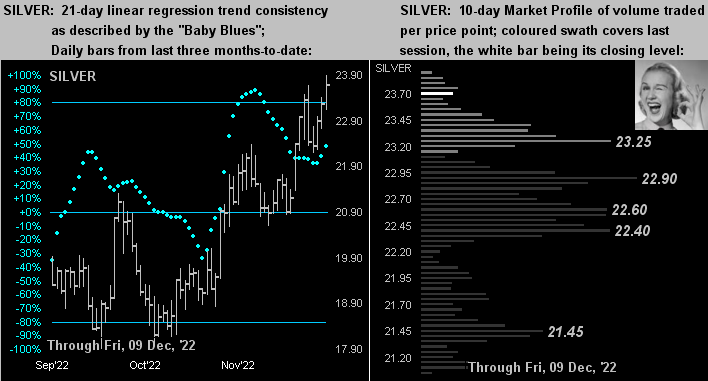
Now comparatively by the same graphic presentation for Silver, she actually appears a bit better than does Gold. And if your sharp eyes picked up the Gold/Silver ratio (in the weekly bars graphic) of 76.4x, 'tis its lowest reading in nearly eight months (since 18 April). How lovely 'tis to see Sister Silver getting the bid! (Oh baby...):
So with Gold somewhat "on hold" ahead of Fed Week plus 13 incoming metrics for the Econ Baro, we'll fly out the door with these three observances:
■ The newsworld's once emblematic New York Times (e.g. from back in Hugh Baillie's day) is facing its first workers' walkout in nearly 50 years. But as readership continues to fizzle, shall anyone take notice? All the news that's fit to print, what?
■ So here we go: Goldman Sachs (whose market calls back in our AvidTrader days we tracked as being relatively right some 50% of the time) has projected the state of the global economy to be one of declining growth for the next 50 years. That's cute. Let's first see how they do for 2023. (Mind the Econ Baro).
■ Finally, 'tis the end an untouchable era up in
And as always, forever fly Gold!

Cheers!
...m...
About the author
