NEW HIGHS FOR GOLD?
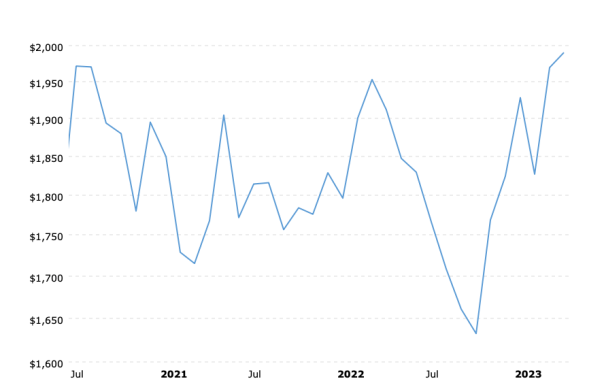
All of the talk about new highs in the gold price seem to be wishful thinking unless one is focused on only nominal prices. Below is a chart of monthly average closing prices for physical gold since the summer of 2020…
Gold Prices Since 2020

The chart indicates that the nominal gold price has now exceeded the highs posted in July/August 2020. As a result, there is an abundance of expectations for further upside potential. The enthusiasm is justified by some who point to numerous non-fundamentals, including expectations for a renewal of QE and lower interest rates, higher inflation, a possible recession, a loss of U.S. dollar reserve status, gold’s supposed role as safe-haven hedge, etc.
MORE CHARTS AND COMMENTS
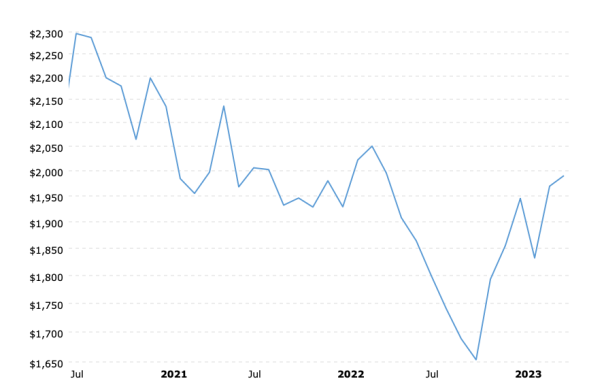
We’ll come back to some of those non-fundamentals later. Right now, here is another chart of monthly average closing prices for gold for the same time frame with the prices adjusted for the effects of inflation…
Gold Prices (inflation-adjusted) Since 2020

Both of the above charts are identical except that the second chart allows for the loss of purchasing power in the U.S. dollar over the period of time since the summer of 2020.
It serves as a repudiation of all the arguments gold bulls make in favor of their ongoing expectations for higher prices.
Aside from all of the contradictions and inconsistencies which accompany the non-fundamental arguments put forth in favor of higher gold prices, new highs, etc., there is one particular item that stands out.
One of the more emphatic arguments made in favor of holding gold is that it serves as a hedge against inflation. That does not appear to be the case, though, when you look at the second chart.
What has happened is that the effects of inflation over the past three years have shaved almost fifteen percent from the purchasing power of gold.
In order for gold to match its 2020 high, it would need to be $2300 oz. today. The new highs that some are expecting won’t come unless gold suddenly bolts higher by more than three hundred dollars.
No brainier, right? Gold is undervalued and underpriced in the short-term. Soon it will be $3000 oz., or more.
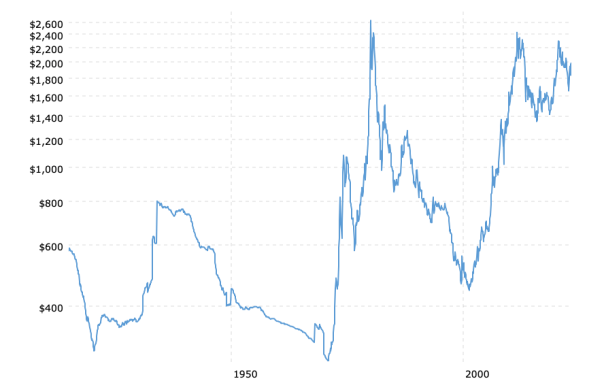
Possibly. However, lets take a look at a third chart. This one is a one hundred year history of gold prices on an inflation-adjusted basis…
Gold Prices (inflation-adjusted) – 100 Year Historical Chart

After more than six decades of Federal Reserve inflation, the effects on the U.S. dollar were finally reflected in a gold price that increased from an official/artificial gold price of $35 oz. to a January 1980 market high of $678 oz. (based on monthly average closing prices). Afterwords, the gold price declined for more than twenty years to a low of $250 oz.
When the gold price increased from $250 oz. in 2000-01 to $1895 oz., it did not represent new highs for gold, except in nominal terms. When allowing for the effects of inflation, the gold price didn’t even match, let alone exceed, its 1980 high.
Similarly, when gold peaked at over $2000 oz. in 2020 (third peak on the chart immediately above) it did not match or exceed its previous peak in 2011.
That brings us back to where this article began. Gold is lower than in 2020 and has repeatedly failed to exceed its previous major highs in inflation-adjusted terms. Why?
GOLD’S VALUE IS CONSTANT
One ounce of gold today has no more value than one ounce of gold forty years ago, or a century ago, etc.
The gold price peaks in 1980, 2011, and 2020 represent a confirmation of the loss of purchasing power in the U.S. dollar up to that particular point.
THOSE PEAKS WILL NEVER BE EXCEEDED IN INFLATION-ADJUSTED TERMS, regardless of how high the nominal price goes.
In order for the gold price in current dollars to match its 1980 high, it would need to be more than $2600 oz. today. Which is why, that even if the gold price were to move above $2060 oz. immediately, it would not mean new highs for gold.
If you believe that gold is primed and ready for a move to $4000 oz., then you need to ask yourself why that would happen. What would it take to cause the gold price to double?
There is only one thing that can happen in order for that to occur – a further loss in U.S. dollar purchasing power that would result in a doubling of prices for all goods and services.
If it were to happen rapidly, any gold profits would be needed to offset the much higher cost of living. If you had all of your money in gold, the best you could do is preserve your wealth.
Are you prepared to bet all you own on that outcome?
GOLD FACTS AND FUNDAMENTALS
There is only one fundamental associated with a higher gold price. That single fundamental is the U.S. dollar.
The higher price of gold in dollars is a reflection of the loss in purchasing power of the U.S. dollar that has already occurred; nothing else.
The price of gold tells us nothing about gold; rather, it tells us what has happened to the U.S. dollar.
What some investors and others call bull markets in gold (1971-80; 2001-2011; 2016-2020) are nothing more than the gold price playing catch-up to the most recent effects of inflation.
The price of gold at $2000 oz. represents a ninety-nine percent decline in U.S dollar purchasing power since the origin of the Federal Reserve in 1913.
Eventually, the gold price will approach or match its inflation-adjusted high again. Historically speaking, that could take many years. (also see $10000 Gold Or A Triple Top and Gold’s Singular Role)
Kelsey Williams is the author of two books: INFLATION, WHAT IT IS, WHAT IT ISN’T, AND WHO’S RESPONSIBLE FOR IT and ALL HAIL THE FED!


