Precious metals still locked down
With an understanding that there is always much more in play than nominal charts (the macro & sector fundamentals for example, which bounced of late but never did definitively flip positive), let’s review said nominal charts of gold, silver and HUI along with an update of the Gold/Silver ratio for good measure.
Meanwhile, we will continue to update the full spectrum of considerations for a positive view of the precious metals complex, including gold’s standing vs. cyclical, risk on markets/assets, the state of speculative vs. quality credit spreads, the inflationary backdrop (despite promotions to the contrary, cyclical inflation is not beneficial to the gold mining industry), the seasonal averages and the charts of the metals and miners over various time frames in NFTRH.
Gold
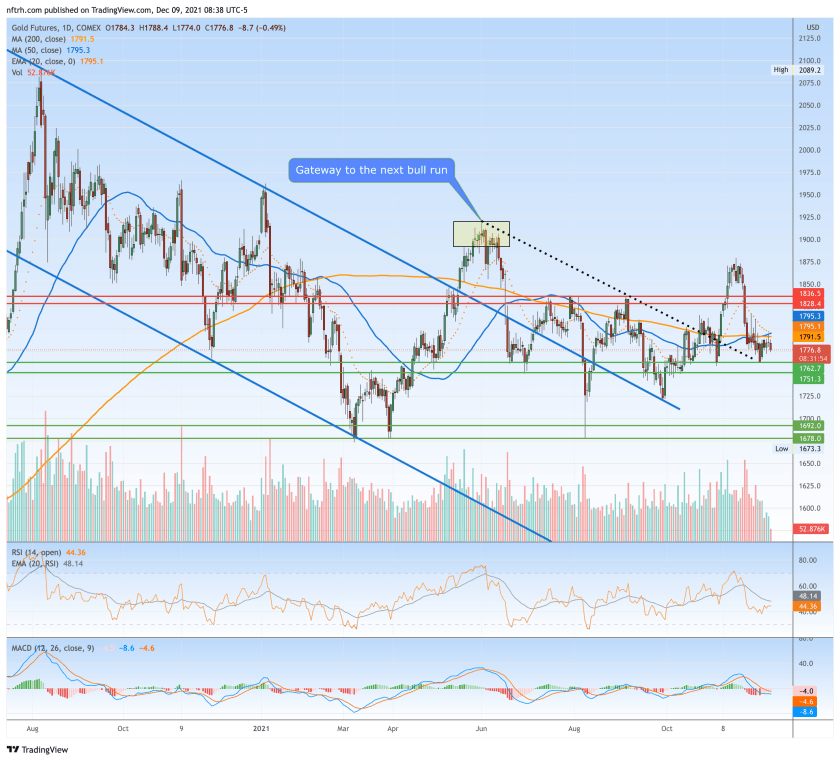
The daily chart shows the gold price (futures) below the moving averages but above short-term support after failing – amid much personally observed cheer leading to the contrary – to cross the bull gateway at 1920.
As a side note, the broken blue downtrend channel on this daily chart is actually the Handle to a large and bullish big picture Cup that only has one thing going against it that I can see; too much exposure by too many TAs, which of course means it may not be expressed until many of those TAs recant their stories (we have noted all along that the Handle can drop all the way to the 1500s without damaging the 2022 bullish Cup story. Indeed, if it were to happen (not predicting folks, but being prepared) it would be healthy. There is nothing healthier than a good running of the bugs before a major bull move.
Silver
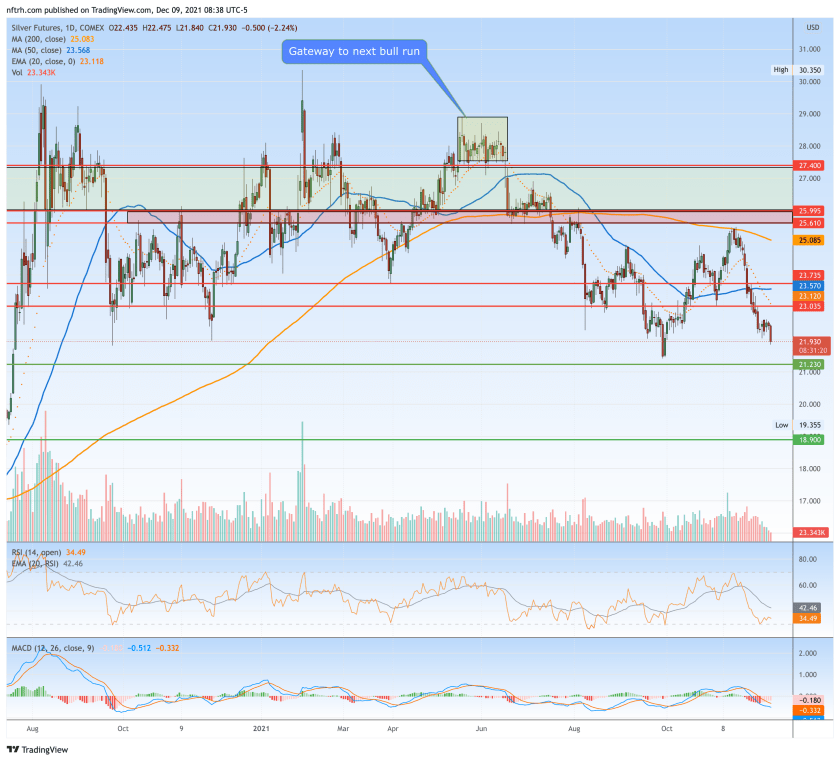
The silver price (futures) had risen all the way to the objective, which was the now down-turning SMA 200. It then not surprisingly (if you dismissed the pom pom waving) failed there. This keeps open the possibility of a drop to just below 19 in what could still be termed a bigger picture bull market, sloppy (compared to gold) though it is.
Gold/Silver Ratio
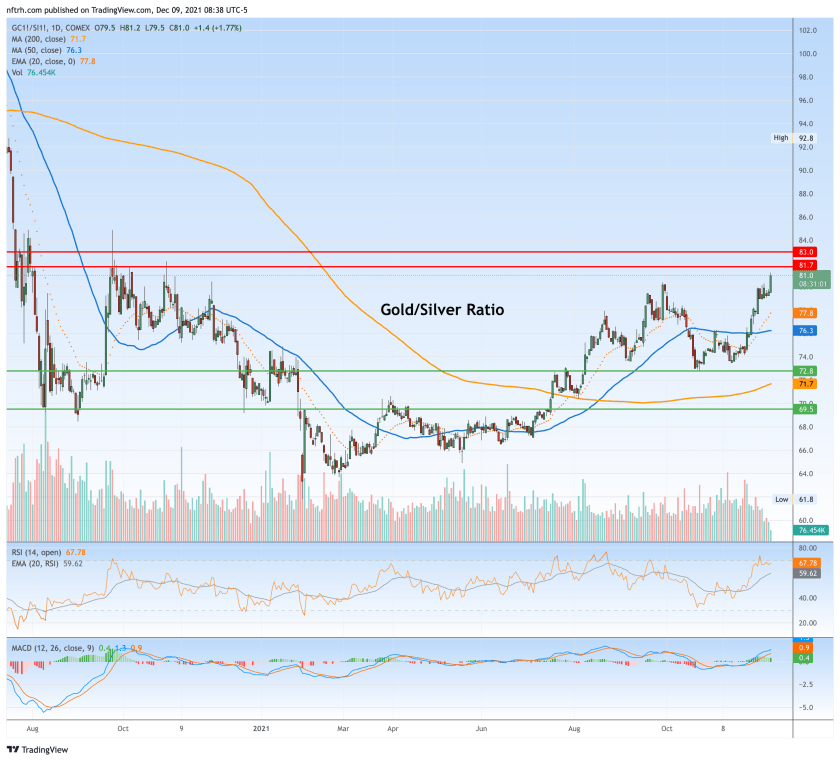
The GSR is accompanying its fellow market liquidity extractor, the US dollar, as updated recently, upward. With silver having lost leadership gold stocks, which tend to rise when silver is leading, and fall when both metals are bear trending with gold firm relative to silver, would be vulnerable. As for the rest of the markets, a rising GSR is often but not always bearish. The less cyclical and inflation-sensitive the better, if the GSR and USD continue to rise together (USD is near the third of NFTRH’s three upside targets (98) while the target for GSR, not necessarily a stop sign, is noted in the 81-83 area).
HUI
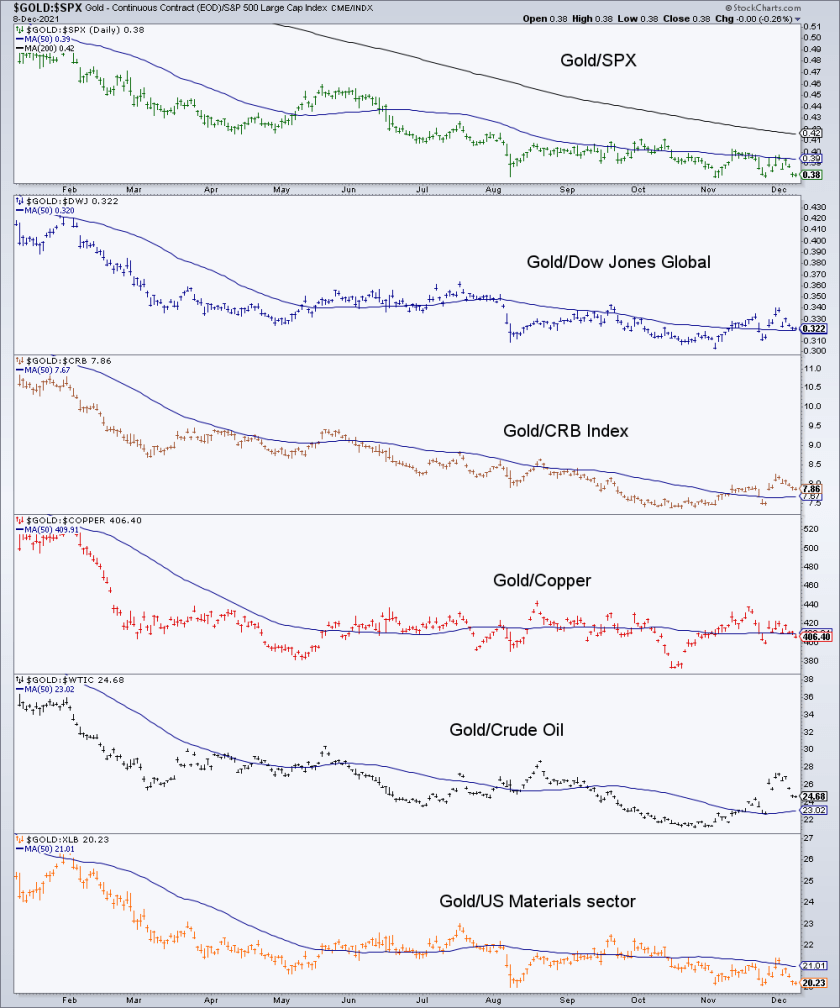
I have been leaning toward an oversold bounce for the sector, but (okay, we’ll slip one macro chart into this post) as you can see said bounce would be without some important fundamentals at Huey’s back. Recently constructive ratios of gold vs. cyclical and inflation markets have dropped again this week.
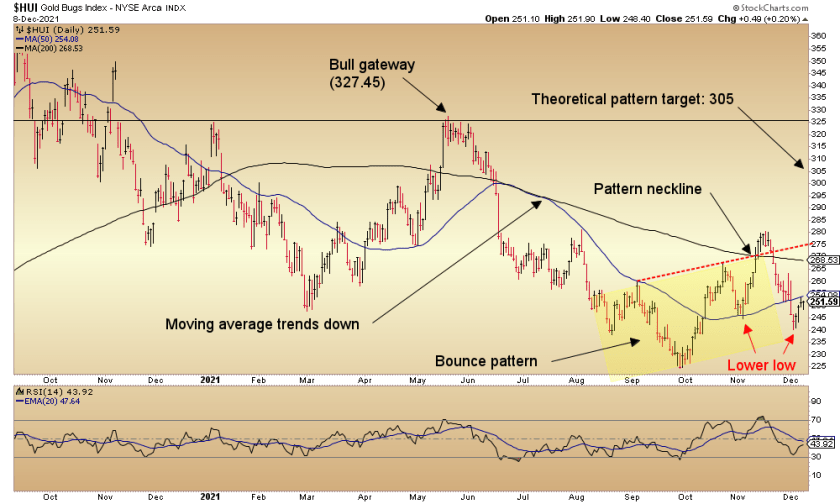
HUI had formed a daily chart pattern that you, I and a legion of TAs saw form…

The index then expressed upward, took out the SMA 200 and in typical gold stock fashion, failed miserably. While there was much gold bug excuse making about an “attack” by the cabal, the daily chart trends (SMA 50 and SMA 200) were and are down. Period. Too boot, as noted above, the fundamentals are not in order. Not yet.
So the lower low was a caution, as noted in NFTRH when it came about. So it may turn out that the bounce scenario was wrong (or already played out as HUI bounced to and lurks right below the SMA 50). Personally, aside from three long-term positions (per portfolios published each weekend in NFTRH) * I had added a few miners for an oversold bounce and may need to revisit that situation as the bounce could turn out to be of the mini variety. There is a whole wide market out there and while the time will come to ride a big gold stock rally, that time does not yet appear imminent, continued short-term bounce or not.
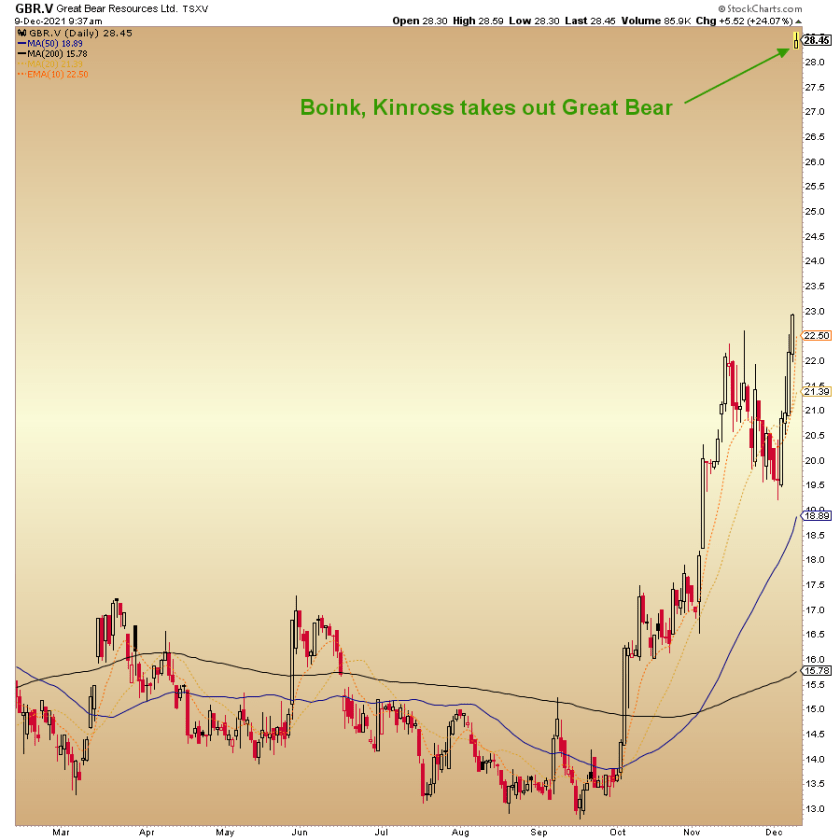
* Conveniently to this post, as I cringed a little expecting a decent pullback in my portfolios at Thursday’s market open, I had a pleasant and very green surprise as two of my three core gold stock positions get big gains at the open today, tacked on to even bigger gains overall. Hence, core. Great Bear’s gold in the ground has some value, eh? Now I’ll go see what the news is that drove this.

[edit] Well, the suitor is Kinross (KGC). With hat tips to a gold fund manager (Scott) for guiding me/NFTRH in a few years ago and a geologist/subscriber (Michael) for keeping us in, here is the news release and here is the chart. This certainly bodes well for other high quality gold assets as we transition to 2022 and what could be a whole new ballgame for the gold stock sector.
For “best of breed” top down analysis of all major markets, subscribe to NFTRH Premium, which includes an in-depth weekly market report, detailed market updates and NFTRH+ dynamic updates and chart/trade setup ideas. Subscribe by PayPal or credit card using a button on the right sidebar (if using a mobile device you may need to scroll down). Keep up to date with actionable public content at NFTRH.com by using the email form on the right sidebar. Follow via Twitter @NFTRHgt.

