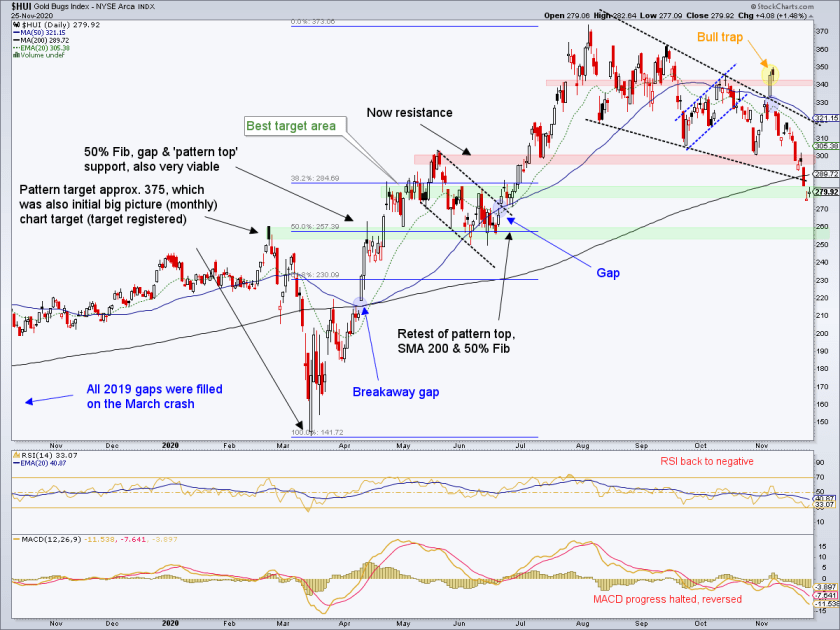
The last time I wrote a title like the above was on June 19th; and wouldn’t you know that the correction ended the very next trading day? The consolidation breakout on Monday, June 22 created the gap you will see as a downside objective on the daily chart of HUI below.
Gold Sector Correction is Maturing (6.19.20)
That was a routine correction as gold and the gold miners were still part of one big relief party as central banks flooded the markets with liquidity to meet the deflationary crisis of the virus-ridden spring.
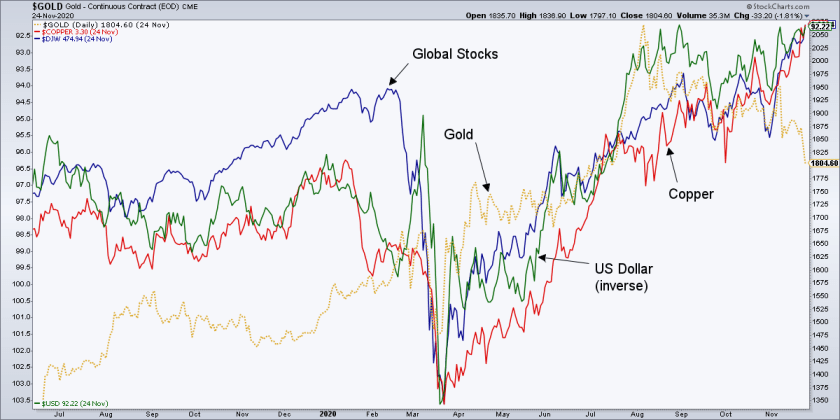
This time as you can see gold has disconnected from the party (as, obviously, have gold stocks), which continues on its merry way. Some gold bugs may cry foul but what is actually going on is that the normal recipients of cyclical inflation are getting bid as the US dollar declines (inverse USD shown here, rises). If there is an accident along the way to the recovery (or at least the Banana Republic) we will be reminded yet again ‘why gold?’.

I spend a lot of time writing about why this anti-market setup is normal, but that is beyond the scope of this article. Keep an eye on nftrh.com, or better yet, join NFTRH Premium for ongoing proven analysis that tells you what you need to hear, not what confirmation bias might imply you want to hear. See the post linked in the next paragraph for input from subscribers about how we handled the gold miners’ corrective process or this page for a multitude of completely unsolicited subscriber testimonials.
Many gold bugs are wrong time and time again because they follow the most loudly broadcast dogma. Suffice it to say, the herds that followed Warren and the usual gold promotion suspects were wrong again, especially in their obsession with the US dollar. The chart above shows gold and USD in decline and that is perfect.
What I want to do with this post, however, is to plot the bottoming zones for HUI now that the sector is in extremis and we have arrived here safely. In fact, speaking personally the thing I find amazing is that due to a silver short as a hedge and positions in broad stocks, commodities and resources, I am having one of my best weeks of a very successful year despite having held some gold stocks that I chose not to sell into the oncoming correction and despite this tank job right to our long-standing ‘best’ target of 280 +/-.
A note here; the next target at 260 +/- is and has been very viable as well. Target 1 is a 38% Fib retrace to the area of the rising 200 day average and Target 2 fills a gap (ref. 1st paragraph above), retraces 50% of the rally and tests the top of the February-April crash pattern to boot. If you have been prepared then you should still be prepared… to buy quality gold stocks (we chart 20 to 30 of them every week in NFTRH). The correction is hitting its harshest stage, the traditional and inevitable final running of the true believer bugs. From this comes significant opportunity that will have been worth the patience this correction has demanded.

For “best of breed” top down analysis of all major markets, subscribe to NFTRH Premium, which includes an in-depth weekly market report, detailed interim market updates and NFTRH+ dynamic updates and chart/trade setup ideas. You can also keep up to date with actionable public content at NFTRH.com by using the email form on the right sidebar. Follow via Twitter @NFTRHgt.

