
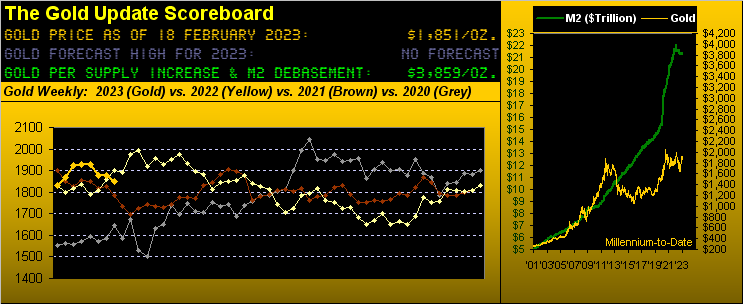
Yes, Gold's key weekly parabolic trend as anticipated has flipped to Short, but with underlying support for a safe haven port. We'll get to that, but we're really compelled to begin with this:
Recall as follows from just two missives ago: "...was the Federal Open Market Committee premature in reducing its Bank's Funds Rate increase from +50bp to +25bp?" --[Source: "Stocks Go Gaga; Gold's (Foreseen) Falling Saga", 04 February '23]
Now two weeks hence we read that both St. Louis FedPrez James "Bullish" Bullard and Cleveland FedPrez Loretta "Get Back" Mester have said they (hat-tip Dow Jones Newswires) "...would have supported raising interest rates by a half percentage point at the central bank’s meeting earlier this month given the strength of economic demand and inflation..." More later upon bringing up (literally) our Economic Barometer.
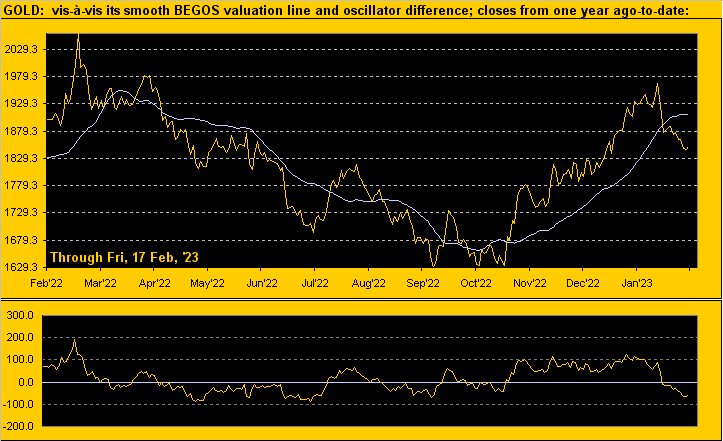
As for Gold's foreseen falling saga (and more so from its recent stall) as you regular readers know such writing has been on the wall. For four missives back we penned "...Gold is 105 points above the [smooth valuation] line. Thus a "test" of those 1800s may be nigh..." The yellow metal having settled that week ending 20 January at 1928, price has since dumped as much as -100 points toward closing yesterday (Friday) at 1851. And as much as we've pushed for the 1800s to be supportive, thus far during this fall, Gold has sliced through them as a hot knife through butter. First to Gold vis-à-vis that smooth valuation line and then to the weekly bars
And as we below see, Gold has swiftly come off its rightmost peak (in the upper panel), careening down through the smooth valuation line such that per the oscillator (price less value in the lower panel) price is now some -59 points "low".
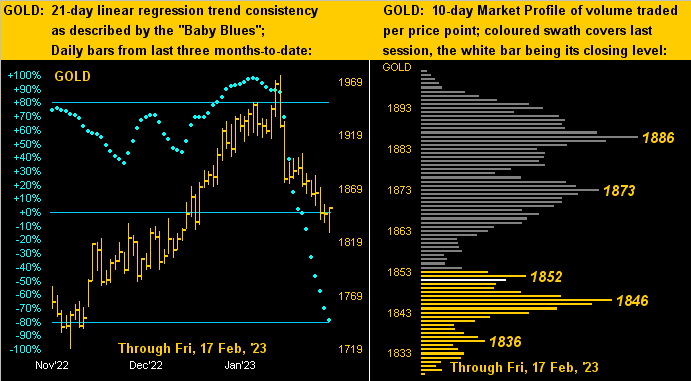
And second in turning to Gold's weekly bars, as noted the parabolic Long trend of 14 weeks has now flipped to Short, heralded by the rightmost red dot. And drawing upon that from our prior two pieces: "...for the past 10 parabolic Short trends, the average decline from the flip price [of 1863] is -153 points ... However, a move from 1863 - 153 = 1710 seems irrational..." Thus we look for the freshly entered 1851-1798 support zone to hold for Gold:
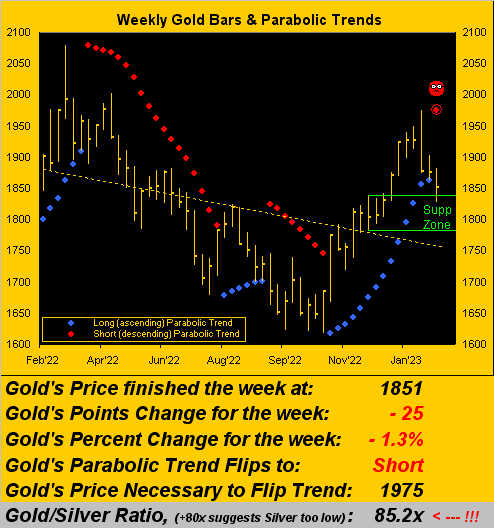
Can weekly Parabolic Short trends themselves be short-lived? Absolutely! Of the 46 prior Short trends century-to-date, 10 have lasted just five or less weeks. Hopefully this latest foray shall also be of short-duration, especially should the support zone hold and other 3D fears (Debasement, Debt, Derivatives) unfold. (See too Default in our closing ... oooh the fourth dimension...).
Now to the aforementioned Economic Barometer: and has it ever whirled 'round to the upside! Of the past week's barrage of 18 incoming metrics, only a wee three were worse month-over-month (February's Philly Fed Index, plus January's Housing Starts and Capacity Utilization). To be sure, January's inflation increased markedly at both the Retail and Wholesale levels: the CPI's headline pace went from +0.1% to +0.5% and that for the PPI from -0.2% to +0.7%. But be it bullish "demand-pull" inflation or bearish "supply-push" inflation, the Econ Baro treats both positively as the consumer stays engaged in economic activity. To wit:
January's Retail Sales increase of +3.0% was the largest since that for January a year ago (+4.9%) -- and ex-the "Coming out of COVID" during 2020-2021 -- the third largest month-over-month gain since that for October a-way back in 2001 even as the DotComBomb was running its course. Too, February's National Association of Home Builders Index posted its best monthly gain since the depths of COVID in 2020. And from the "Things Are Getting Worse More Slowly Dept." which the Baro also takes as a positive, February's New York State Empire Index weakened far less than it did in January. The result? "BOOM!" You go, Joe:
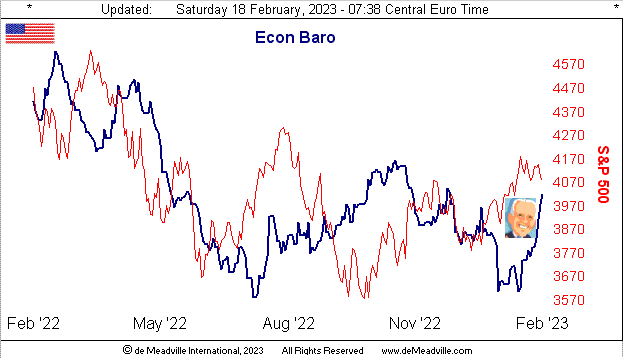
'Course, our FinMedia friends are all amped up that -- measured annually -- inflation is slowing, indeed DJNW printing that "Annual inflation cooled for the seventh straight month". But shall those January leaps rule out an eighth month of cooling? To be sure, FedHeads are heating! And there's 22 trading days of teeth grinding until the Federal Open Market Committee's next Policy Statement come 22 March. With the current FedFunds target range at 4.50%-4.75%, the FedFundsFutures have yet to price in a +50bp rate hike ... mais on verra, eh? Watch that Econ Baro(!)
Watch, too, Gold's "Baby Blues", at present in full plummet on the left per the panel of the daily bars from three months ago-to-date. Again: 1851-1798 we view as support, and whether by coincidence or not, after trading on Friday to as low as 1828, Gold then scampered back up in settling right at that 1851 level. And as for the 10-day Market Profile on the right, enough trading volume ensued in the latter half of this past week such as to build the denoted 1846 apex, indeed the second-most commonly traded price across the past fortnight:
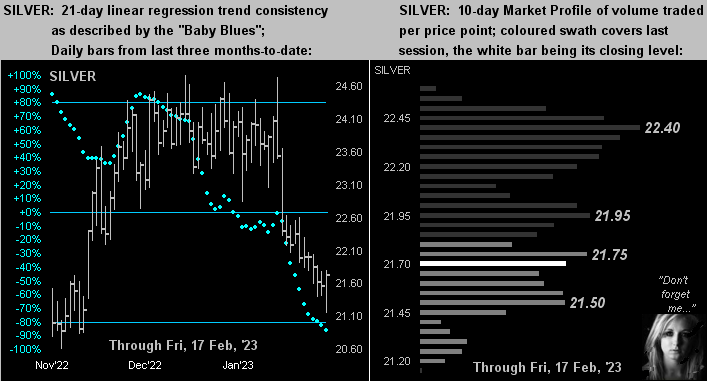
Silver's two-panel drill is similar to that for Gold, albeit her "Baby Blues" (below left) have been in decline for a good month more than those of the yellow metal. Still, the white metal has managed to somewhat vacate her Market Profile cellar (below right) in which she'd been a dweller the two prior weeks. And yet relative to Gold, Silver remains ever so cheap vis-à-vis the Gold/Silver ratio now at 85.2x, given the average from 2001-to-date being 67.3x. Revert to that average today puts Silver +21% higher in price from her present 21.72 level to 27.50. Don't forget Sister Silver!
"And as for the S&P, mmb?"
Ever remindful is our man Squire. It thus highlights the first of our three closing time-ticking notes:
■ In contributing to the ever-mighty Forbes, one Michael Cannivet penned this past week that "The S&P 500 Is The Most Popular And Overpriced Benchmark In The World" Understatement, that. With two weeks to go in Q4 Earnings Season, 383 of the 503 S&P 500 constituents have reported. Of those 383, 370 posted positive EPS in both Q4 2021 and 2022. Therein, the median percentage earnings improvement is +6.2%. But to calculate it honestly -- for after all 'tis an Index -- apply the capitalization-weighting for each of those 370 constituents and the median improvement instead drops to 0.0% ("zero"). Thus 'tis no wonder our "live" price/earnings ratio for the S&P 500 completed its week at a still ridiculously high 39.9x, (the S&P's lifetime mean p/e being 22.5x). And as Bloomy put it last evening, " Wall Street is Baffled by the Stock Market". Ya don't say. "Tick tick tick goes the clock clock clock..."
■ The "D" word certainly is getting more traction amidst the media these days, SecTreas Janet "Old Yeller" Yellen essentially imploring Congress to raise the debt limit, (else face an event of Default). And yet, from where comes the money, (if it can be called "money")? Last month the StateSide government reached the present $31 trillion debt ceiling ... and yet the Money Supply ("M2") is but $21 trillion. Still, that $10 trillion gap could be closed if each of America's 332 million folks ponied up $30,000 apiece. ('Course, then there's the private sector debt). Reprise: "Tick tick tick goes the clock clock clock..."
■ Finally from the "Here He Comes Again Dept." (to whom we alluded this past December) we've "The Gools" under consideration to fill Lael "The Brain" Brainard's position as FedViceChair, (her moving on to be Director of the Administration's economic policy). As we last stated, at least Austan Goolsbee (currently ChiFedPrez) may bring some mirth to the Fed, despite its too facing (two-facing?) "Tick tick tick goes the clock clock clock..."
Hopefully 'tis Gold that drives your clock!

Cheers!
...m...
About the author
