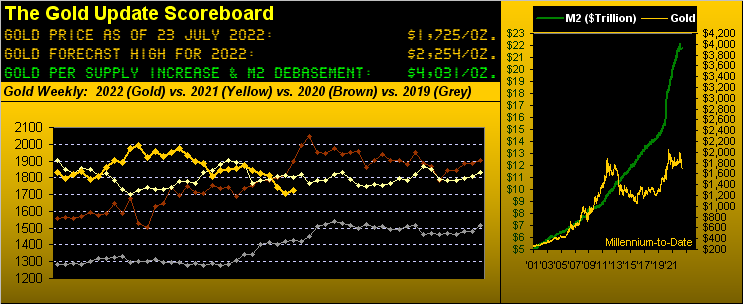
First the "Bad" bit, (which you regular Gold followers just well-witnessed): price on Thursday (21 July) traded down to its year-to-date low of 1678, a level up to which Gold first traded on 04 August 2011, the StateSide Money Supply ("M2" basis) then less than one-half (43%) what it is today. Go ahead and say it: "What in the name of Sam Houston are we doing down here?" (We love our Texas readers). But until Gold is re-identified as not being dead money, we look for price's languishing to continue, even in maintaining our forecast high for this year of 2254. For as stated a week ago, Gold can become "real popular real fast" once it gets back on the go.
Second the "Good" bit, (this is a real stretch): despite having traded down to the year's 1678 low, Gold recovered late Thursday-into-Friday (yesterday) toward posting its first net weekly gain -- +19 points -- in turn stopping a five-week losing streak by settling at 1725. 'Course, +19 points is nothing about which to write home, nor does it even match Gold's "expected daily trading range" now 26 points, (let along the weekly measure now 60 points).
"But wait, mmb, don't you think that Thursday plunge to 1678 was the capitulation?"
As guided by volume, Squire, 'twould not appear so; indeed hardly was it a "plunge" as opposed to fairly normal bear market selling. Thursday's total volume of 174,466 Gold contracts traded ranks fifth lightest for the 15 trading days thus far in July. No capitulative panic there.
And yet, why so precisely at 1678 did Gold curtail its cascade, (or has it?). Either way, recall this as penned in The Gold Update just two weeks ago:
"...So how low may Gold go? ... the case can be made that Gold remains in a more broadly-based 1920-1678 zone ... let's just say we don't wish to see last year's 09 August low of 1678 go..."
And "go" it almost did on Thursday. Precision right to 1678 is great, but be still our beating heart: the next "structural low" for Gold is 1451 from back during COVID Kickoff Week (16-20 March, 2020). That is not a prediction, rather a monetary travesty were it to recur.
Still, in turning to Gold's weekly bars, despite the red-dotted parabolic Short trend having completed its 17th week, (this century's record being 31 weeks upon Gold's having come off the boil back in 2013), the chart's dashed linear regression trendline remains positive, (notwithstanding it becoming less so by the week):
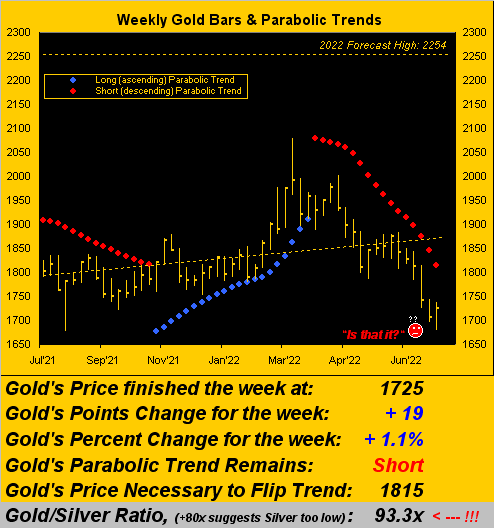
Further should the 1678 low continue to hold, what overhead price might we behold?
■ Technically what had been Gold's 1854-1779 support zone mirrors into the 1779-1854 resistance zone, the key price therein (barely) being the 1785 low of 16 May. Penetrate that and it ought be "Hello 1800s!" (No, 'tis not very exciting).
■ Fundamentally the common-sense, no-brainer, blatantly-obvious Gold target is simply the Scoreboard's debasement valuation level of 4031. (Yet that would be too easy, and moreover ruin the "M Word" crowd over there at the COMEX; mum's the word, Mum [hat-tip Bill Shakespeare, 1591]).
Regardless with respect (or lack thereof) to the present state of the price of Gold, there you've the "Good" and the "Bad", the overall picture remaining butt-ugly. With all due deference to the eloquence with which we've maintained The Gold Update these many years, dare we say, even in acknowledging the market's never being wrong, Gold 1725 is a joke. But life amongst ignorance continues: "Did ya see all these hot IPOs comin' out?" May we reprise the dominos please:

Speaking of stocks, much media mirth is being made over the stock market's having apparently "bottomed out". All that pent-up concern over Q2 Earnings Season being weak clearly has being allayed!
To wit: of the S&P 500's 88 constituents having thus far reported, 68% have beaten estimates! ![]() "Happy days are here again..."
"Happy days are here again..."![]() --[Ager/Yellen (no noted relation to the TreaSec), '29].
--[Ager/Yellen (no noted relation to the TreaSec), '29].
'Course, the key data conveniently omitted (and probably not even calculated) is that just 52% actually improved their bottom lines of a year ago ... and the average year-over-year earnings increase thus far? +0.6%. That's it. Thus the "live" price/earning ratio of the S&P remains at a lofty 31.4x, i.e. zero earnings growth. 'Course, you regular readers saw it all coming these many months merely by musing the Economic Barometer, which has now oscillated to its low for this year, indeed an 18-month low, low-lighted by July's Philly Fed Index dropping from -3.3 to -12.3 and June's Leading (i.e. lagging) Indicators shrinking from -0.6% to -0.8%:
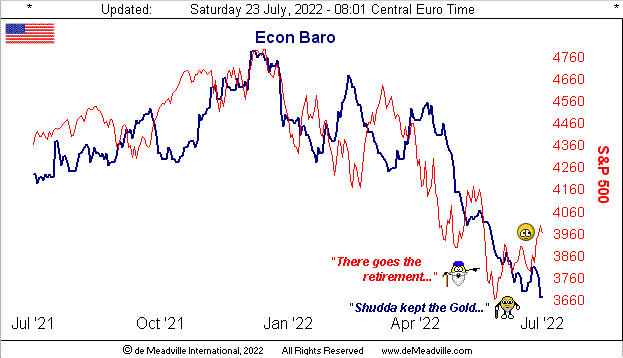
You also know by the Baro that StateSide Q2 Gross Domestic Product -- to be reported by the Bureau of Economic Analysis come Thursday 28 July, (following the Federal Open Market Committee's FedFunds rate increase on Wednesday 27 July) -- shall be nominally negative for the second consecutive quarter. Thus the balance of next week in turn shall be nothing but "The U.S. is in a recession!" which has already been the case on a REAL basis beginning with Q3 last year.
As well, S&P themselves just reported the seventh consecutive month of their Experian credit default reading as having increased. No surprise there given rising variable rates putting more squeeze on the CCC ("credit card crowd"). But until that card hits its limit, why go to work, eh? Add in (from California for example) the "inflation relief check" and life at home is good.
Meanwhile on this side of the pond, Lagarde & Co. increased their Bank's three key rates each by +50bp, the first such hikes in eleven years. This in turn firmed the €uro, the cost for which in Dollars had been reduced to exactly One Dollar a week earlier on Bastille Day; today the cost of one €uro is $1.02565 (-9.1% from its "inception" at 1.12890 during March 1994 prior to its actively being in use). The average cost of one €uro since going to market some seven years later at the CME back on 01 April 2001-to-date is $1.21960. Thus should you be scoring at home, the €uro today seems quite the bargain. Which contextually by currency debasement makes Gold (at present) the greatest bargain in history. Too bad 'tis deemed so curmudgeonly un-cool to own it.
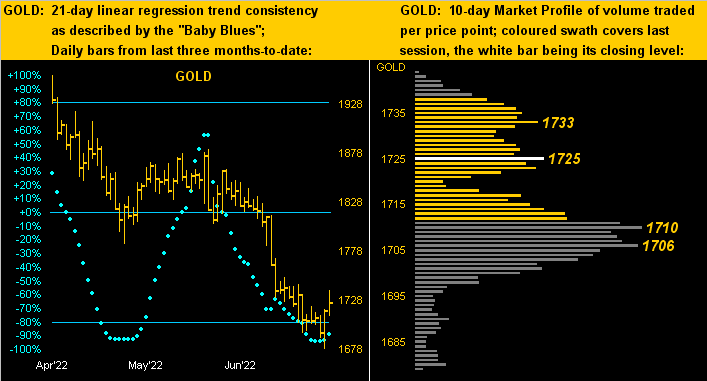
Yet, the following two-panel Gold graphic looks pretty cool. On the left across price's daily bars for the past three months we see the "Baby Blues" of trend consistency beginning to curl upward, one of our favourite leading trend-change signals. And on the right, price has finally moved up from the cellar of the 10-day Market Profile. Let's see if this sets the run to at least the aforementioned level of 1785:
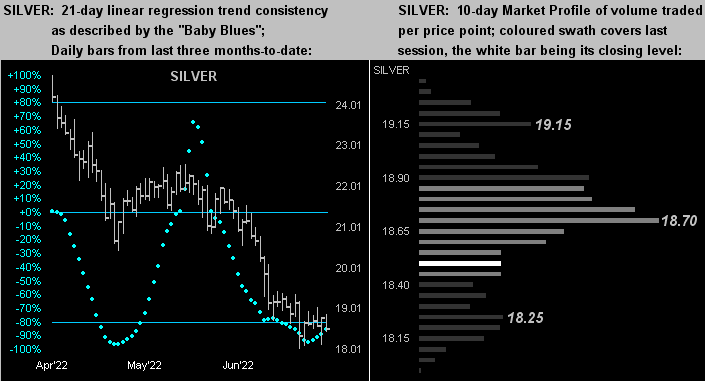
Silver's picture is relatively similar with respect to her "Baby Blues" (at left) looking to get off the mat; but the somewhat dominate 18.70 level in her Profile (at right) is the resistance through which Sister Silver need eclipse. No wonder the Gold/Silver ratio is a sky-high 93.3x over the 21st century's average of 66.9x:
Hopefully we've reinforced the point that Gold (and Silver too!) remain ridiculously cheap. In that vein, to close it out on a light summer note, here are three rather ridiculous media marvelings:
■ Reuters: "Biden Stops Short of Declaring Climate Emergency, Takes Steps on Wind Power"; might we simply say in a purely objective, apolitical way, this White House at times seems worryingly in a state of disarray, even as we wish them well;
■ Dow Jones Newswires: "All Jobs Businesses Cut in Pandemic Are Back, but Not Where They Were Lost"; we actually ran this past the finest of financial minds here, but none understood it;
■ The Wall Street Journal: "Armpit Hair Is Back, Whether You Like It or Not"; is this not supposed to be a financial publication? But 'twas right there on Monday's "front page" (just "below the fold" as was said in Hugh Baillie's day); he'd fire the lot of 'em today.
In any way, (good, bad, overall ugly or outright ridiculous), don't find your retirement hoovered away; get some Gold on the CHEAP today!

Oh good grief, Squire... Cheers!
...m...

