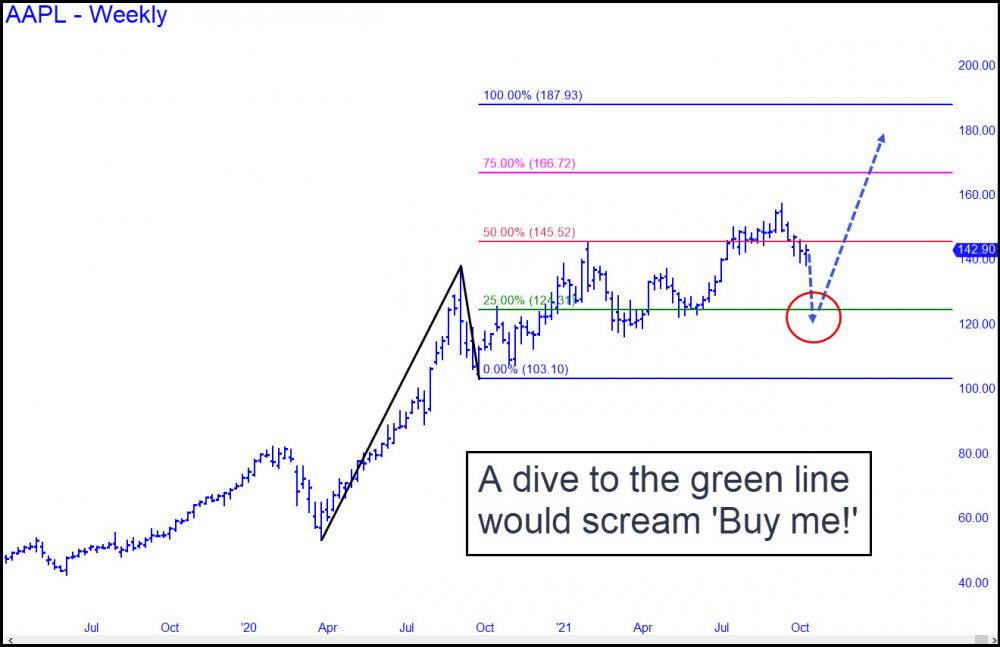
 If I had to pick one chart that shows why the bull market is probably not over, it would be the one above. To be sure, the 157.26 peak recorded by Apple shares a month ago was a great place for an important top to have occurred; this chart shows why. But THE top? I have my doubts. For if this were so, it would rank as one of the most visually boring summits ever achieved. For permabears who have waited patiently for a fitting climax to the most most insane bull market of them all, it would be like finding a WaWa Market at the top of a Himalayan peak they'd almost died scaling.
A few forecasters had precisely predicted a potentially important top at or very near $157, including your editor. Some of us even profited from put butterfly spreads purchased a month earlier that more than quintupled in value with AAPL's 12% drop so far. But it could be pressing one's luck to hold out for more, since the downtrend seems to be struggling increasingly and made no progress at all last week. Perhaps the selloff will turn nasty in the week ahead. But if so, keep in mind that a plunge to the green line would actually be bullish, tripping a 'mechanical' buy signal based on Rick's Picks' proprietary Hidden Pivot Method. It would also imply an eventual rally to as high as 187.93.
Setting the Hook
This scenario is congruent with one I raised here last week -- i.e., that the stock market will rally to yet one more record high, setting the hook in bulls and short-covering bears alike. A steep plunge in the weeks ahead would make a reversal to new highs even more persuasive, and therefore more deadly. Whatever happens, AAPL is still the 300-pound diva whose final aria will signal the end of the bull market begun nearly 13 years ago.

