
- This is a time of war, inflation… and a gold price of $1835?
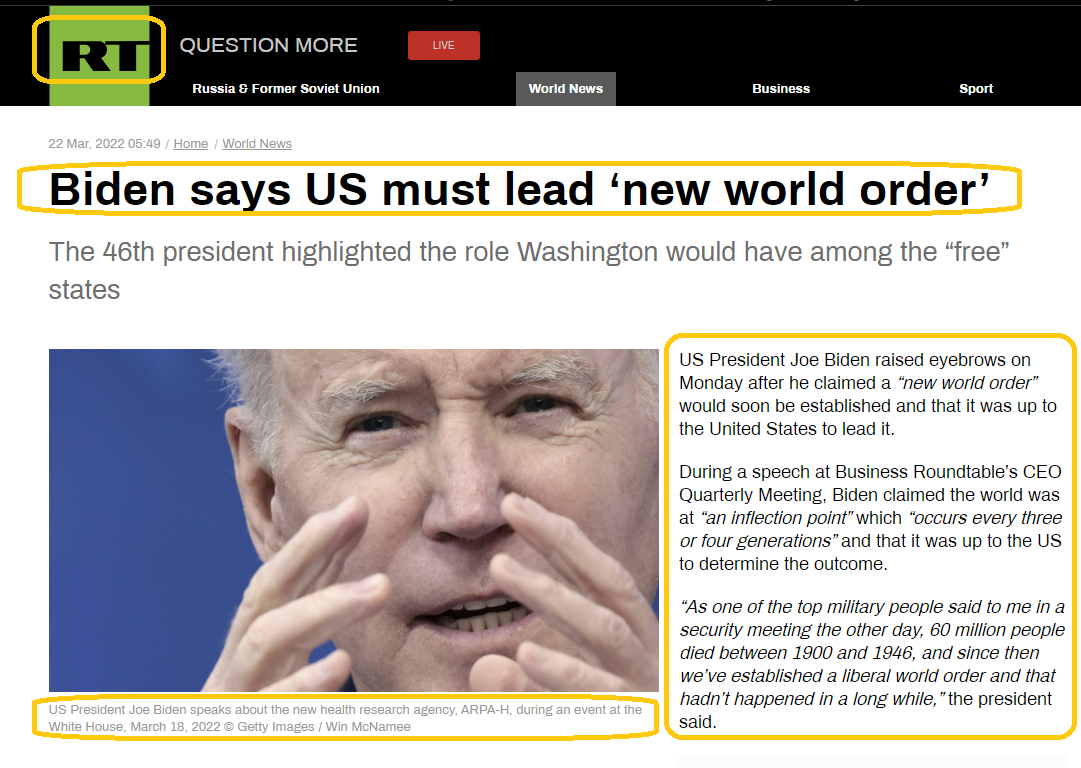
- Please click here now. The United States of America is arguably now better termed, “The United Meddlers of America”.
- “On the one hand, you are sanctioning right and left. On the other hand, you want countries to buy your Treasuries and finance your debt. That’s not a sustainable scenario.” – Gal Luft, Institute for the Analysis of Global Security, March 21, 2022.
- Meddling leads to conflict and pain for citizens. While the US government is nowhere near as draconian as the communist governments of Russia and China were decades ago… it is headed in that direction with significant velocity.
- Fiat money is borrowed, printed, and extorted from US taxpayers. It’s used by the government to fund a deranged, “We determine what’s best for others, and we call that freedom!” mantra. It’s not that “America” is bad. It’s the nature of… empire. All empires follow the same path, and it’s a path that begins with prudence, and ends with reckless horror.
- The end is happening with America now, and the end will happen in a similar way with China, India, and Africa… the empires that are rising with some prudence now.
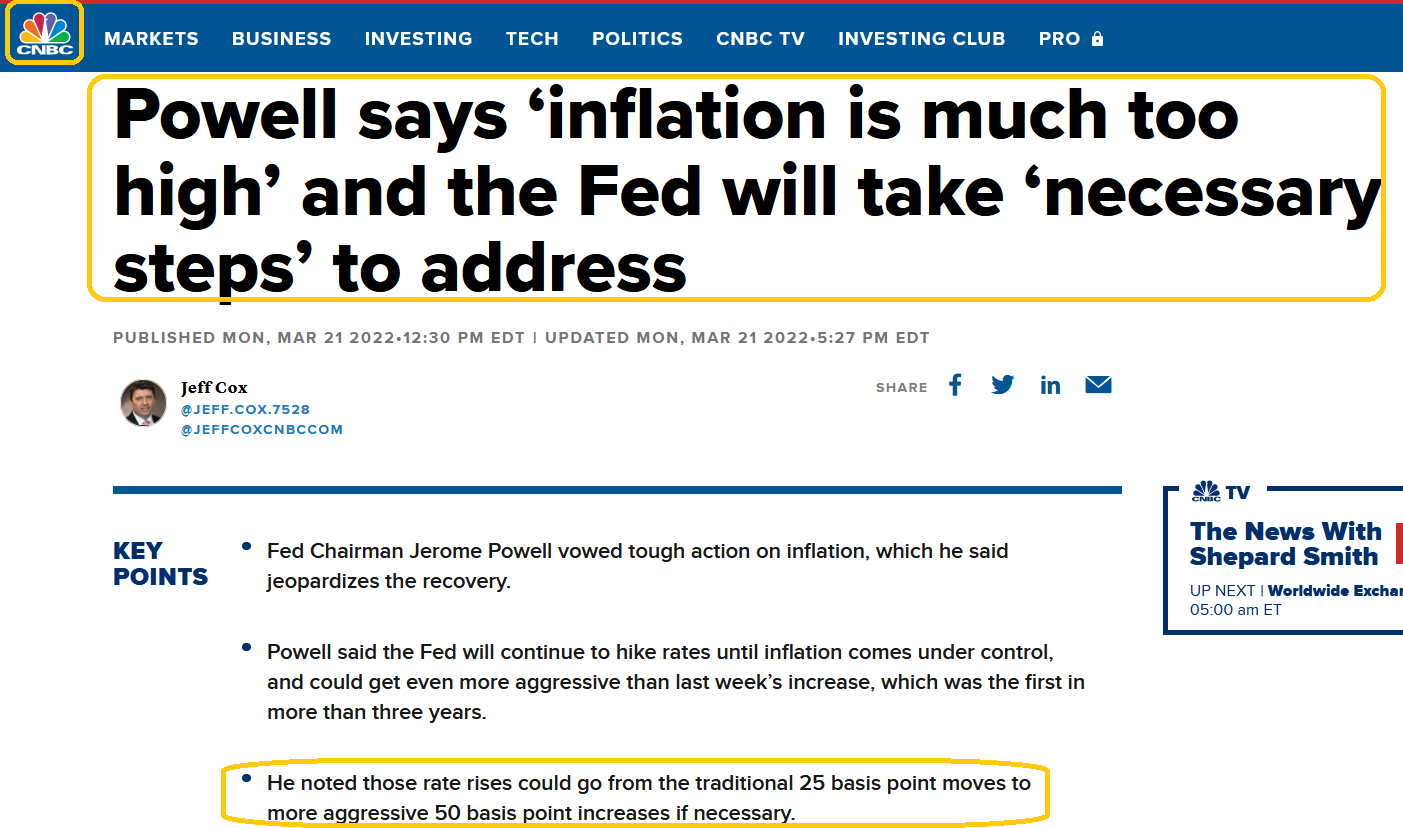
- Please click here now. Fiat kingpin Jay Powell has finally acknowledged the inflationary tidal wave that is ravaging the world.
- I’ve argued that if it gets out of control, a massive civil war in America could occur during this 2021-2025 war cycle.
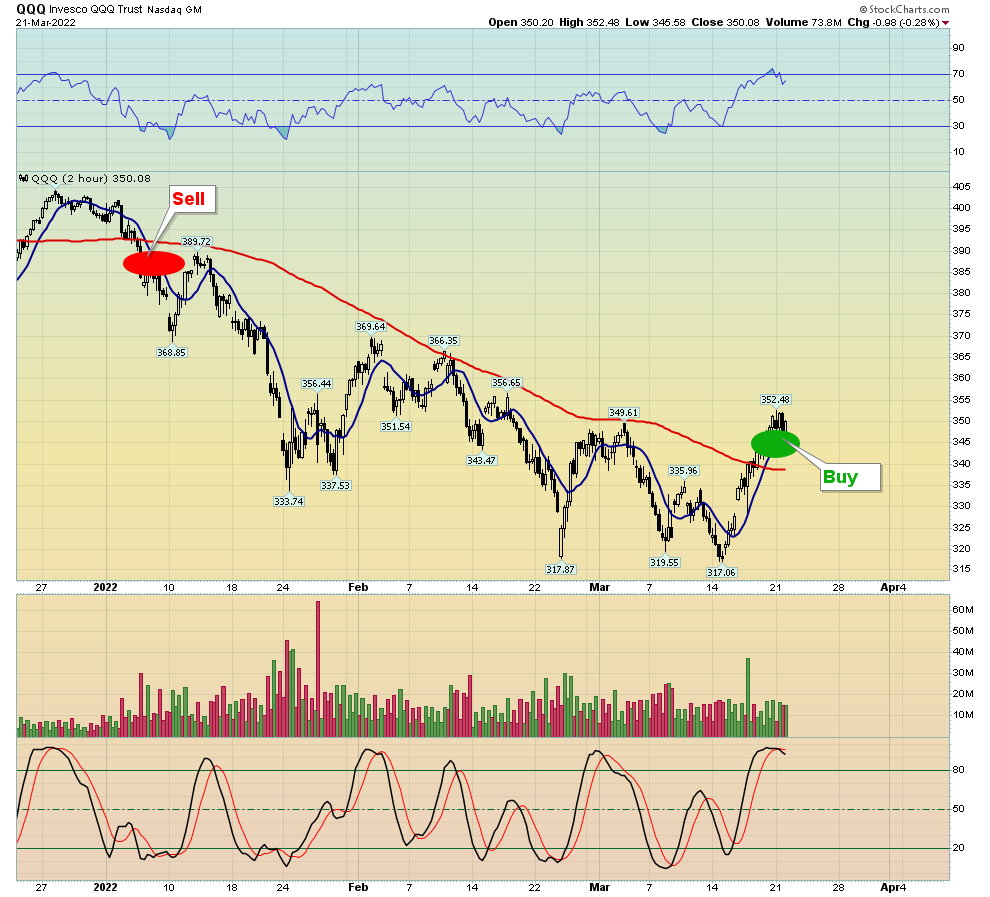
- Please click here now. Double-click to enlarge this two-hour Nasdaq ETF chart. As horrifying as the big picture for America is, my short-term 10,100 moving averages buy signal is in play, and it needs to be respected.
- These short-term signals have a winning track record for investors who use solid entry and exit tactics. For investors who believe in the long-term bullish picture for gold but want short-term action, my swing trade newsletter could be a good fit. I cover leveraged gold stocks items like GDXU, GDXD, SQQQ, TQQQ, and TBT. At $99/month, it’s a solid value, and this week I have a special offer of $249 for four full months! Send me an email if you want the offer, and I’ll get you set up promptly. Thank-you.
- For a look at the ominous big stock market picture,
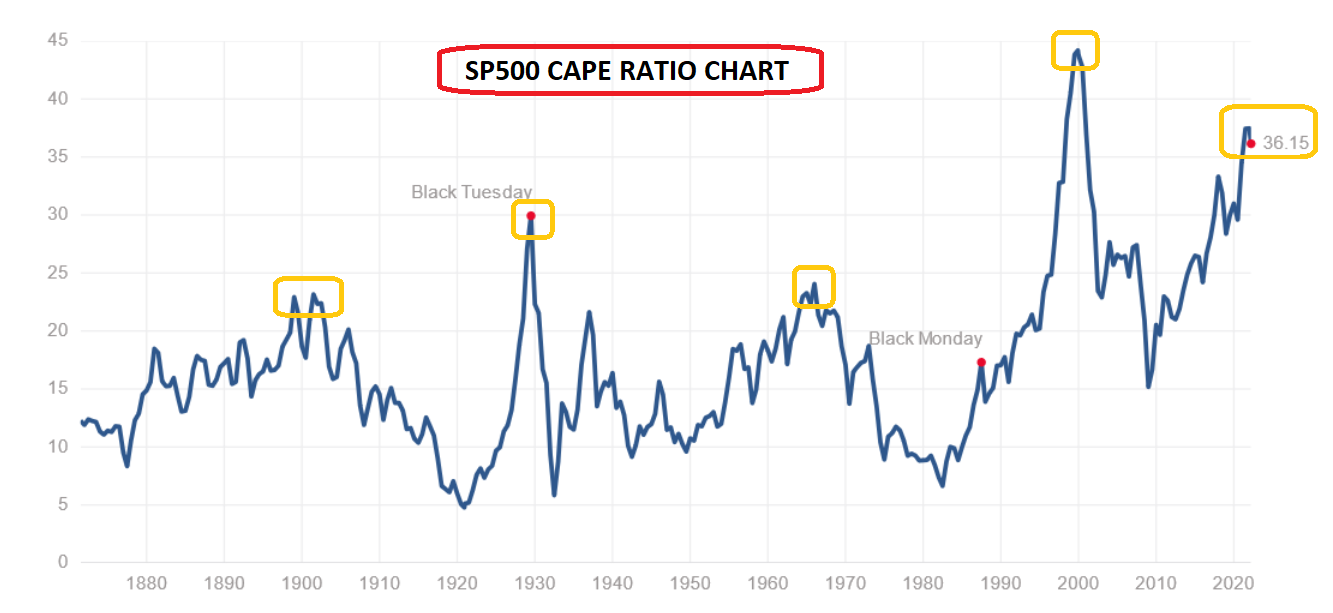 The Fed is turning hawk… with the SP500 CAPE ratio in the overvaluation stratosphere at 36. When the last US wave of stagflation began in 1966, the CAPE ratio was at 24… and that was high!
 - Most stock market investors have devolved into QE and zero interest rate welfare bums demanding endless fiat handouts from the Fed and the government. This, while almost 70% of the population of America has no savings after paying their food and shelter costs.
- Most of the current US stock market investors weren’t investing during the 1966-1982 equity market gulag, so they don’t believe such a gulag (or something even worse) can happen again.
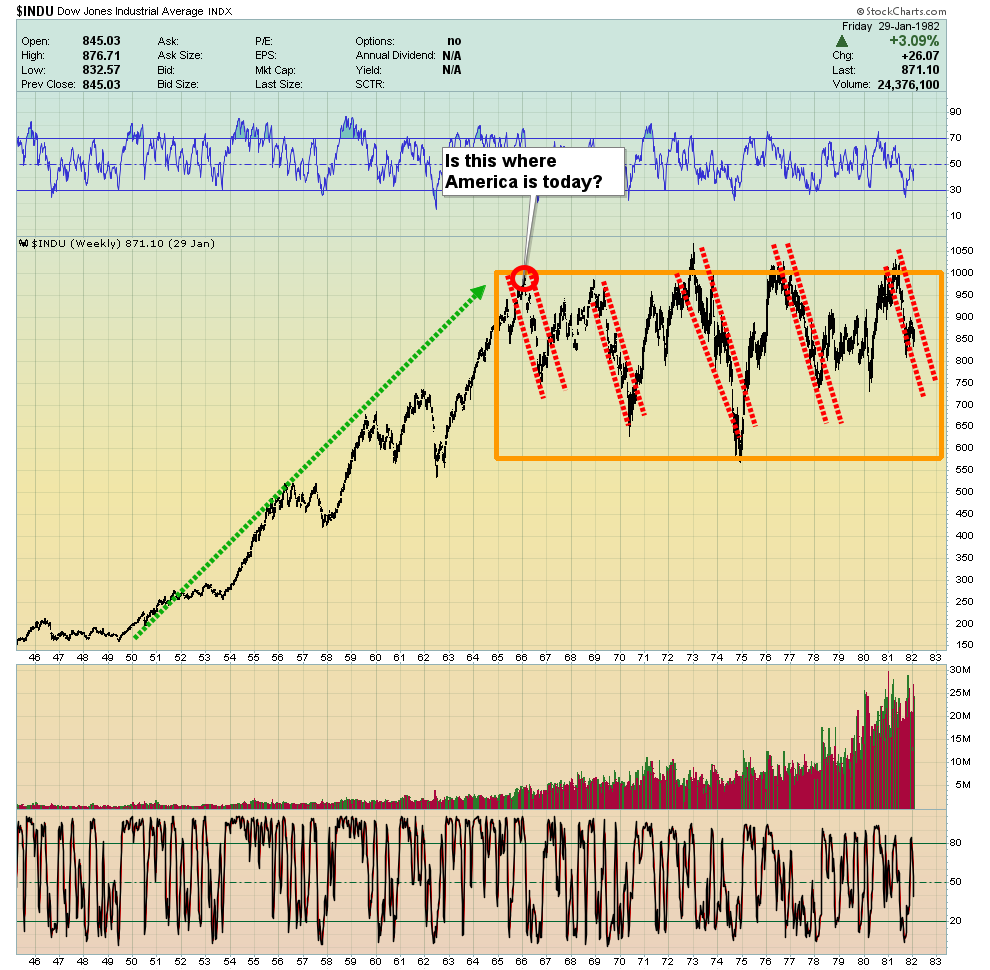 When comparing the current US stock market (and all of America) to the 1966 period, there’s one major problem, which is that in 1950-1966, the nation grew on low debt, a new births boom, and generally small government.
- Unfortunately, gold was not the nation’s currency during that boom. It was banned and the citizens were ordered to live a fiat-oriented life. In the short-term, that life was good.
- Longer-term, it meant not only that the boom would die, but the empire itself was at severe risk of morphing into the hideous debt-themed and meddling monstrosity that it has become now.
- The 2008-2021 theme for America is high debt, a peaking population, rampant money printing, and “over the top” meddling.
- I’ll dare to suggest today that the best comparison of the US stock market with the past… is a hybrid of 1966 and 1929.
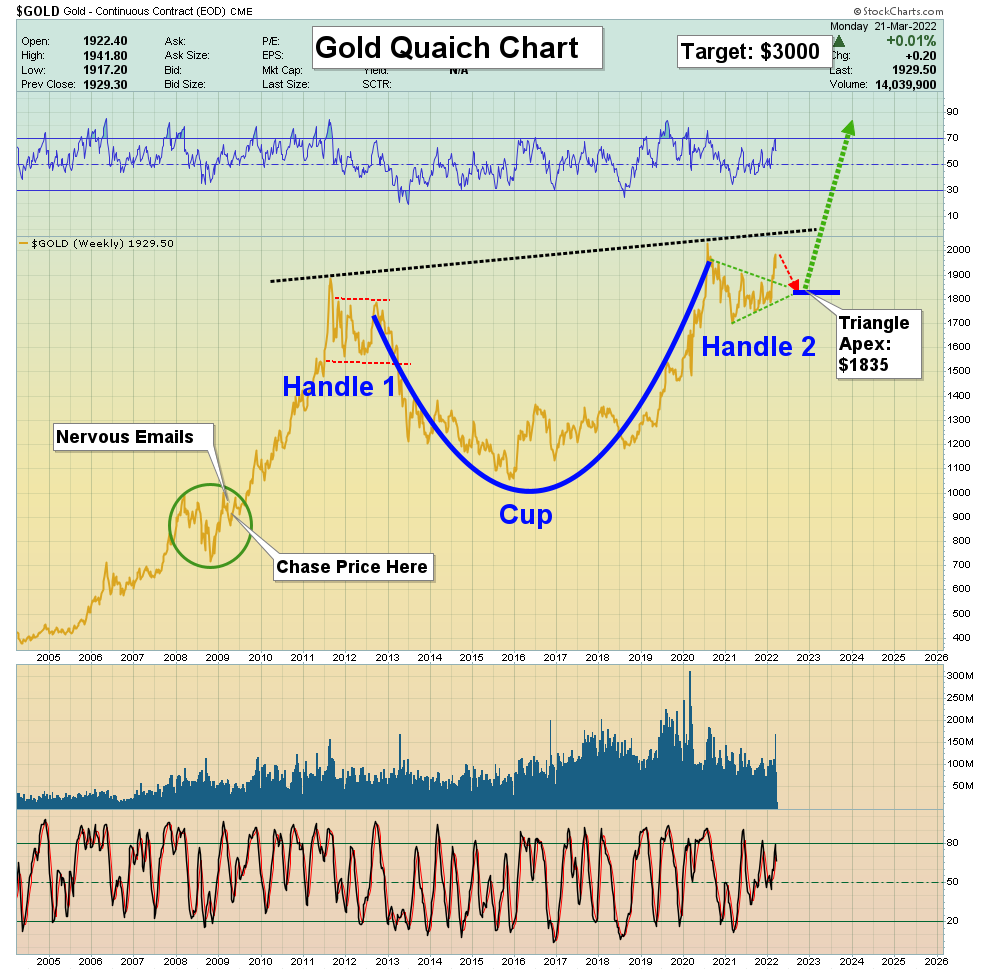 Click to enlarge this long-term gold chart. It can be argued that global money managers are trying to convince themselves that Jay Powell’s “better late than never” speech yesterday is negative for gold and positive for the stock market, because he’s seen as “taking control of the situation”.
 - That view works in the short-term, but not in the medium-term, let alone the long-term. A pullback to the $1835 triangle apex on the gold chart may or may not happen, but it would be technically normal, and it fits with Jay’s new hawkishness.
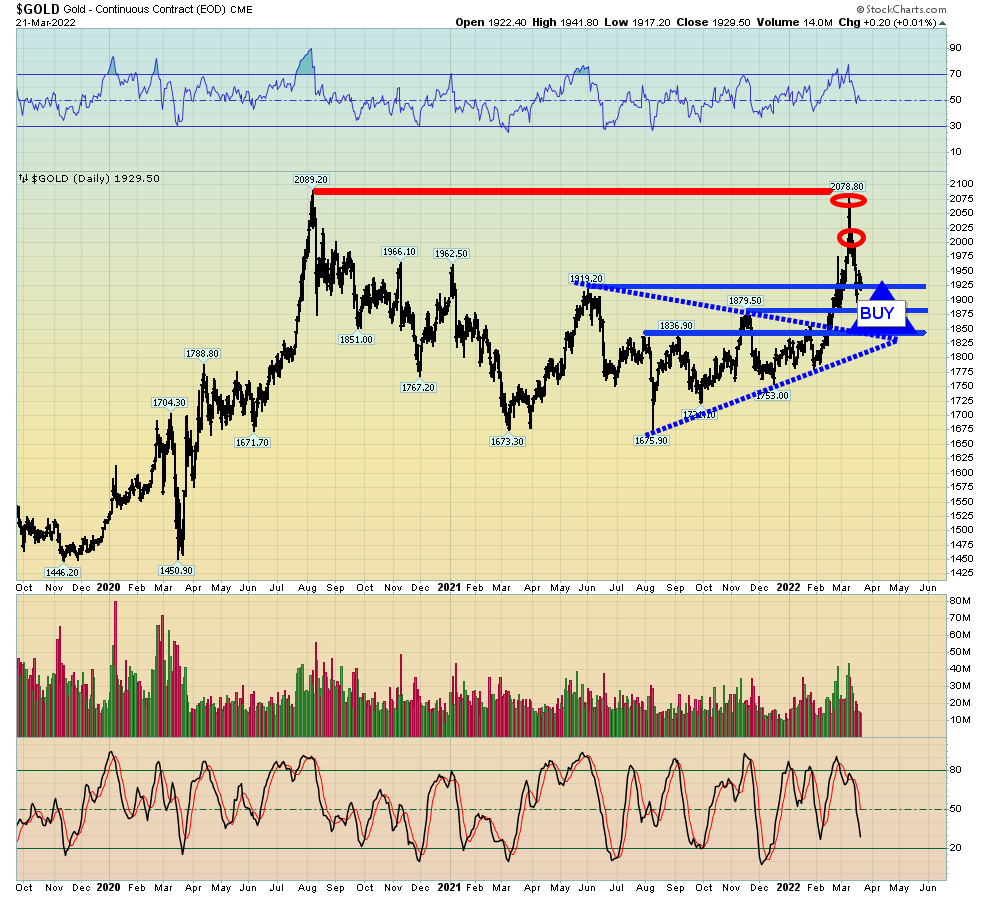 Click to enlarge. I’ve outlined a “triple buy play” for gold market investors (for gold bullion, silver, and the mining stocks), with light buys at $1920 (done), bigger buys at $1880 and much bigger buys at $1835.
- Investors who didn’t sell into $2000-$2080 should not buy, but instead wait for a price of $2300-$2500. Sell there, and buy back in the $2100-$2000 area on a dip from that higher price zone.
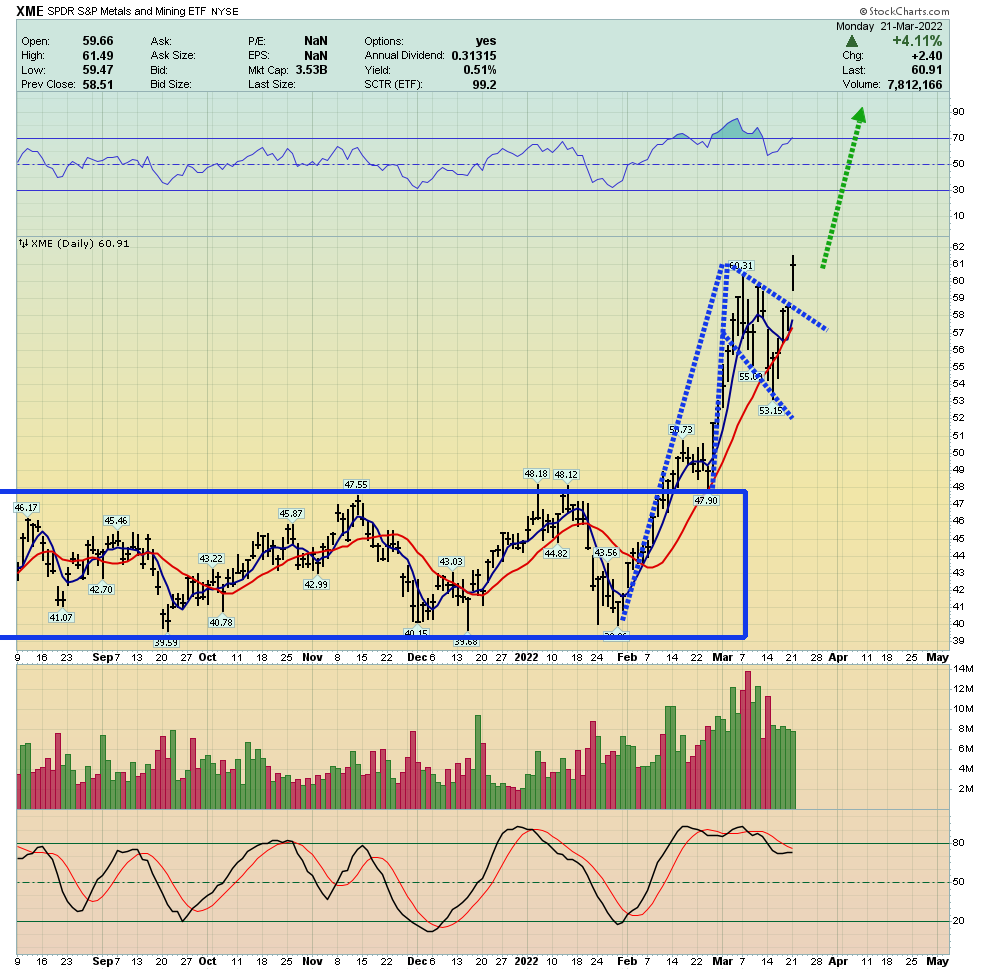
- Please click here now. Double-click to enlarge this spectacular XME chart. The Ukraine war has brought base metal supply issues to the forefront of market action. The XME ETF holdings include gold miners, but also base metal companies involved in nickel, copper, etc.
- A bull flag pattern is in play, with a gap-themed breakout yesterday. Basis Edwards/Magee, the flag flies at “half mast”. Depending on where the mast is drawn from, the price target is at least $70, and likely $80. A week ago, I issued a “chase price now” (with prudent buy size and tactics) call for the miners, and today I’m ready… to do it again!
Thanks!
Cheers
St
Stewart Thomson, Graceland Updates
About the author
