Hycroft Mining (which is the recapitalized Allied Nevada) owns and operates the Hycroft mine, which is one of the world’s largest precious metals deposits, having 18m AuEq oz. in reserves and an additional 13m AuEq oz. in M&I and Inferred resources. This was a previously producing mine but the operator [Allied Nevada] went under as the gold price collapsed in 2013-2015. Had Allied Nevada been able to complete the expansion Hycroft is now undertaking, things would have turned out much differently.
Small scale production commenced in August 2019, and 2020/2021 marks the start of a 5-year expansion. The capital investment required to complete the expansion is just $231m (over 5-years, which is very minimal considering the future size of the project), a portion of which will be sourced from on-going cash flow generation, which will be, in part determined by gold and silver prices). The rate of return is incredibly high, having an IRR well in excess of 100%.
Hycroft is a bit of an anomaly in that it will producer a significant amount of silver in the US. Typically, large silver producers are found in Mexico, Peru, Argentina, Bolivia and other LATAM countries. LOM annual silver production (when the expansion is complete) will be in excess of 10m oz., so it would be considered a senior producer if looked at as a primary silver producer. Using a 70:1 gold to silver ratio (GSR), silver will account for 30-40% of total revenue. However, using a 55:1 ratio, this increases to 35-45%, making silver a large component of total revenue. It is very rare to find an asset of scale which produces over 200k oz. Au and 10m oz. Ag on average for over three decades (+34-years) solely based on reserves and over five decades, based on total resources.
Once the expansion is complete or just a couple years into the expansion, both gold and especially silver production will greatly increase. Per the 2019 feasibility study, the initial mine life (based on reserves) is 34-years, with life of mine (LOM) payable production of 12.43m oz. Au and 344.1m oz. Ag [or average annual output of 230k oz. Au p.a. and 10.1m oz. Ag), which is inclusive of the three initial years with lower output. The substantial silver byproduct credits serve to significantly lower the all-in sustaining costs (AISC) of each ounce of gold produced. The LOM AISC is estimated at $626/oz. Au. This, however, is using a long-term price for silver of $17.33/oz. Using a realistic yet conservative long-term price of silver of $25/oz., greatly reduces AISC per ounce of gold.
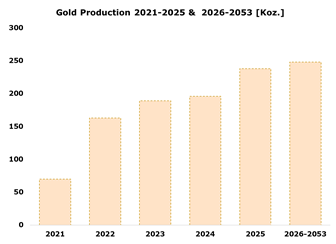
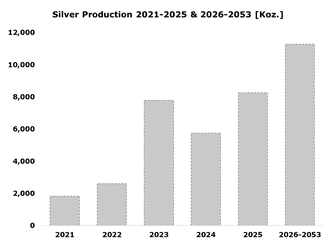
Beginning in 2021, per the mine plan, production should increase to 70k oz. Au and 1.85m oz. Ag. In 2022 and 2023 production is expected to increase to 163k oz. Au and 2.6m oz. Ag, 189k oz. and 7.8m oz. Ag, which incrementally increases thereafter. Whether the company will be able to execute on the expansion is another question altogether.
The financial position of the company could be stronger and it is very likely Hycroft raises additional capital through an equity issuance. It also has some very interesting warrants outstanding. There are 34.29m warrants outstanding with an exercise price of $11.50/warrant. While the share count would greatly increase on a percentage basis ( would increase 68.30% to 84.49m shares from 50.2m shares). Exercise of the warrants would also bring in over $380m, which would repay its outstanding debt ($140m) and nearly cover all the capital requirements over the next four years. It would be reasonable to think that the company will do a small to moderately sized financing. Because the warrants are about $1.50-$2/share out of the money. Hycroft will want to balance the amount of financing it needs over the next 12-14 months vs. the dilution an equity raise will cause.
In Q2 2020, Hycroft Mining restarted open pit mining operations on a limited basis to demonstrate the viability of the newly developed oxidation heap leach process at the Hycroft Mine. Each quarter since restarting, tonnage mined, crushed, and placed on the leach pads have increased, most notably in the second quarter of 2020 following the arrival and commissioning of mobile mining equipment rentals. In Q1 2020, the ore tons crushed averaged roughly 338k tpm (tons per month), which increased to roughly 460k tpm in Q2 (+36%).
The following charts illustrate Hycroft’s approximate gold and silver output each year from 2021-2025 and average annual output from 2026-2053.


Stephen Jones (Interim President & CEO): Steve joined Hycroft (then Allied Nevada) in 2012 and currently serves as the Interim President & Chief Executive Officer. There’s not a whole lot here to appraise his quality, though he is obviously familiar with the Hycroft mine. It will be keeping an eye on as whomever is the next CEO could very well make or break the company. Stephen Jones was previously the executive VP and CFO.
The company hasn’t yet appointed a COO, which is arguably the most important executive position for the company at this point in time, although it did appoint Larry Giegerich as the VP and General Manager of the Hycroft Mine. He’s a third generation mining professional and managed projects globally at various levels. More than 30-years of experience in the industry has given him the skills and knowledge base to lead Hycroft through its expansion phase and beyond.
Hycroft (Producing, Nevada): The deposit has 18m AuEq oz. (reserves) and an additional 13m AuEq oz. of resources. The restart began August 2019, with ramp-up on-going. The company has averaged 500k tons placed on the leach pad (monthly) in 2020, which is expected to increase in excess of 1m tons placed on leach pad (monthly) in 2021. The permitted expansion is of very low capital intensity, with initial 5-year capital investment forecast of $231m as the company already has $400m of existing infrastructure. The project is highly leveraged to the metal prices. Using a $1,300/oz. gold price and $17.33/oz. silver price, yields an after-tax NPV5 of $2.1b. For every $100/oz. increase in the gold price, adds roughly $300m of net asset value and for every $1/oz. change in the silver price, adds $125m to the NPV5. Using a long-term price deck of $1,800/oz. Au and $23.33/oz. Ag, yields an NPV5 of nearly $4.5B. In other words, the company is trading at a hefty discount to Net Asset Value [trading at about 0.20x NAV), while its peer group is trading closer to 1.25x NAV.
Highlights of the Feasibility Study:
- Gold Reserves: 12m oz.; LOM payable gold production: 7.85m oz.
- Silver Reserves: 481m oz.; LOM payable silver production: 344m oz.
- Average annual production over a 34-year initial mine life (assuming there is no success in resource conversion) of 230k oz. Au and 10.1m oz. Ag.
- New of byproduct credits (assuming the gold-to-silver ratio doesn’t break below 73:1), AISC over years 1-5 is estimated at $775/oz., with AISC of $635/oz. over the first 10-years and $626/oz. over the LOM. Production over the first 5-years will incrementally increase but really pick up beginning in year-6.
The leach pad expansion project: In Q2, 2020, the company began a leach pad expansion project on the north side of the Hycroft Mine property, which is being done to provide the company with the leach pad space required for future operations. This is a two-phased project, the initial stage consisting of approx. 4msqft of pad space and infrastructure for ponds, pipes and electricity, with phase II consisting of approx. 4.6msqft, which will be constructed in 2021. Phase I is expected to be completed in Q4 2020.
- On May 29th, 2020, the company completed a recapitalization transaction, which resulted in a net cash injection of $68.9 million. The ending cash balance at June 30, 2020 was $47.3 million, resulting from cash flows of $57.6 million used in operating activities, $11.7 million used in investing activities and $107.3 million from financing activities during the first six months of 2020. Non-current debt on the balance sheet at June 30, 2020, totaled $139.0 million, comprised of subordinated notes and through a credit agreement entered into with Sprott Private Resource Lending II. Hycroft also entered into a 1.5% net smelter royalty agreement pursuant to which it received $30.0 million of cash proceeds with monthly obligations tied to production.
- The company will need to secure additional financing in order to allow for the ramp up of operations (though warrant money and cash flow generation as well as a moderately sized equity financing should be more than sufficient). To date, the company has received a non-binding letter of support from its two largest investors, the BOD intends to evaluate its options to ensure the necessary capital is raised on favorable terms.
The company is looking at various metallurgical testing, which represents 81% of total reserve tons, 81% of reserve gold ounces, and 85% of reserve silver ounces. The testing has shown a significant improvement with 82% and 91% recovery rates vs that in the feasibility study of 65%. Using an 80% recovery rate, an additional 1.3m oz. Au would be produced and sold. Further, the company is also doing Central testing, which represents 19% of reserve tons, 18% of reserve gold ounces, and 14% of reserve silver ounces. Recovery rates have been 95% and 91% vs. the 70% in the feasibility study. Again, using a mid-point of 80% recoveries, this would add an additional 400k oz. Au, for a total of 1.7m oz. of additional gold production over the 34-year mine life (which amounts to an increase in average annual payable gold production of 45-50k oz. p.a.). In other words, this could unlock significant value for shareholders, especially if Hycroft can realized recovery rates in excess of 80%. This testing also increases the rate of oxidation by 21%.
Given there are a number of unknowns at this point in time; I) who the management key positions will be i.e. CEO and COO; II) Question of financing, where will it come from; how much is needed; and the timing of the warrants (Hycroft should consider reducing the strike such that the warrants are in the money); and III) execution of its expansion, in that it needs to be completed on-budget such that by 2023, gold and silver production see a significant increase. For these reasons, we won’t apply a typical 5% discount, instead using a 10.00% discount rate.
Valuation Assumptions: The following calculation of Net Asset Value is on the conservative side as assumes a 12% discount rate (vs. the typical 5.0% discount rate for a permitted operation in Nevada), and the use of a fully diluted share count WITHOUT a cash inflow upon the exercise of the outstanding warrants (+$380m). An assumed discounted non mine-site G&A expense of $205m. This is a riskier investment option at this point, but should the company execute on its objectives over the next 18 months, it will go a long way towards de-risking this project. Given the valuation, the added risk could generate significantly higher returns. It is worth noting that at a 6% discount rate, NAV/share is closer to $45. Until the project is de-risked more, this Is still rather speculative.
|
Hycroft NAV: $1,800/oz. Au & $24/oz. Ag @ 10% |
||
|
Asset |
NAV |
1.20x NAV |
|
Hycroft |
2,509,922 |
3,137,403 |
|
Other Expenses |
(205,712) |
(205,712) |
|
Cash |
$45,000 |
$45,000 |
|
Debt |
($139,000) |
($139,000) |
|
Total |
2,210,210 |
2,837,690 |
|
F/D Shares Out |
84,490 |
84,490 |
|
VPS |
$26.16 |
$33.59 |
|
NAV Sensitivity Analysis: Changes in Gold & Silver Prices |
||||
|
$26.16 |
$1,550 |
$1,750 |
$2,000 |
$2,250 |
|
$18 |
$14.81 |
$19.44 |
$25.23 |
$31.02 |
|
$21 |
$17.59 |
$22.22 |
$28.01 |
$33.80 |
|
$24 |
$20.37 |
$25.00 |
$30.79 |
$36.58 |
|
$27 |
$23.15 |
$27.78 |
$33.57 |
$39.36 |
|
$30 |
$25.93 |
$30.56 |
$36.35 |
$42.14 |
|
$33 |
$28.71 |
$33.34 |
$39.13 |
$44.92 |
|
$36 |
$31.49 |
$36.12 |
$41.91 |
$47.70 |
|
$39 |
$34.27 |
$38.90 |
$44.69 |
$50.47 |

Disclosure: Employees at Goldseek hold an interest in Hycroft Mining.


