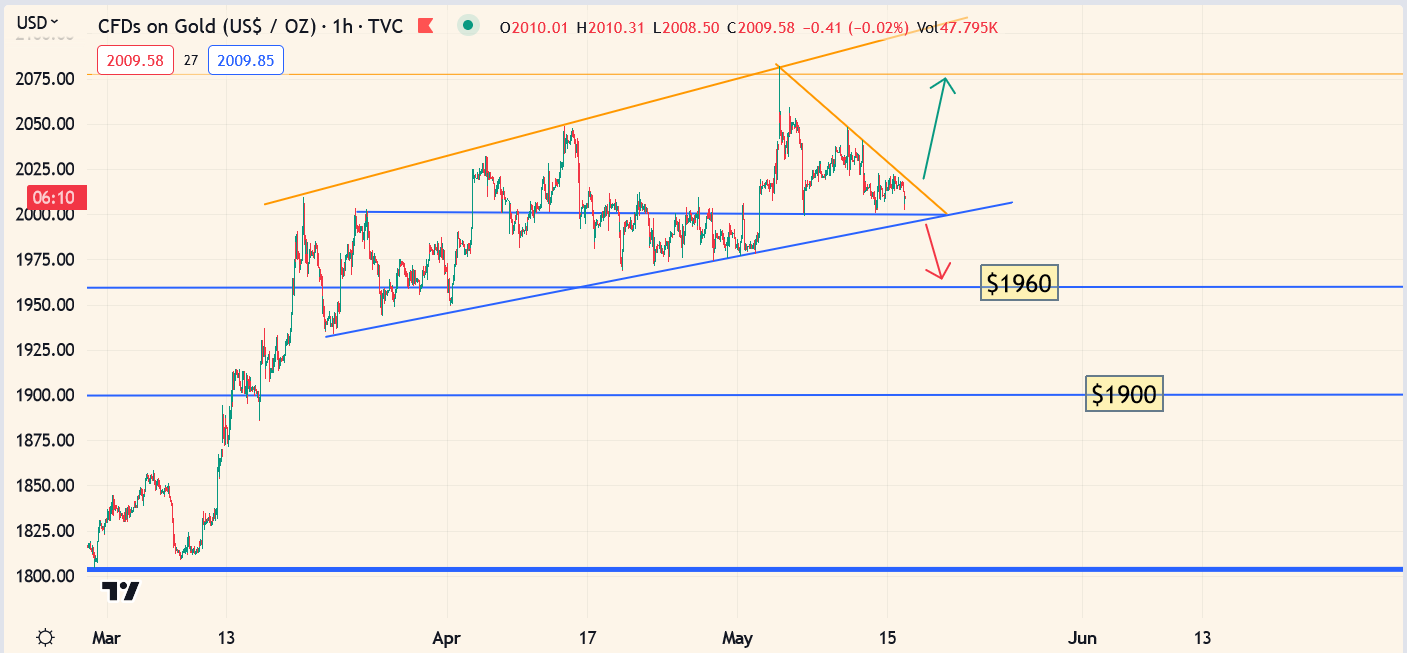
- The American government is a debt-oriented mess and sadly, most proposals to fix it involve even more debt.
 Ironically, gold could dip towards my $1960 and $1900 buy zones if there is a congressional agreement to raise the debt floor.
- On the other hand, a default should push gold to a fresh high above $2080.
- Please click here now. Double-click to enlarge this weekly chart for gold. While debt, war, de-dollarization, the Fed, and new Chinese gold-linked bank accounts get the headlines, investors should also stay focused on key oscillators, support and resistance zones, and the smart money actions of Western banks and Asian jewellery buyers.
- Until RSI and Stochastics drift down to at least the 50 area on this weekly chart, serious commercial buying on the COMEX and a major ramp-up in Indian gold imports is unlikely.
- That means the gold price is likely to continue to be relatively firm, but a major rally would remain elusive.
- Please click here now. More heavyweight analysts feel a US recession is coming.
- What does that mean for stock markets? Please click here now. Paul’s take is roughly the same as mine; 2023 is likely to be a year where the US stock market grinds higher but that doesn’t make it a roaring buy.
- Please click here now. Double-click to enlarge. The Dow could make it to the highs near 37,000… if there’s no US government debt default.
- Even if there is no default, that 37,000 area is serious resistance and America is likely beginning a period of stagflation that will be worse than that of 1966-1980.
- That means gold and short-term bonds and T-bills are the most logical investment for most investors.
- Please click here now. The dollar has broken out of a small triangle pattern that it formed at the key 100 level on this DXY dollar index chart.
- For myself, I like a net worth mix of 40% gold bullion (bars, coins, jewellery, and ETFs) 40% fiat (cash and T-bills), and 20% in risk items (mainly miners that are bought at key support zones for gold).
- My mix is mine and it may or may not be a fit for other people; each investor needs to decide their own mix… a mix that’s in sync with their investing personality.
- For a look at oil, please click here now. A large congestion pattern continues to form on the daily oil chart, and it looks bullish.
- An upside breakout over $83 would likely usher in a new phase of Fed rate hikes… and create fresh debt financing issues for the US government.
- Please click here now. Interestingly, the Goldman Q4 forecast for $100 oil fits with my technical base pattern and projected breakout.
- The bottom line is that 2023 is a lull year for inflation, but a lull is not the same as an end. The second half of this year is likely to be themed on “stag” for growth and a lull in rate hikes.
- Clearly, a daily focus on the big picture is critical for investors as inflation, the 2021-2025 war cycle, a wildly overvalued stock market, and empire transition dominate the investing landscape. I cover that big picture 5-6 times a week in my flagship Galactic Updates newsletter. At $199/year, investors feel the price is too low, but I’m offering a $179/15mths “super special” that investors can use to get in on the action, or to extend their existing subscription. Click this link to get the offer or send me an email and I’ll get you a payment link. Thanks!
- What about 2024? That’s likely to be a year of painful surprise. If oil pushes above $100 by year-end, the Fed is likely to turn hawkish again and the ooze higher in the Dow could become a horrifying meltdown.
- 2024 could also be a big year for gold. A fresh bout of inflation and more rate hikes could cause many more banks to fail… depositors may then rush to buy physical metal while money managers focus more on the mines!
- For a look at the daily GDX chart, please click here now. Double-click to enlarge. While I’m a mining stocks buyer if gold trades at $1960, that doesn’t mean gold is going down there now. GDX can still have another leg to $39-$40 or higher before a more significant reaction begins.
- What about silver stocks? Please click here now. Double-click to enlarge this SIL ETF chart. While there’s been a meaningful reaction for the silver miners already, the good news is there may be a bull wedge forming now.
- The $28 area is good support and a breakout from the wedge pattern would suggest that the reaction is over. Silver bugs should be ready to cheer, “Hi ho, hi ho, and up to a fresh high, most silver miners shall go!”
Thanks!
Cheers
St

