
US Rates
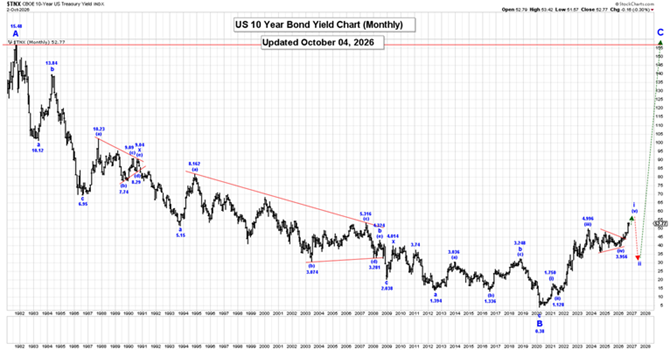
The Captain’s long-term US Rates Chart.
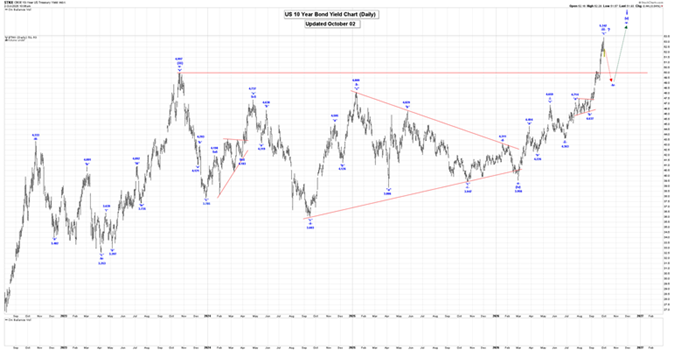
The daily chart.
Analysis:
The 10-Year US Bond Yield was higher again this past week reaching a high of 5.342%, closing at 5.277%!
Within a multi-year wave C, we are still rallying in wave i.
Within wave i, we completed wave (i) at 1.266%, wave (ii) at 0.504%, wave (iii) at 4.997% and we have updated our count to suggest that our large wave (iv) bullish triangle ended at the 3.956% low.
We are now moving higher in wave (v), which appears to have become an ending diagonal triangle formation, that looks like:
-i- = 4.659%.
-ii- = 4.363%.
-iii- = 5.342%, if complete.
-iv- drop after wave -iii- ends.
-v- rally after wave -iv- ends to complete all of wave (v).
On our Long-Term Monthly Chart all of wave A ended at the 15.83 high in 1981 and since that high was made, we have fallen in a triple 3 wave correction within wave B that ended at the 0.38% level.
In the very long term, we are moving higher in a multi-year wave C that will eventually see rates reach at least the 15.83 high again.
Active Positions: Long, risking to 3.880%!
SP500
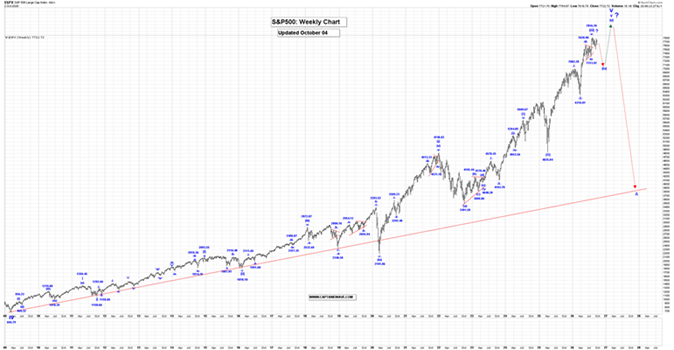
The Captain’s weekly SP500 chart.
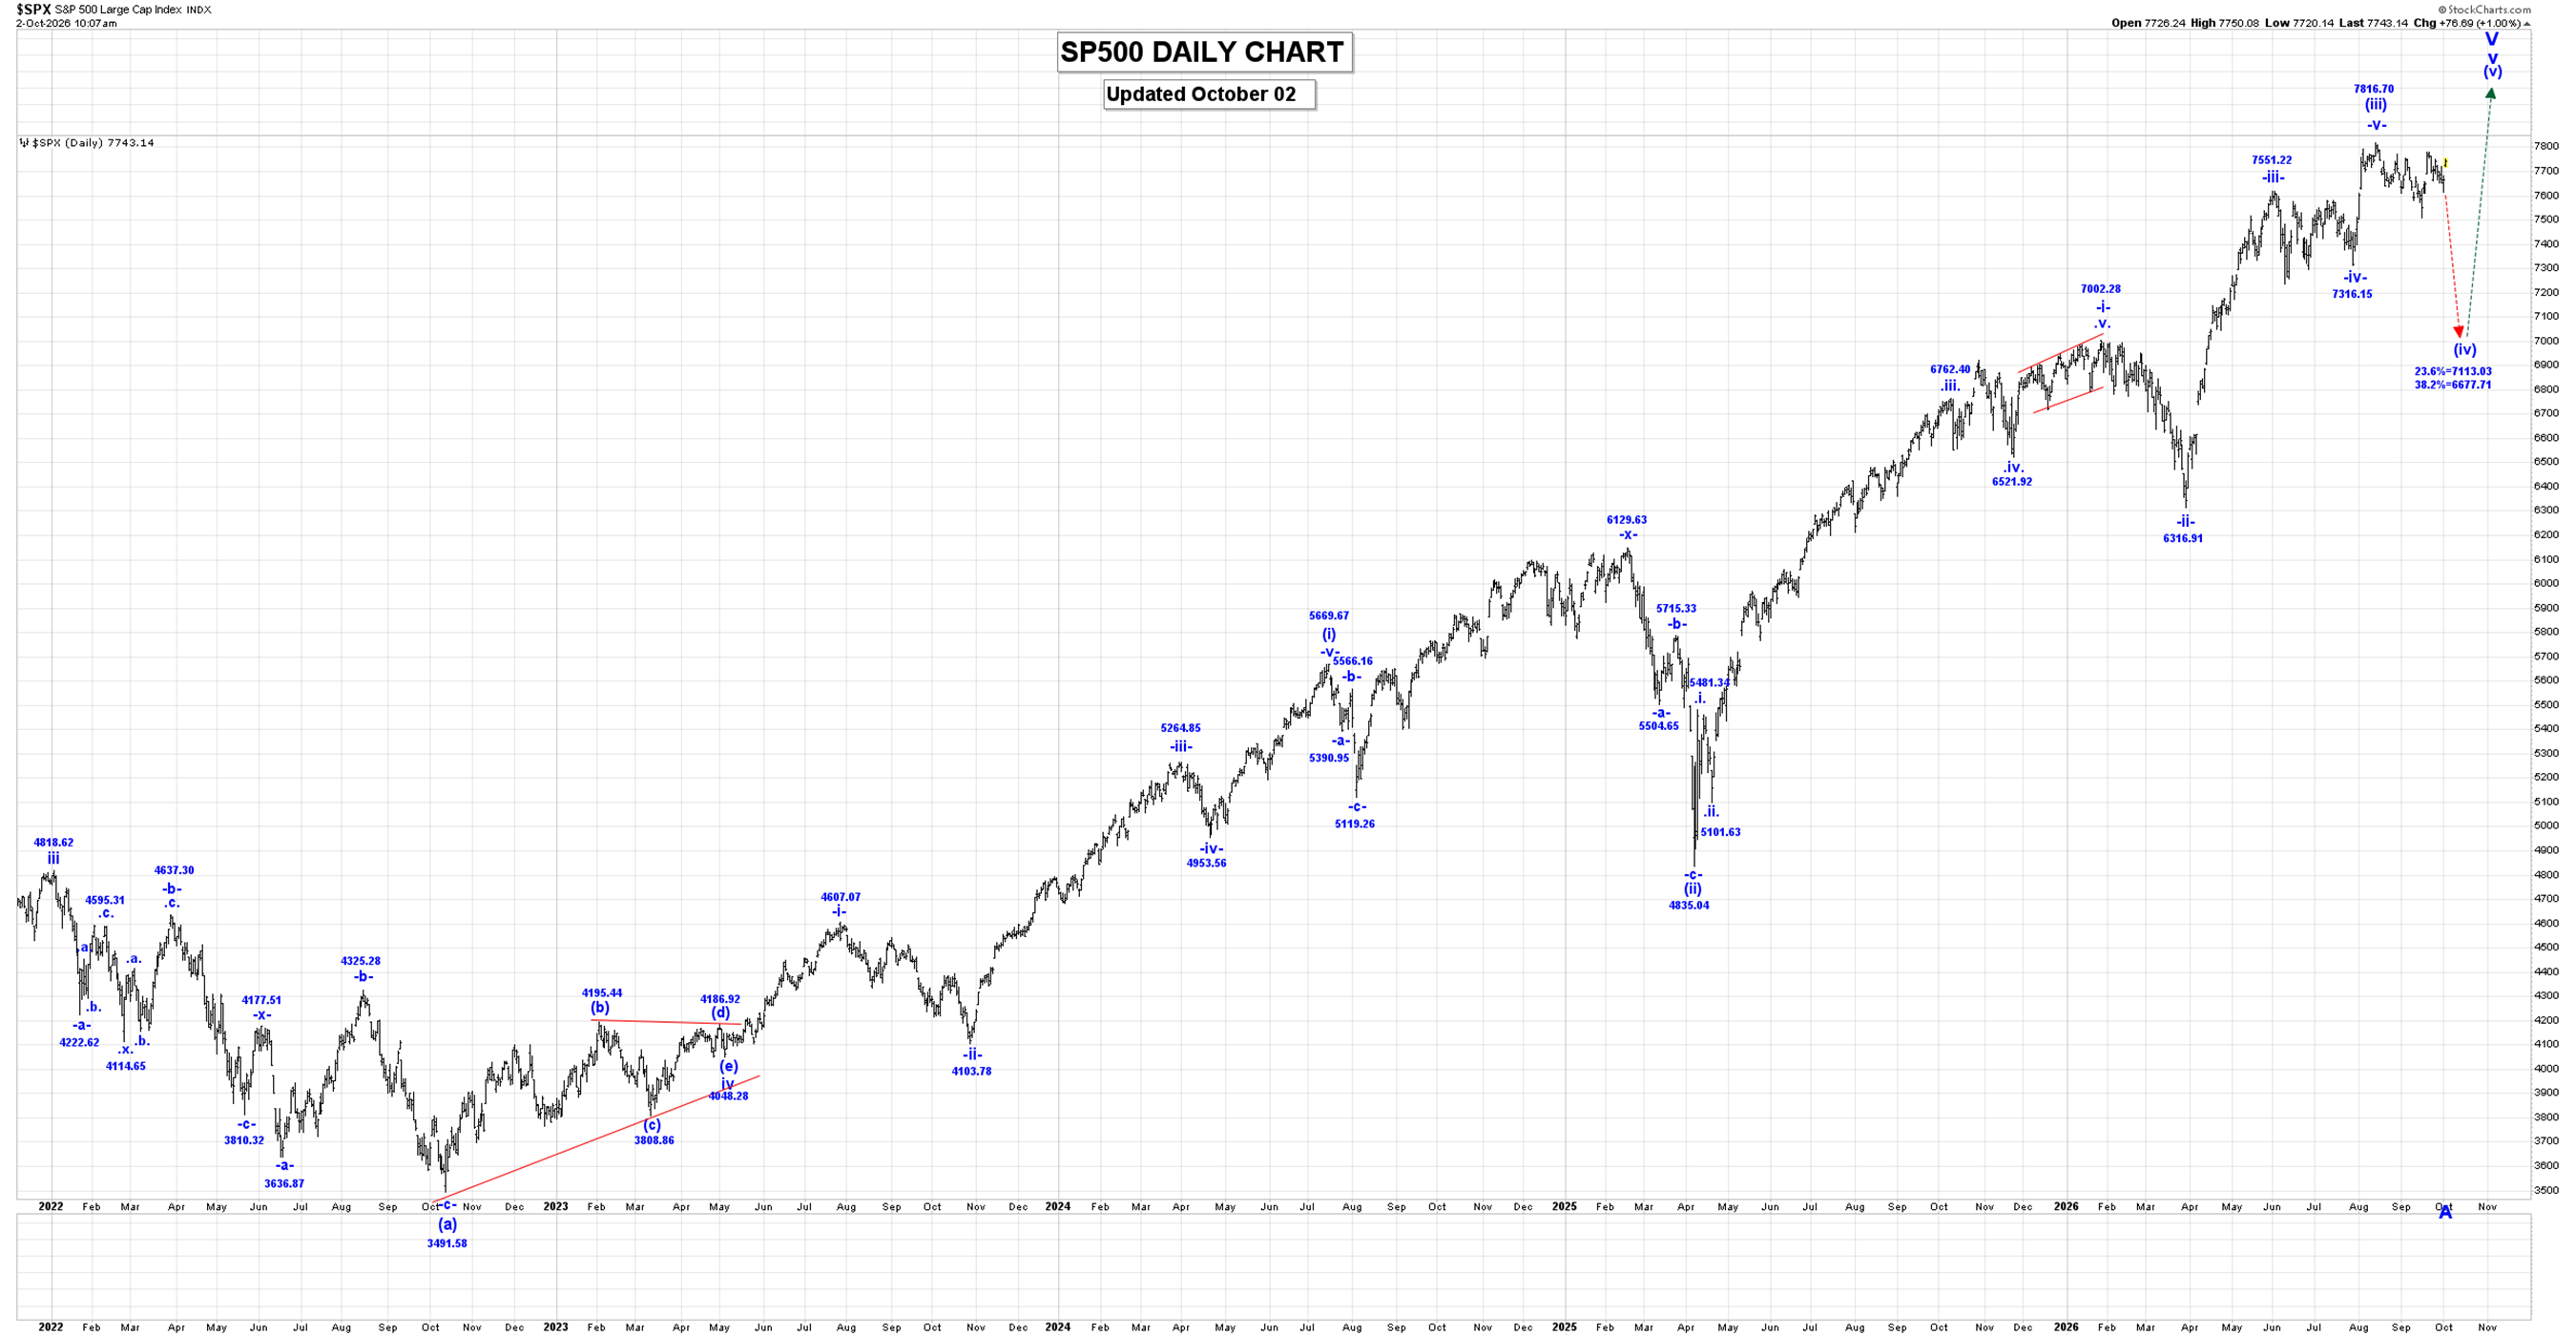
The Captain’s daily SP500 chart.
Analysis:
We have updated our internal wave count for wave v as follows:
(i) = 5669.67.
(ii) = 4835.04.
(iii):
-i- = 7002.28.
-ii- = 6316.01.
-iii- = 7620.90.
-iv- triangle = 7313.92,
-v- = 7816.70.
(iv) drop after wave (iii) ends.
We are now working on the assumption that all of wave (iii) is complete at the 7816.70 high, and if that is the case then we are now falling in wave (iv), which has retracement levels as shown in our Daily Posts.
Wave (iv) should retrace between 23.6 to 38.2% of the entire wave (iii) rally.
After wave (iv) ends we expect another run to all-time new highs in wave (v) to complete all of wave v and V.
Active Positions: Long SPXS (SP500 bear ETF) risking to 23.90!
Gold
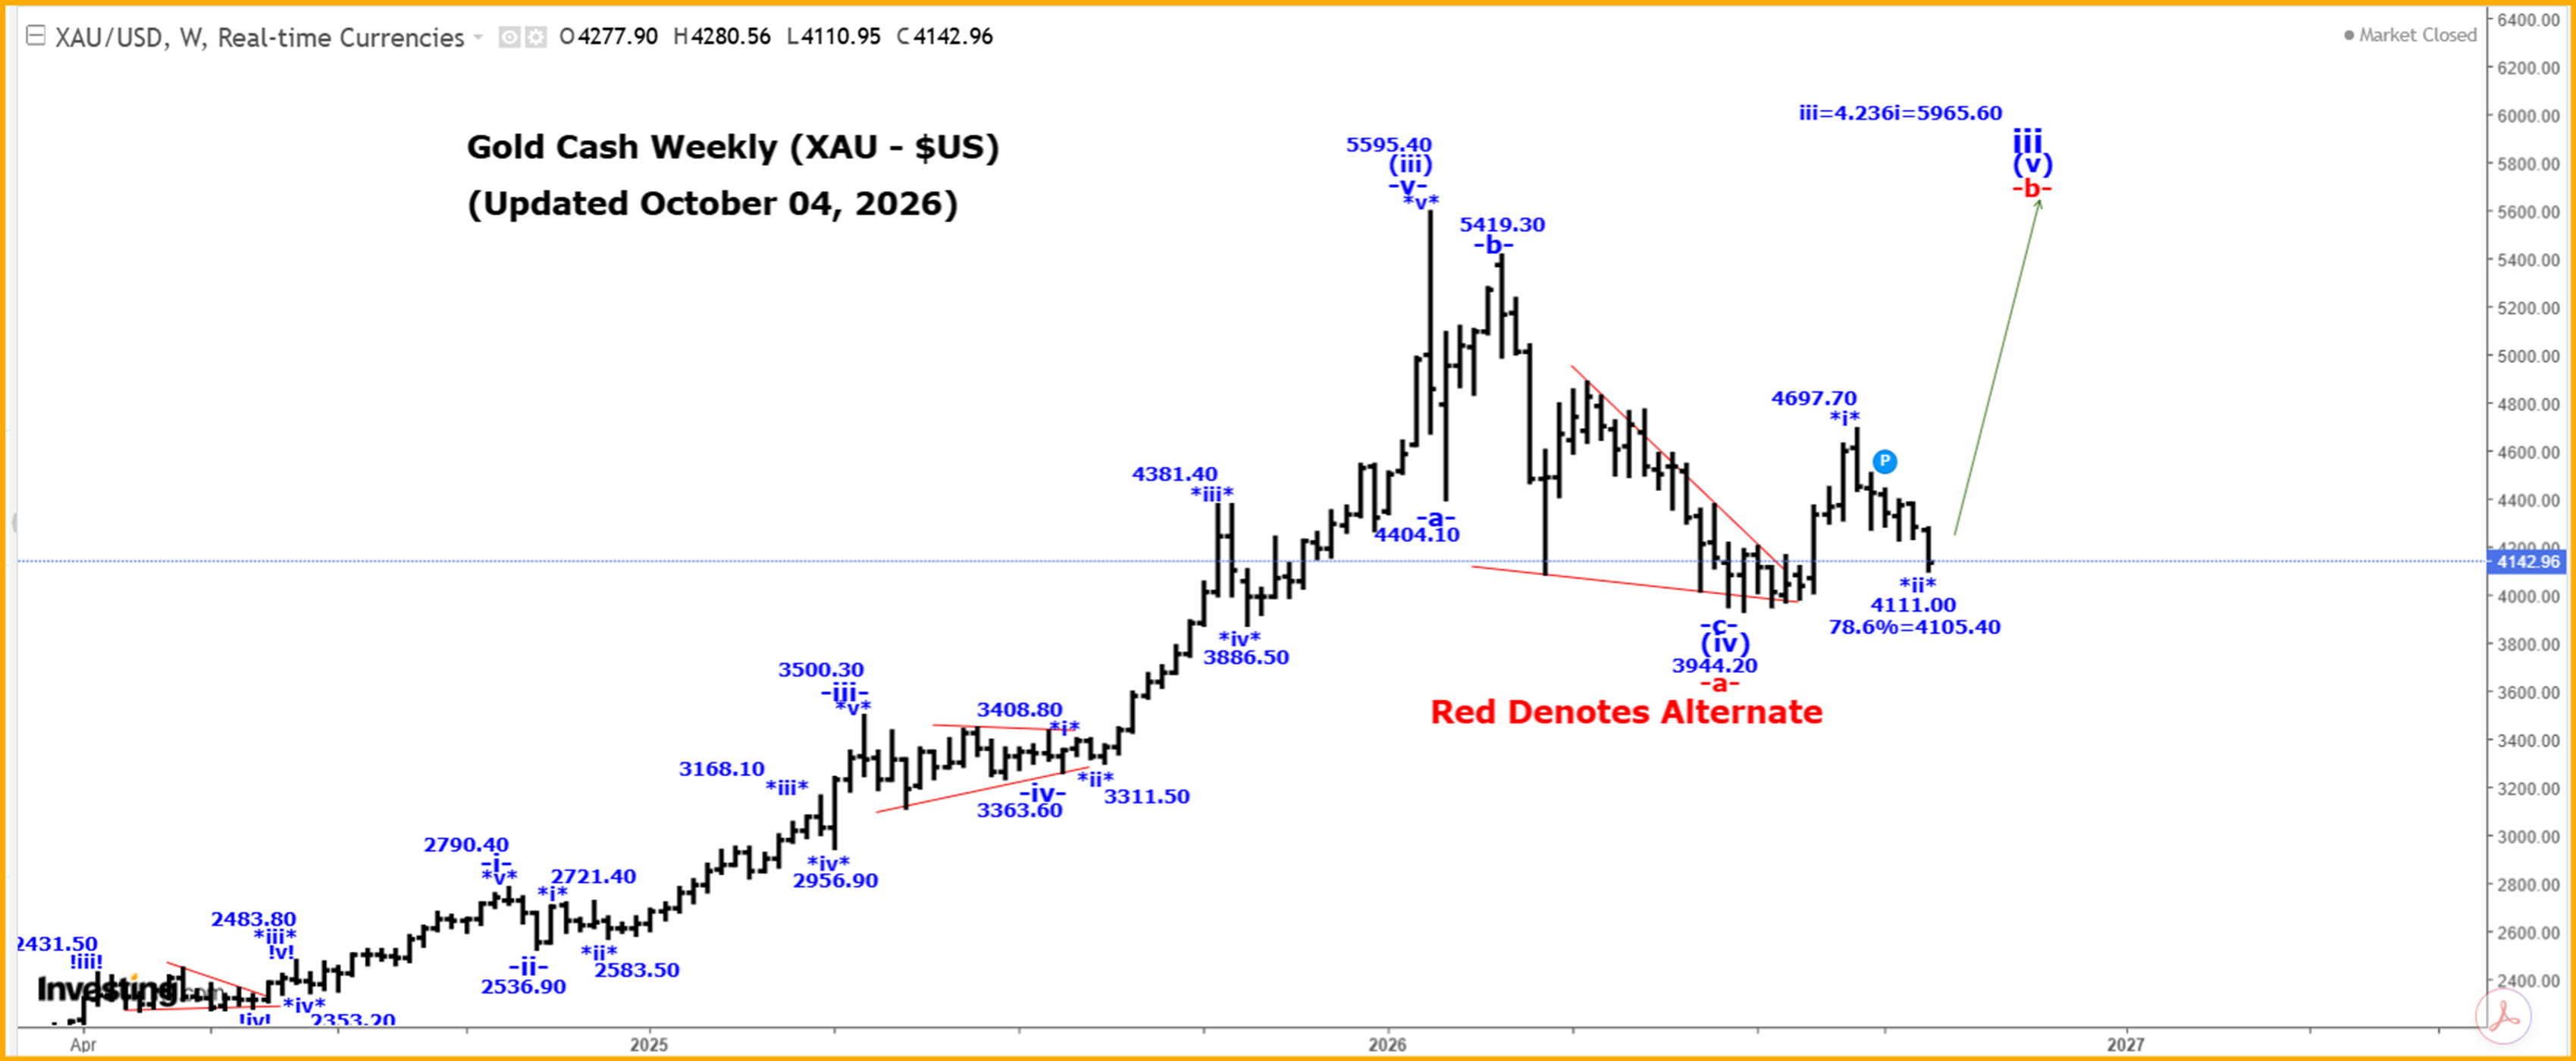
The Captain’s weekly gold chart.
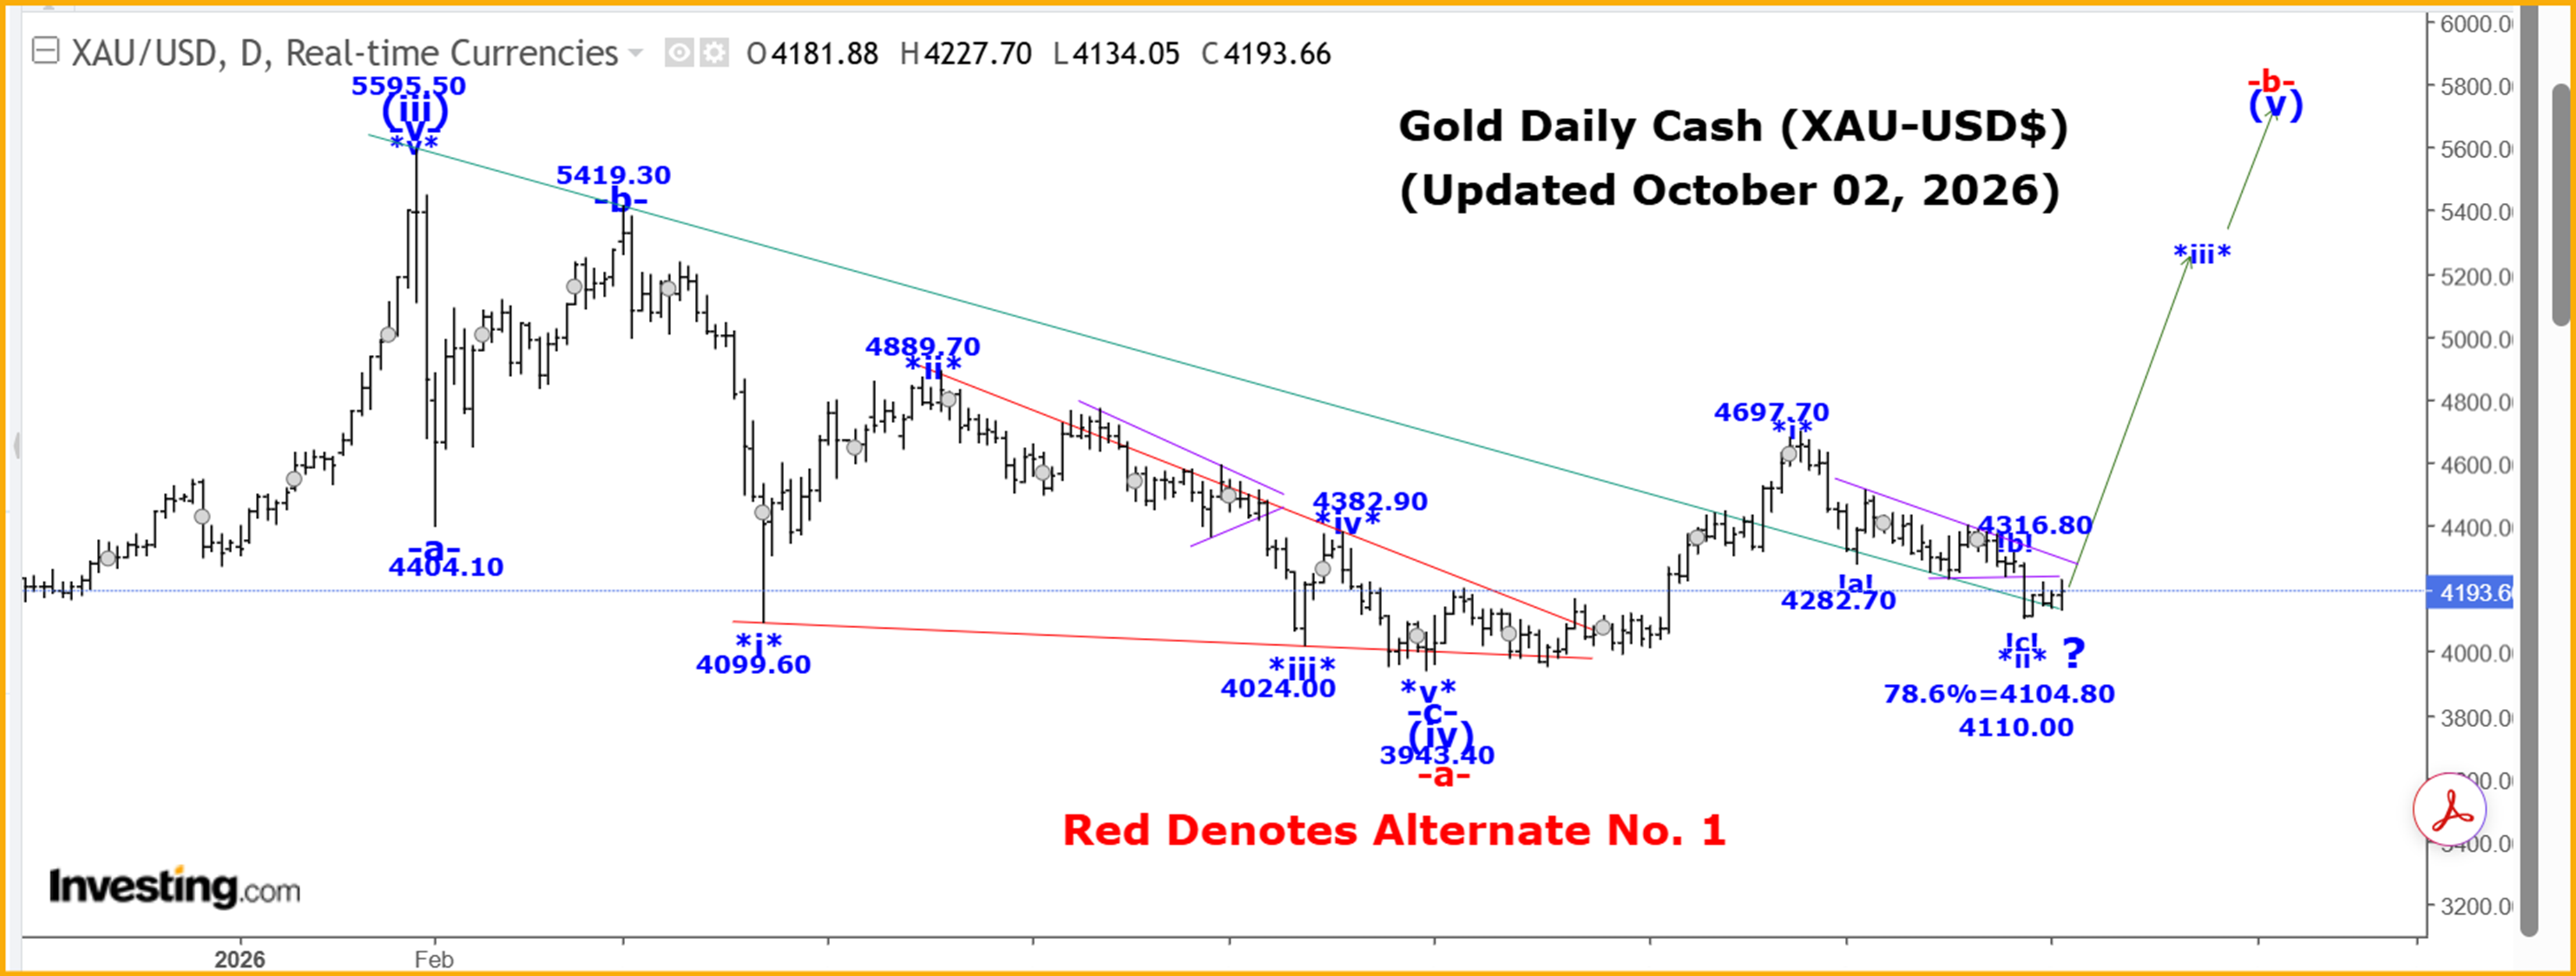
The daily chart.
Analysis:
Gold was lower this past week, reaching a low of 4111.00, closing at 4143.00.
Our current long-term gold count starting from the 35.20 low made back in 1971, which remains incomplete, is as follows:
1 = 1920.80.
2 = 1046.20.
3:
i = 2073.40.
ii = 1614.40.
iii:
(i) = 2073.30.
(ii) = 1810.10.
(iii):
-i- = 2790.40.
-ii- = 2539.90.
-iii- = 3500.30.
-iv- triangle = 3363.60.
-v- = 5595.40, to complete all of wave (iii).
(iv):
-a- = 4404.10.
-b- = 5419.30.
-c- = 3944.20, complete all of wave (iv).
(v):
-i-:
*i* = 4697.70.
*ii* = 4111.00, if complete
*iii* rally after wave *ii* ends.
We are working on the assumption that all of wave (iv) is complete at the 3944.20 low and if that is the case then we are now starting to move higher in wave (v).
Within wave (v), we completed wave *i* of -i-, at the 4697.70 high and we are moving lower in wave *ii* of -i-, which has a last retracement level of:
78.6% = 4105.40
For our current short-term analysis to remain valid, we do not want to trade much below of 78.6% retracement level, so we need to be on guard for the completion of wave *ii*, and the start of another rally in wave *iii*.
Last week we did say this: ”The intraday chart patterns are suggesting that wave *ii* is likely NOT complete at the 4235.10 low.”
Our alternate count is that wave (iv) could still become more complex, and in this case, only wave -a- of (iv) ended at the 3944.20 low and we are now moving higher in wave -b- of (iv).
Wave (iv) could still become a flat or irregular type correction and after wave -b- ends we expect a wave -c- drop back to at least the wave -a- low of 3944.20 before all of wave (iv) ends. If wave (iv) becomes a large bullish triangle then it will consist of 5 legs, and we will NOT return to the wave -a- low, before all of wave (iv) ends.
Wave -b- must consist of at least one three wave pattern, but it could have up to 3 such patterns, separated by a wave *x*. In the alternate count case, we completed or almost completed wave *a*, and the upcoming correction will be wave *b*.
We will give this market a bit more time before we provide our projections for the of wave (v), as we want to see if wave (iv) becomes more complex.
Projections for the end of wave 3 are:
3 = 2.618(1) = 5936.00.
3 = 4.236(1) = 9033.60.
Active Positions: Long, with Puts as stops!
Thank-you!
Captain Ewave & Crew
About the author
