
 The Captain’s weekly gold chart.
Analysis:
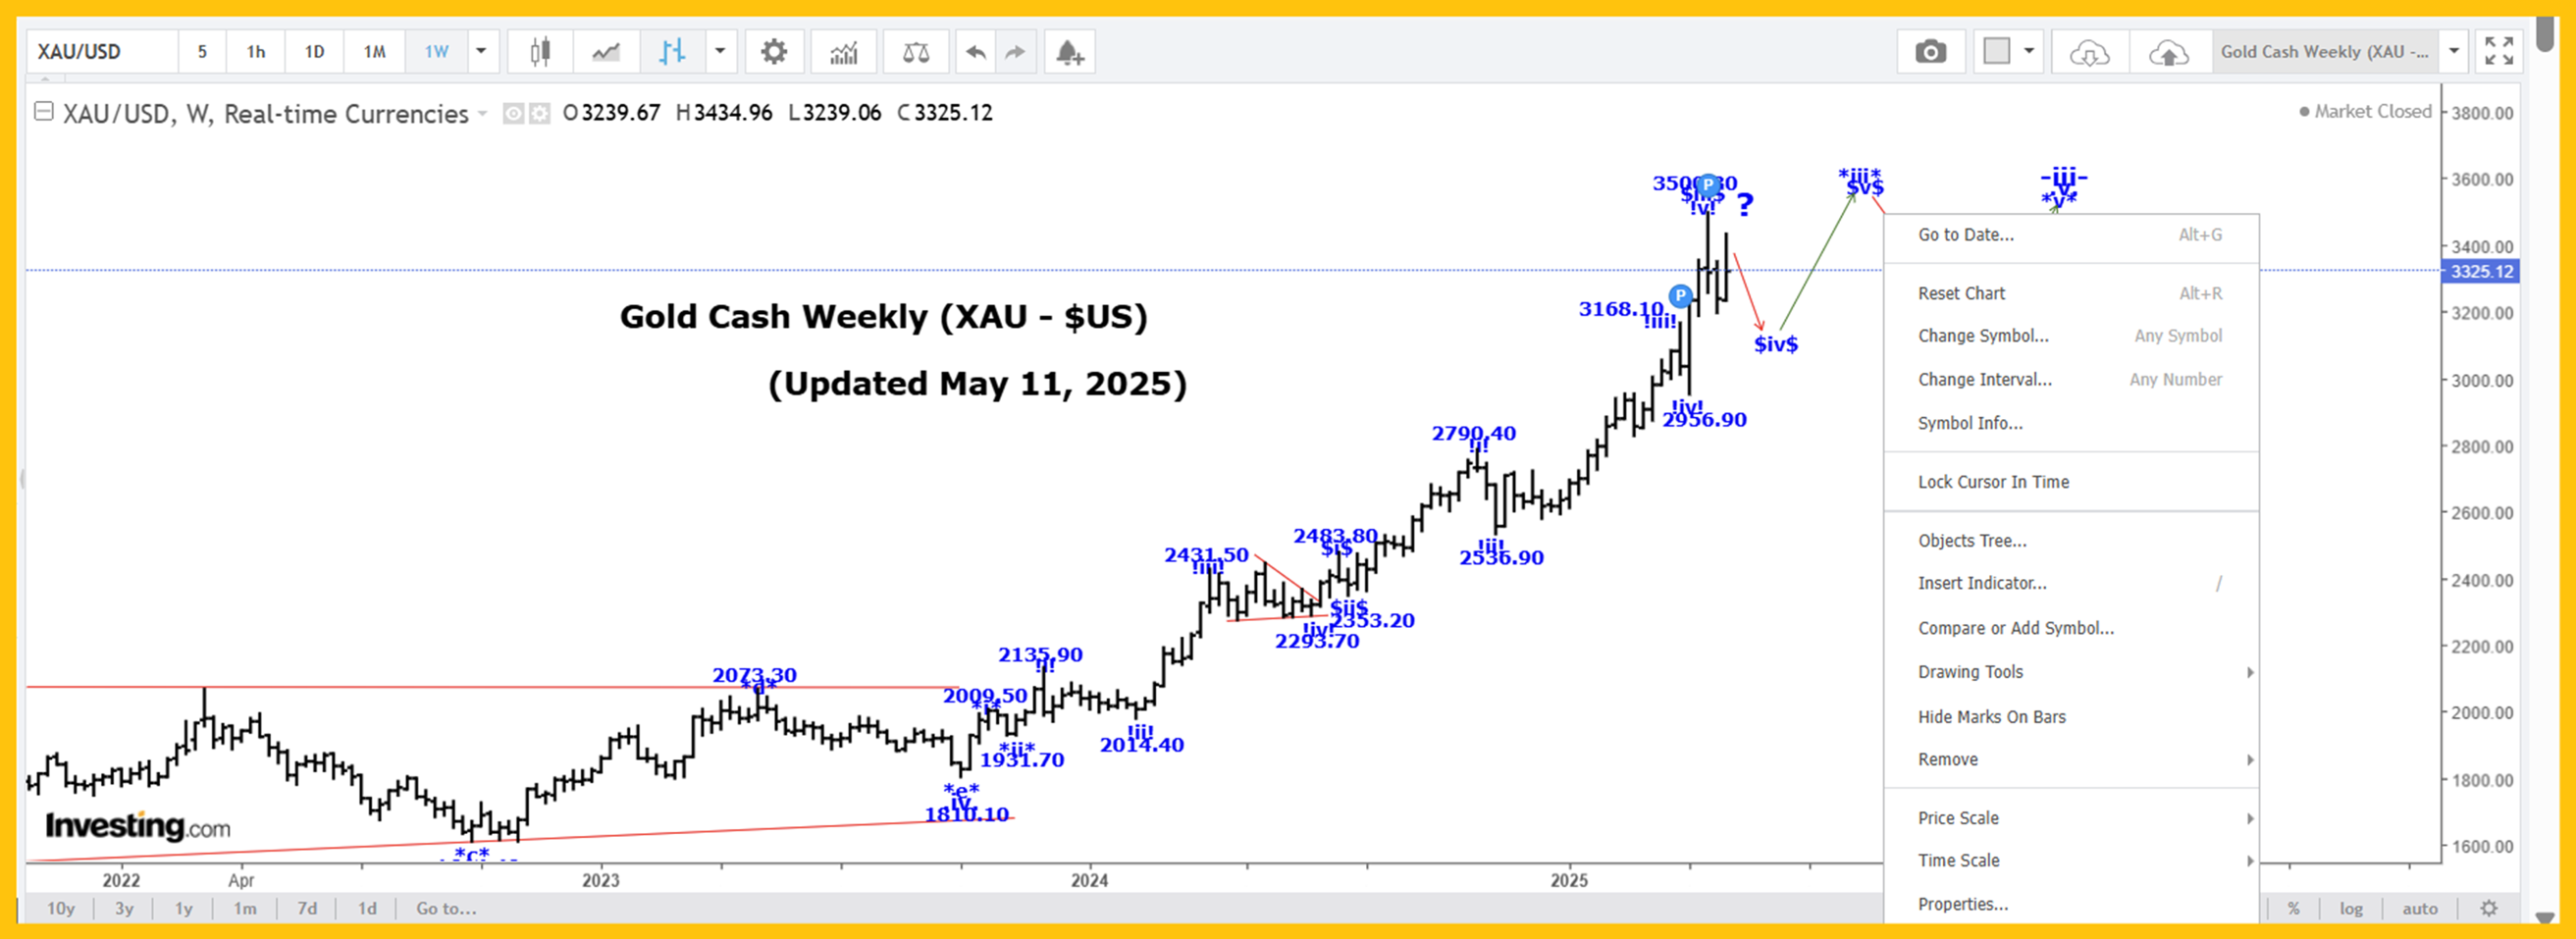
Within wave *iii* of ^iii^, we completed wave -i- at 2151.20 and wave -ii- at 1973.10. We are still rallying in a subdividing wave -iii- with wave $i$ ending at 2088.50, wave $ii$ at 1984.30, wave $iii$ at the 2431.50 high, and our wave $iv$ bullish triangle at the 2277.60 low.
For the time being, we are assuming that all of wave $v$ of *iii* ended at the 3167.70 high and that all of wave *iv* ended at the 2956.90 low. If that is the case, then we are moving higher in wave *v* of -iii-, which we are assuming is complete at the 3500.30 high.
If that is the case, then we are moving lower in wave -iv-, which has the following retracement levels:
23.6% = 3130.10.
38.2% = 2916.90.
We are still short of our 23.6% retracement level, so we expect further weakness before all of wave -iv- ends. Within wave -iv-, we look to have completed wave *a* at 3260.50, a wave *b* bearish triangle at 3328.40, and we are falling in wave *c*, which could be complete at the 3201.10 low.
On our Intraday Chart, the drop from 3435.00 to the current low of 3274.70 looks corrective, which suggests that after this correction ends, gold is going back to at least the 3435.00 high!
The other possibility is that wave -iii- is still underway and that wave @v@ of *iii* is extending and not complete at the 3167.70 high.
Only a break under the 3167.70 high would eliminate this option.
Trading Recommendation: Go long gold. Use puts as stops.
Active Positions: Long gold, with puts as stops!
CDNX:
 The Captain’s daily CDNX chart.
Analysis:
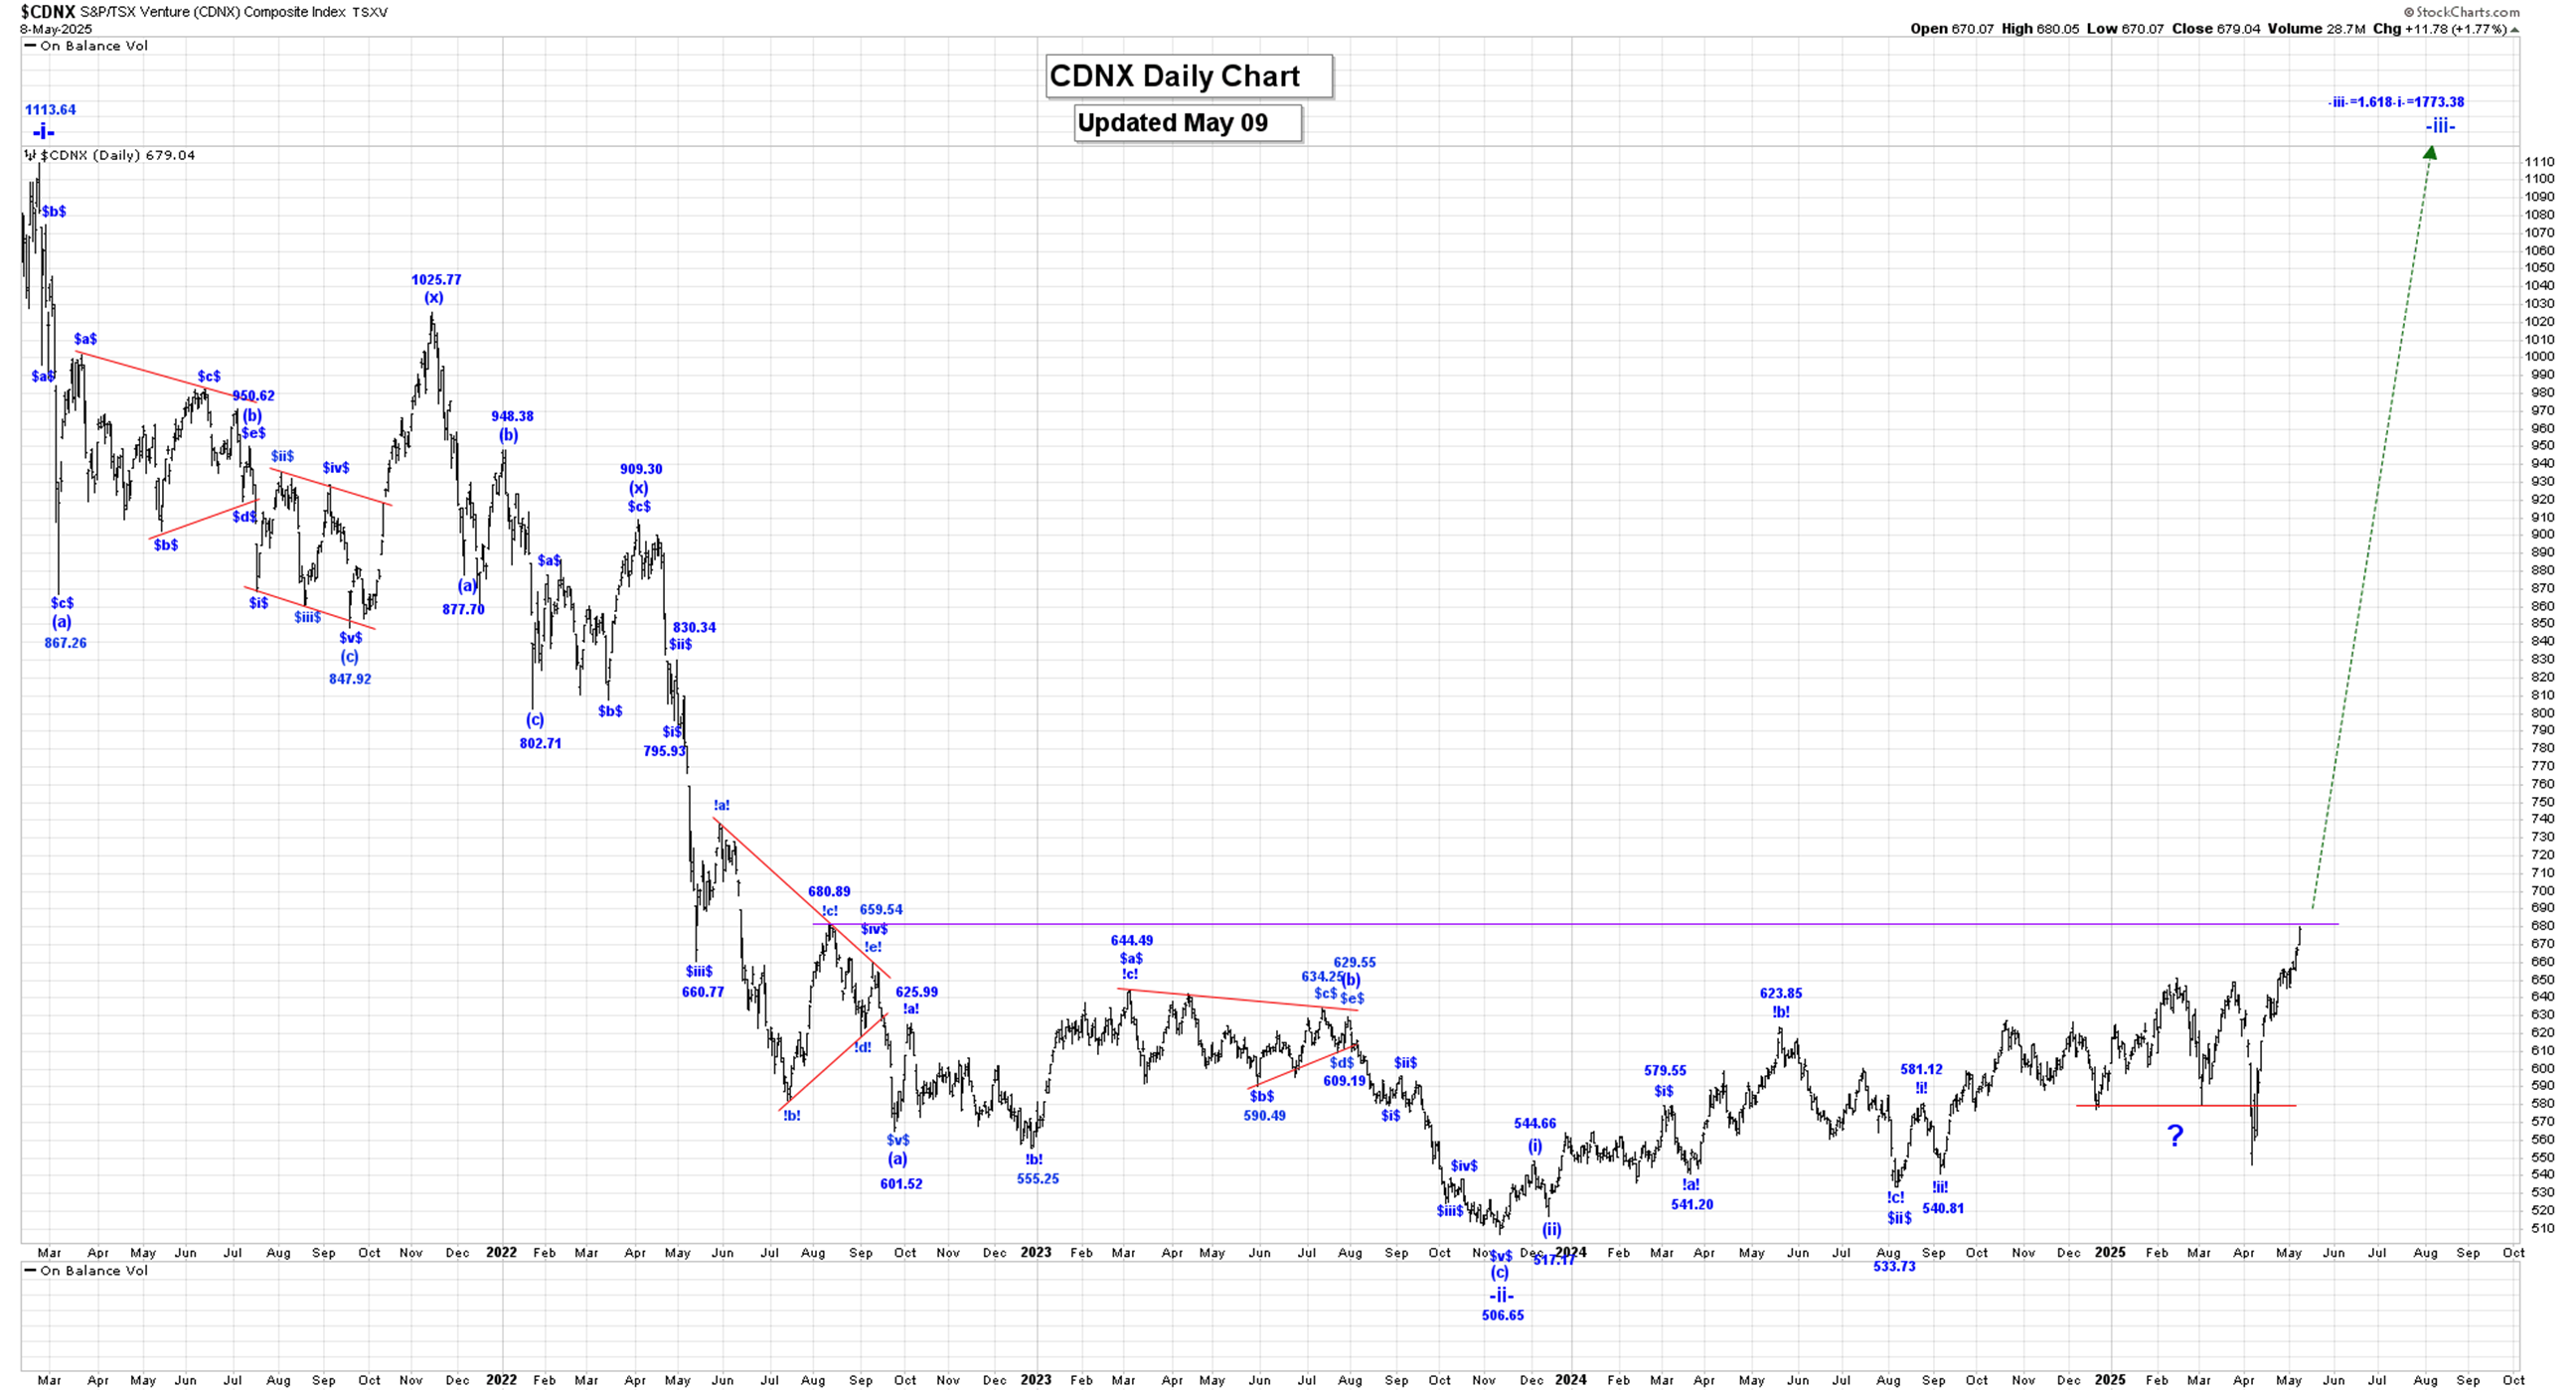
Wave -ii- is complete at the 506.65 low, and we are slowly starting to move higher in wave -iii-, and we are now suggesting that within wave -iii-, wave .i. ended at 623.85 and wave .ii. at 575.92…
And if that is the case, then we are now moving sharply higher in wave .iii..
More details in our Monday Morning Post.
Our initial projection for the end of wave -iii- is:
-iii- =-1.618-i- = 1773.52!
Our minimum multi-year long-term target for the end of wave C is 3341.56.
Trading Recommendation: Go long the GDXJ as a long-term hold.
Active Positions: Long the GDXJ and key CDNX juniors, for a long-term hold!
Oil:
 The Captain’s weekly oil chart.
Analysis:
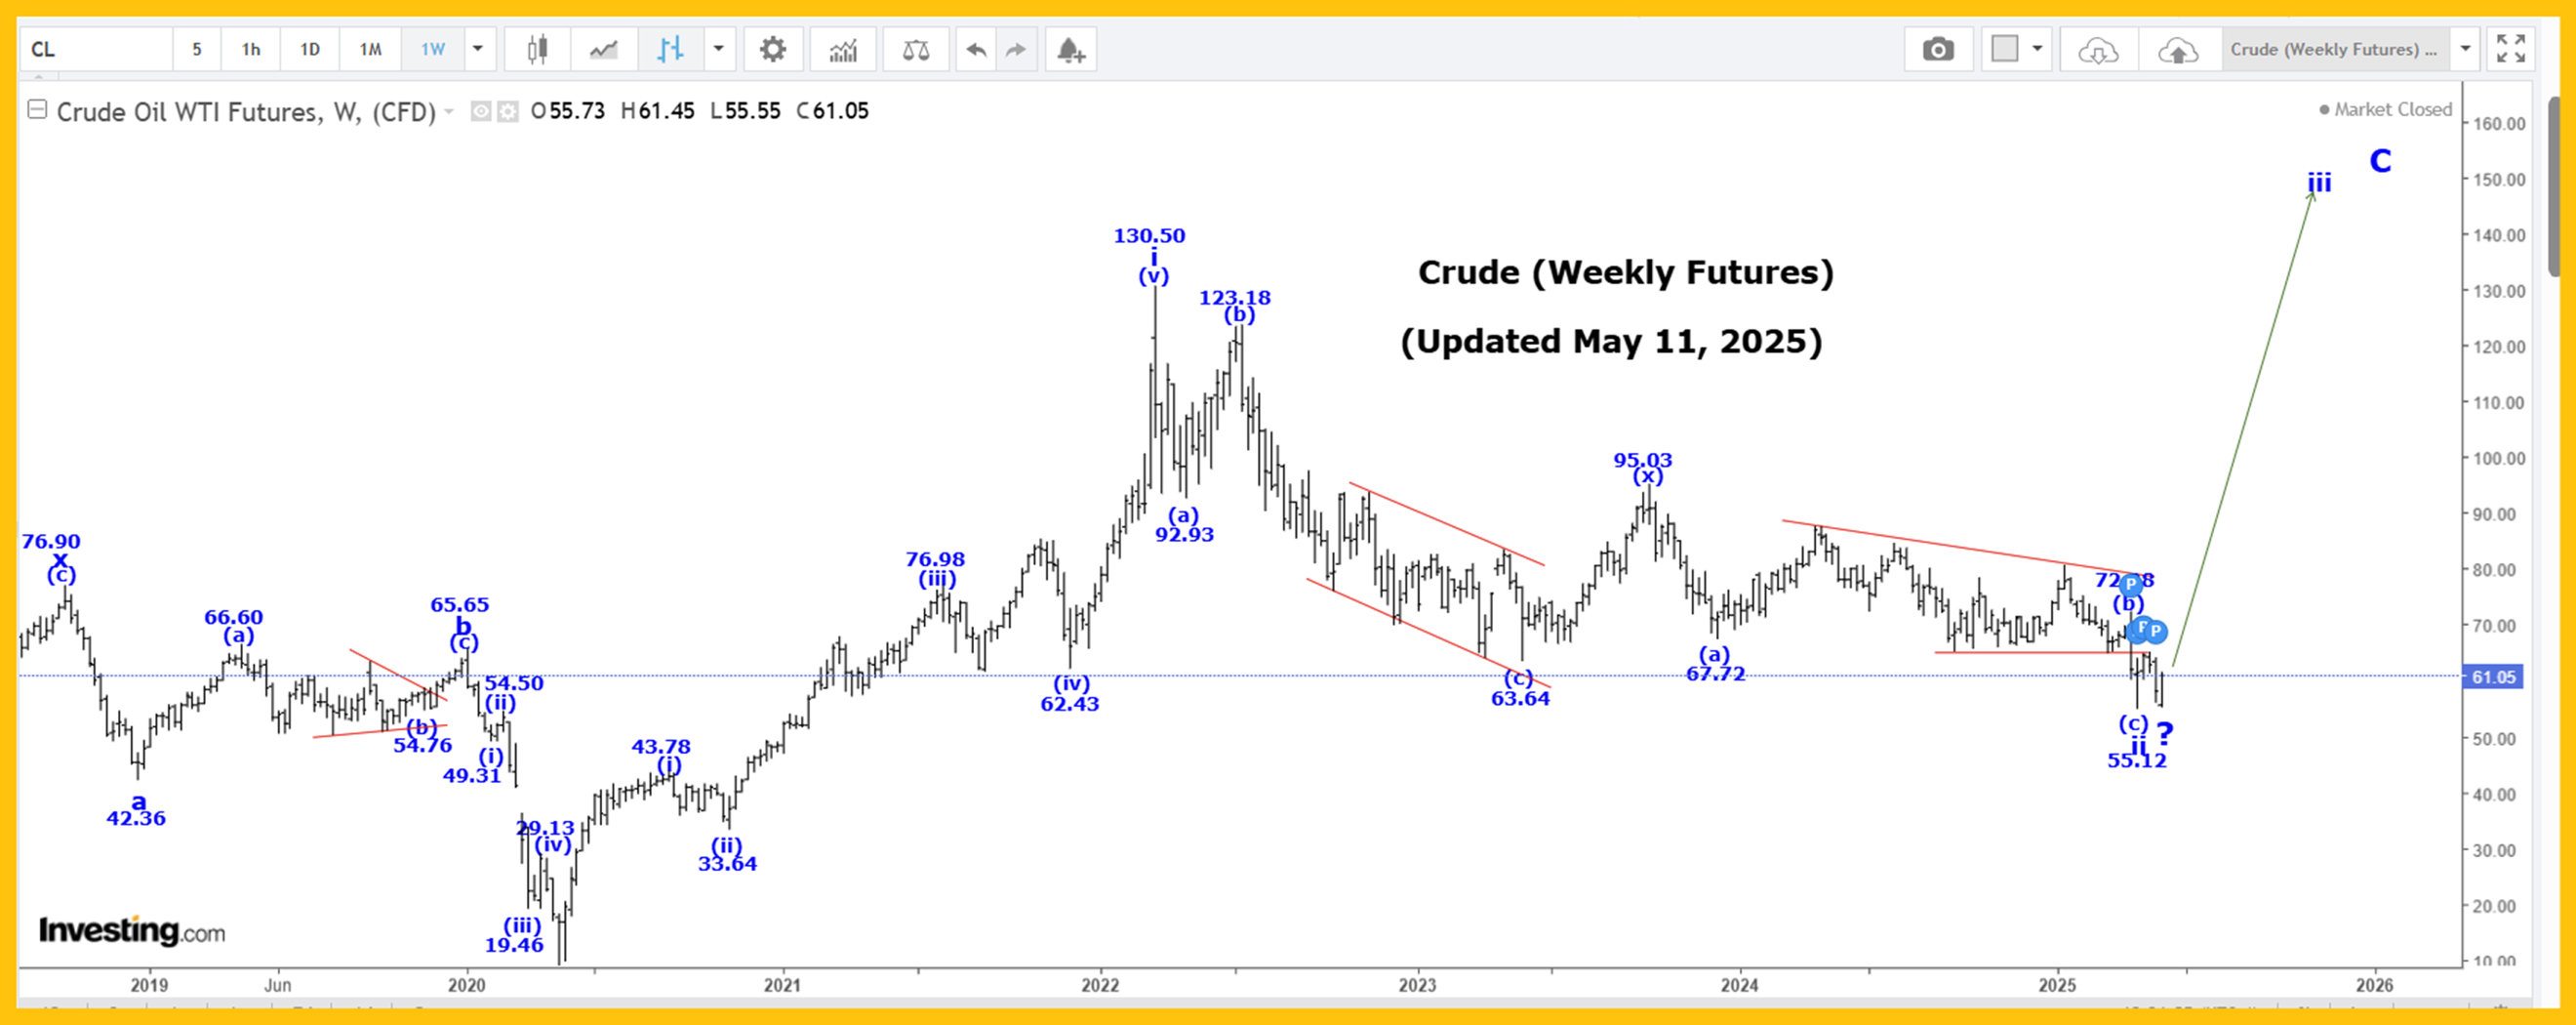
Wave ii is a double 3-wave pattern as shown on our Weekly Crude Chart.
Our first 3 wave (a)(b)(c) pattern ran from the wave i high 130.50 to 63.64, with wave (x) ending at 95.03 and our second (a)(b)(c) patterns looks like wave (a) ended at 67.72, our wave (b) bearish triangle at 72.28…
And our wave (c) thrust ended at perhaps the 55.12 low!
If that is the case, then we are now starting to move higher in the initial stages of wave iii.
Our retracement levels for all of wave ii are:
50% = 68.50.
61.8% = 53.87.
In the long term, we are now rallying in wave C which has the following projections:
C = A = 153.77;
C = 1.618A = 244.78!
Trading Recommendation: Go long crude with a put as a stop. Go long Suncor and/or other key oil stocks.
Active Positions: Long crude with puts as a stop! Long Suncor!
Thank-you!
Captain Ewave & Crew
About the author
