
- A child who is a brat and a bully must be punished or be isolated so they can’t harm other children. The US government has become the world’s largest brat, using fiat and debt to relentlessly bully citizens at home and in faraway lands. What happens now?
- Well, it appears that a few congressmen have forced Kevin McCarthy to become a listener more than a speaker. That likely means the days of a US government mouse that roars are coming to an end.
- For currency investors, the big theme of next decade (and probably the next 200 years) will be gold.
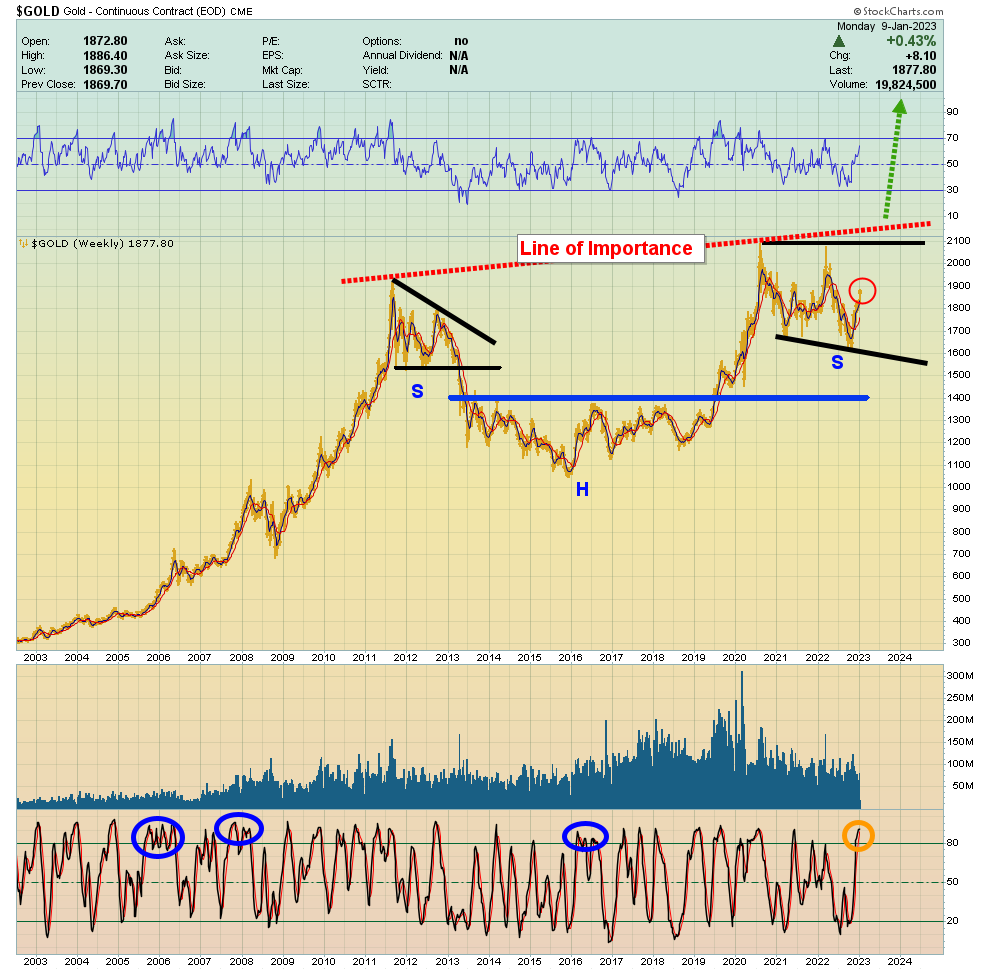 Click to enlarge. Not all technical lines of importance are part of a classic chart pattern, and that’s the case with this long-term chart for gold.
- There was an inverse H&S/C&H pattern. It’s morphed into something much less perfect (more of a price blob than a chart pattern), but it’s still incredibly bullish.
- A trendline of great importance is drawn across the highs of 2011 and 2020.
- Ultimately, a breakout above $2200 to $2500 likely ushers in the next wave of stagflation and war cycle action for America, and the beginning of what I call the “gold bull era” for 3 billion gold-oriented citizens of China and India (and for eager gold bugs in the West).
- Please click here now. The Chinese PBOC’s monthly purchases have increased from about 20 tons a month to about 30. That’s significant.
- To view some more important love trade news, please click here now. Rumours of an upcoming Indian gold duty cut began in December.
- Please click here now. The rumours are intensifying this morning. I’m predicting a cut will be announced in the February budget. Over time, the duty is likely to drop to about 5%, which is incredibly bullish for gold.
- For a look at key gold price levels for investors to buy and sell, please click here now. Double-click to enlarge. I’m prepared to sell 20% of my GDX in the current $1880-$1900 zone. I sold 5% of it yesterday.
- Investors don’t have to sell anything, but they should be emotionally ready for a pause in the upside action.
- The $1808-$1780 area is now a significant buy zone.
- For a look at the GDX chart itself, please click here now. Double-click to enlarge. GDX broke out of a rough inverse H&S pattern on Friday.
- The targets are $33-$36, and then $40, but the action of gold in the $1880-$1900 zone will likely determine the next move for GDX and most miners.
- A daily focus on the big picture is critical for investors as inflation, the 2021-2025 war cycle, and empire transition dominate the investing landscape. I cover that big picture 5-6 times a week in my flagship Galactic Updates newsletter. At $199/year, investors feel the price is too low, but I’m offering a $179/15mths “super special” that investors can use to get in on the action this week. Click this link to get the offer or send me an email and I’ll get you a payment link. Thanks!
- What about the stock market? Please click here now. Double-click to enlarge. Most investors are spouting what I view as “irrelevant gibberish” about Fed policy pivots.
- They bet against imminent Fed tightening in 2021, stayed in the market (and bought more stock), and did the same thing in early 2022. They paid the price for that silliness and now they want the Fed to act like a soup kitchen and bail them out.
- That won’t be happening, and for more insight into the matter, please click here now. Double-click to enlarge this oil price chart. A huge bull wedge is in play… and within that several inverse H&S patterns are also apparent.
- A Fed hiking pause is possible, but so is a new round of hikes if oil blasts out of the wedge pattern and surges to $110, $120, or $130.
- Stock market investors would be financially annihilated in that scenario and they could be thrust into a very depressing multi-decade stagflationary gulag.
- For a look at silver, please click here now. Double-click to enlarge. While the consolidation of the past month may be disappointing for some silver bugs, the metal surged 30% higher in a very short time and…
- There’s been no significant pullback. Technically, that’s a sign of a very strong market.
- Please click here now. Double-click to enlarge this SIL chart. Technically, silver stocks are acting more like gold and GDX than silver bullion, and that’s a leading signpost for the metal itself. Light profits can be booked, but I’ll dare to suggest that this is only stage one… of a multi-year upside run!
Thanks!
Cheers
St
About the author
