
“Never attribute to malevolence what is merely due to incompetence.”
—Arthur C. Clarke, English science fiction writer, futurist, inventor, undersea explorer, television series host; 1917–2008
“War is God’s way of teaching Americans geography.”
—Ambrose Bierce, American short story writer, journalist, poet, Civil War veteran, satirist, wrote The Devil’s Dictionary 1906–1911; 1842–1914
“People with a sense of fulfillment think the world is good, while the frustrated blame the world for their failure.”
—Eric Hoffer, American moral and social philosopher, author, winner of Presidential Medal of Freedom 1983, wrote The True Believer 1951; 1902–1983
The AI/High-Tech Rally
Welcome to the trillion-dollar club Nvidia. Rarified air. How long you stay there is anyone’s guess. Or maybe you just pop in and out. Apple, Microsoft, Saudi Aramco, Alphabet (Google), and Amazon are already there. Six companies over $1 trillion market cap. To put that in perspective, only 16 countries have a nominal GDP over $1 trillion. The largest, Apple, with a market cap of $2.8 trillion would make them the fifth largest country in the world and the second largest state in the U.S. behind California. Poor Nvidia would be 17th, just ahead of Turkey. When you are bigger than most countries you can wield unusual power.
BHP Group is the world’s largest mining company with a market cap of $138.7 billion, ranking them only 79th in the world. The largest gold mining company? Newmont, with a market cap of $32.4 billion. That ranks them 529th. The entire gold mining market cap is less than $500 billion. Tech tops mining. It’s tough being a miner. Apple could gobble up the entire gold mining industry and have cash to spare. Owners of gold mining companies must be masochists.
In terms of return, Axios (www.axios.com) posted this chart on the 10-year return on select stocks. Nvidia topped the list with a whopping 10,614% return. Not to embarrass the miners, but we created a similar chart for 10 select mining and gold companies plus gold, silver, and the TSX Gold Index (TGD). The comparison, as one could expect, wasn’t pretty. Franco-Nevada is the only one who would penetrate the high-tech stocks list.
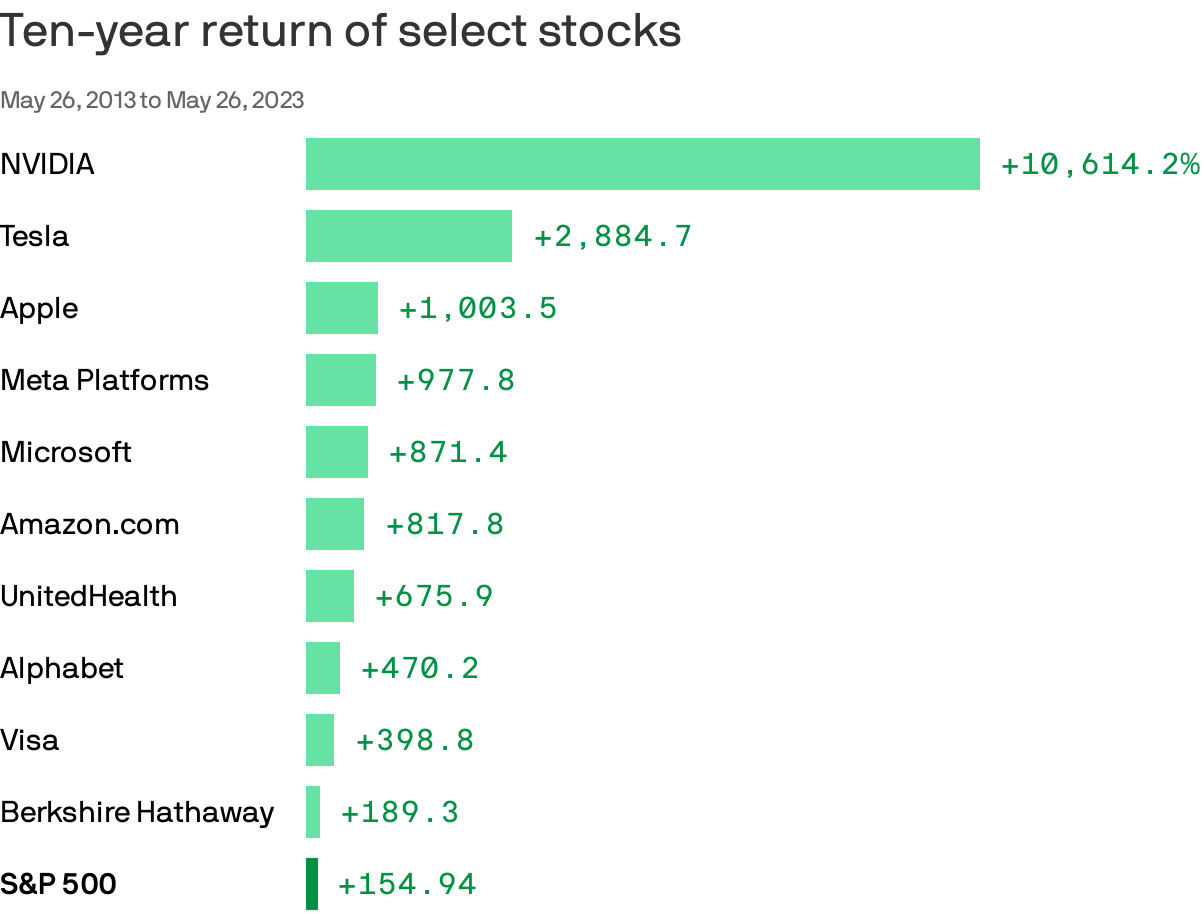
Source: www.axios.com, www.factset.com
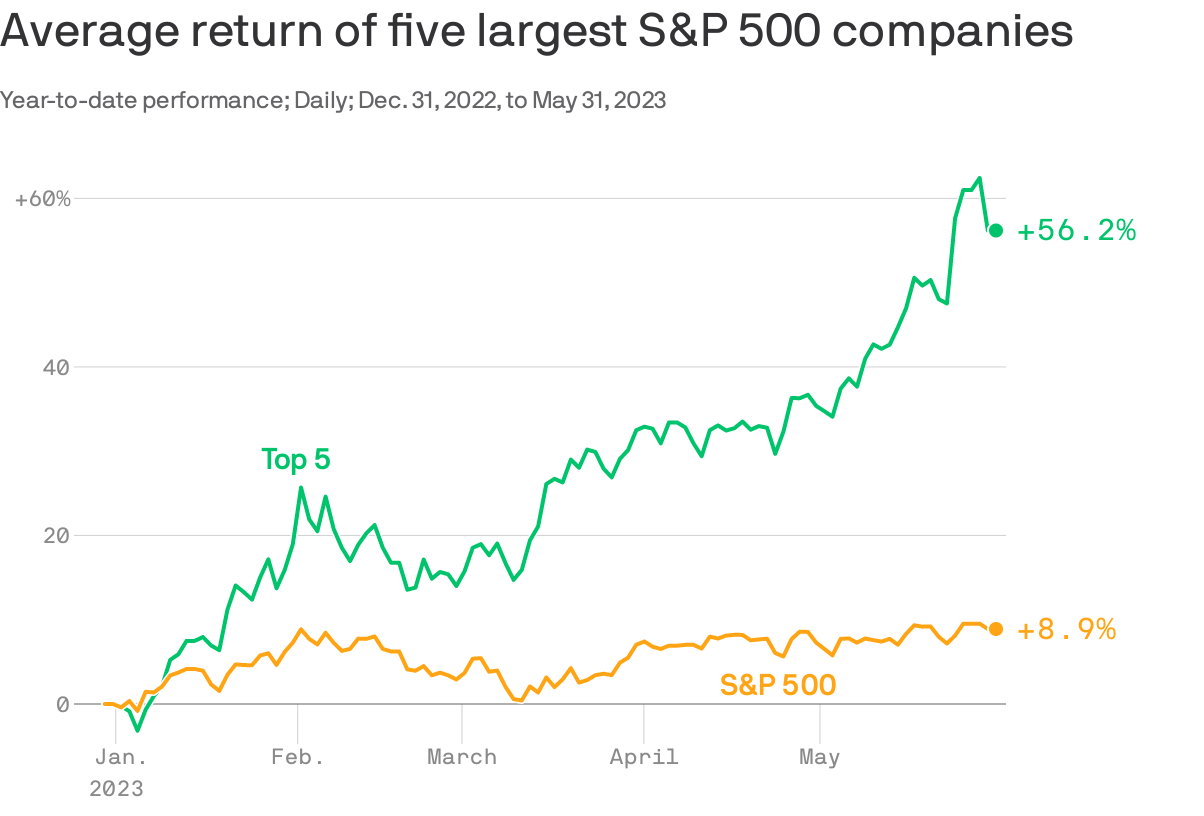
The high-tech stocks have been pushing the market higher. The S&P 500 is up 8.9% to May 31, 2023 and 9.7% if one includes dividends. However, the top five stocks in the S&P 500 are up 56.2% in 2023. The “Big Five”—Apple, Microsoft, Alphabet (Google), Amazon and, of course, Nvidia. Nvidia is up 159% so far in 2023. Without them, the S&P 500 would be up only 1.5%. But the S&P 500 is a market-cap weighted index. The more equal S&P 500 Equal Weight Index is actually down 1.4%.
In terms of market cap capitalization, those five companies constitute 24.3% of the entire S&P 500. Never has it been so high. So, what we do call this? The AI rally? The NY FANG rally? The market from 2009 to the top in 2022 was led by the FAANGs. The great high-tech/dot.com market of the late 1990s was led by what is known as the “Four Horsemen”: Microsoft, Cisco, Oracle, and Intel. In the late 1960s–early 1970s, we had the Nifty Fifty rally. The Nifty Fifty rally ended in tears with the S&P 500 down 48.2% from the top on January 11, 1973
to the final low on October 3, 1974. The high-tech/dot.com rally of the late 1990s topped in January
2000 and March 2000. The bottom came in October 2002 and the S&P 500 had fallen 49.1%. Is it a coincidence that the 2022 market topped on January 4? When will the final low come? And how far will the S&P 500 fall? If this market is to recover, it will have to be dragged higher by the big AI stocks. Or will we end up as we did before, down over 50% and taking years to recover?
Years to recover—the 1973/1974 bear (actually 1966 to 1982) did not see the highs taken out until 1983; the 2000–2009 bear that included the financial crisis did not see the highs taken out until 2013. The odds are probably high that the 2022 high in the market will be the top for a number of years to come. The granddaddy is the Tokyo Nikkei Dow (TKN) in that, 33 years later, the 1990 high remains intact. Not to feel left out, the high of 1929 was not exceeded until 1954, 25 years later.
Ten-Year Return for Select Mining and Gold Mining Stocks
May 26, 2013– May 26, 2023
|
Franco Nevada |
+304.5% |
|
Rio Tinto |
+185.5% |
|
Wheaton Precious Metals |
+126.4% |
|
Agnico-Eagle Mines |
+108.6% |
|
BHP Group |
+85.2% |
|
Newmont |
+57.3% |
|
Glencore |
+52.5% |
|
Vale |
+48.5% |
|
Freeport-McMoRan |
+32.3% |
|
Barrick Gold |
+3.2% |
|
Gold |
+40.3% |
|
Silver |
+3.9% |
|
TSX Gold Index (TGD) |
+54.7% |
|
TSX Composite |
+57.3% |
Source: www.stockcharts.com
Source: www.axios.com, www.factset.com
If there is one consolation, there is a good chance that the coming years should see a significant commodities rally. The super bulls are calling it a commodity supercycle. Why would we think that? The 1970s were a terrible decade for the stock market but a boom for commodities; the 1980s and 1990s were superb for the stock market but the commodity markets were a disaster; the 2000s were once again a disaster for the stock markets but commodities did quite well, even as they topped out at different times; and finally, the 2010s were great for the stock market but the commodities struggled as we can attest with those two charts of a 10-year snapshot of select stocks vs. a 10-year snapshot of select mining and gold stocks.
It's almost a year and half since the stock market topped. Are the two about to switch places once again? Gold has hit new all-time highs. The CRB Index, an index of commodities, rallied 225% from a major low in April 2020. It has since had a 23% pullback and many commodity stocks have struggled. The depressed commodity markets certainly hope that the struggle could soon be over.
Below is a chart of the CRB Index (a measurement of global commodity markets) which is a basket of 19 commodities with 39% energy (i.e., oil), 41% agriculture (i.e., wheat), 7% precious metals (i.e., gold), and, 13% industrial metals (i.e., copper). Note the powerful Elliott five-wave decline from the high in 2008. Is this the ABC reaction rebound?
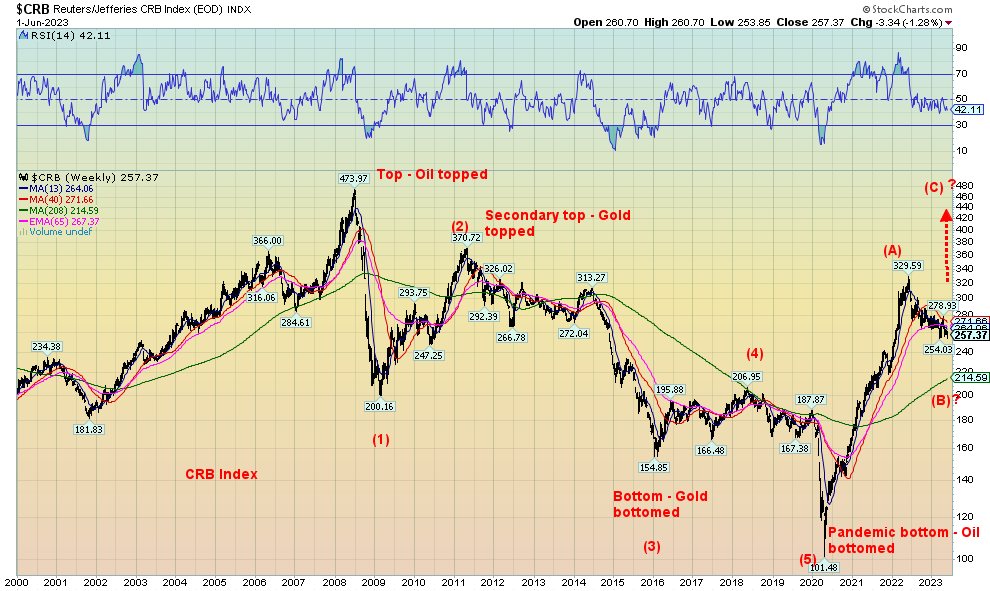
Source: www.stockcharts.com
The Debt Ceiling—Finally
This really shouldn’t have come as a surprise that they would eventually find a way to raise the debt ceiling. Well, they actually didn’t raise it; they just suspended it until January 2025, just past the 2024 election. Sure, there were some compromises on both sides, but most of Congress recognized the dangers of letting this war continue. The Senate also passed it easily. Next, Biden signs it. What is interesting is that the new Congress is sworn in at the beginning of January and the president is sworn in on January 25, 2025. Conveniently, this pushes it out to the next administration. But will this end the argument?
The deal has avoided what could have been a financial disaster. No surprise then that stocks rose, gold fell, oil rose, bond yields fell, and the US$ Index rose. But the risks remain. Inflation is still well above the Fed’s target of 2%, interest rates remain higher than what everyone got too used to, and the economy remains mixed. As well, there remains trouble in commercial real estate, corporations are facing downgrades, the consumer
still spends and consumer debt continues to grow, Germany is in recession, and China is wavering. Oh yes, and the war continues (which is inflationary), China and the U.S. remain at loggerheads inflicting economic damage on each other while playing war games, and extreme weather is not going away as it displaces thousands. Droughts in numerous countries, particularly in major growing zones, are a major reason behind food inflation.
The U.S. still faces a potential downgrade because of the fractious war over the debt ceiling. For the hard-liners on both sides, this deal is a poor one but for completely different reasons. However, we can’t help notice that following the debt limit crisis of 2011, gold went on a tear to the upside, topping out later that year. No doubt it was fueled by the S&P downgrade from AAA to AA+, amongst other reasons. Will history repeat itself?
Canada GDP Growth Annualized
Canada GDP Growth 2020–2023
Source: www.tradingeconomics.com, www.statcan.gc.ca
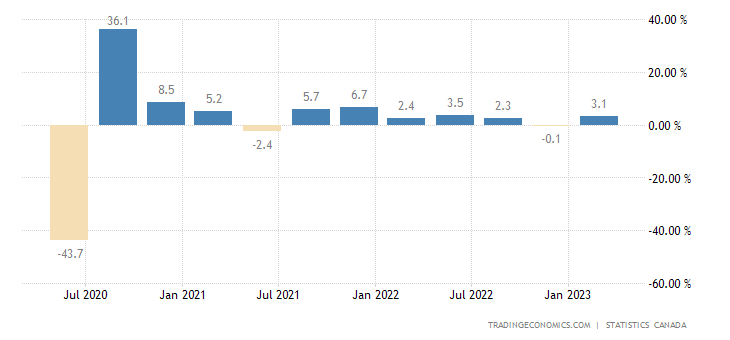
Is Canada on fire? Well, actually it is with devastating fires in Alberta, B.C., New Brunswick, and Nova Scotia. Dozens, even hundreds of homes have been lost and thousands displaced. But no, the fire here is GDP growth. Canada shocked for the quarter ended in March 2023 with annualized growth of 3.1%. It had rebounded from negative 0.1% growth in Q4 2022 and beat expectations of a gain of 2.5%. Canada’s international trade expanded as did consumer spending, even as it sent consumer debt levels in Canada from the stratosphere into, well, the next level of the stratosphere. Even preliminary numbers for April show above- expectations growth. The strong growth offset declines in inventories and housing investment.
Speaking of fires, we can’t help but notice that insurance companies, pounded by the shock of fires, hurricanes, and floods are now making parts of the U.S. uninsurable. One can only guess that it could have a profound impact on where people decide to live. Will the same come to Canada?
Nonetheless, the stronger than expected growth has many thinking the BofC will be forced to hike rates once again at its next meeting on June 7, 2023. Given the growing level of delinquencies on mortgage debt, this, we suspect, will not be received well if they do decide to hike. Consumer spending continues to rise, even as a good portion of it is being fueled by more debt. Canada’s household debt to GDP remains one of the highest in the world. We suspect that the BofC will stand pat on June 7.
Canada Retail Sales Y-O-Y and Consumer Credit 2013–2023
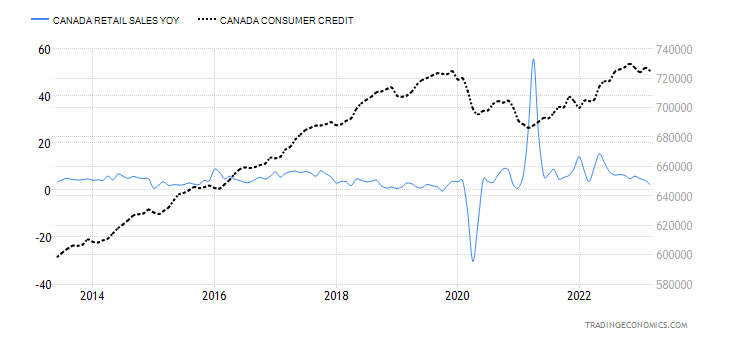
Source: www.tradingeconomics.com, www.statscan.gc.ca
Chart of the Week
U.S. Job Numbers
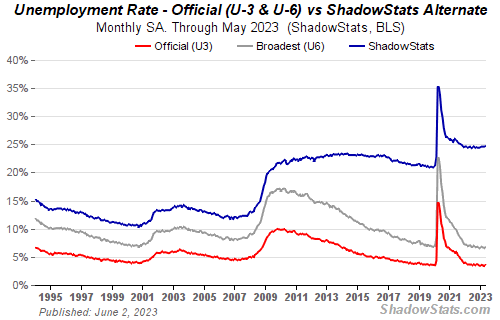
Source: www.shadowstats.com
Don’t you just love surprises. Actually, it was a double whammy or even a triple one. And it causes confusion. The U.S. nonfarm payrolls came in at an unexpected 339,000 for May. That was well above the expected 190,000. Then they revised April upward to 294,000. After that came the whammy as the unemployment rate (U3) rose to 3.7% from 3.4%. Heads were spinning. It is notoriously difficult trying to predict the monthly nonfarm payrolls as there are some surveys and variables that go into it. But the unemployment rate is usually pretty good. The market had expected an uptick to 3.5%. Without going further on the surface, it puts the Fed in a quandary for the June 13–14 FOMC. Do they raise rates again? Or stand pat? The consensus still says stand pat.
Fed officials have to, by necessity, go beyond the headline numbers. And, boy, are there numbers, a raft of them actually, published by the Economic Research arm of the Fed known as FRED, put out by the Federal Reserve Bank of St. Louis (www.stlouisfed.org). In turn, these numbers come from the Bureau of Labour Statistics who publish the monthly Employment Situation Report (www.bls.gov). In Canada, that is done by Statistics Canada (www.statcan.gc.ca). Eyes cannot glaze over while poring through these reams of statistics.
We can’t go too deep either or we’d be here for a week. First off, the civilian labour force jumped by only 130,000. But the employment level fell by 310,000. Reconcile that one. The population level—meaning, all those over the age of 15 that could be a part of the labour force—rose by 175,000. Meanwhile, the unemployment level—the number unemployed that make up the U3 unemployment number—rose by 440,000. Finally, those not in the labour force which includes retirees, disabled people, full-time students, and more fell by 306,000. The Fed takes their information from numerous sources and there is a certain amount of extrapolation that’s not unusual with statistics. We will not, nor can we, explain all of these differences. We just note them. Which is no different than what FRED, the BLS, or StatsCan does. They report them. Then they leave to us to figure it all out.
Numerous economists at large (and small) financial institutions try to explain them. And, no surprise, there are different opinions. So why so many discrepancies? Well, it’s partly because of two different surveys: the Household Survey of the BLS, which gives us the unemployment rate amongst others, and the Establishment Survey, which gives us the nonfarm payrolls. The BLS doesn’t go into any depth explaining the differences. But we note the rise in the labour force helped push up the unemployment rate (U3) to 3.7% from 3.4%.
The number for those working full-time fell by 23,000, but those working part-time also fell 220,000. Yet nonfarm rose 339,000? The labour force participation rate was unchanged at 62.6% but the employment population ratio fell to 60.3 from 60.4. While the U3 unemployment was up to 3.7%, the U6 unemployment rate, the highest reported by the BLS (representing the U3 rate, plus all persons marginally attached to the labour force, plus total employed for economic reasons as a % of labour force, plus all persons marginally attached) rose to 6.7% from 6.6%. Finally, the Shadow Stats (www.shadowstats.com) unemployment, representing U6 plus those discouraged workers defined out of the labour force by revisions in 1994, was 24.7% vs. 24.6% in April.
As we note, one of the big reasons for the discrepancies is the difference between the household survey and the establishment survey. One is showing strength (nonfarm payrolls), while the other is showing weakness (unemployment rate). The household survey is the more volatile and revisions can sometimes be sharp, either up or down. The markets, however, just take the good news, meaning the big jump in nonfarm; result stocks rose, gold sold off, oil rose, the US$ Index rose, and bond yields rose. Will the Fed hike on June 13–14? We continue to suspect not, but then the gangbusters nonfarm might sway them to do otherwise.
Markets & Trends
|
|
|
|
% Gains (Losses) Trends
|
|
||||
|
|
Close Dec 31/22 |
Close Jun 2, 2023 |
Week |
YTD |
Daily (Short Term) |
Weekly (Intermediate) |
Monthly (Long Term) |
|
|
Stock Market Indices |
|
|
|
|
|
|
|
|
|
S&P 500 |
3,839.50 |
4,282.37 |
1.8% |
11.5% |
up |
up |
up |
|
|
Dow Jones Industrials |
33,147.25 |
33,762.76 |
2.0% |
1.9% |
neutral |
neutral |
up (weak) |
|
|
Dow Jones Transport |
13,391.91 |
14,150.48 |
1.8% |
5.7% |
up (weak) |
neutral |
neutral |
|
|
NASDAQ |
10,466.48 |
13,190.48 (new highs) |
1.7% |
26.0% |
up |
up |
up (weak) |
|
|
S&P/TSX Composite |
19,384.92 |
20,024.63 |
0.5% |
3.3% |
down |
neutral |
up (weak) |
|
|
S&P/TSX Venture (CDNX) |
570.27 |
609.08 |
0.8% |
6.8% |
down (weak) |
neutral |
down |
|
|
S&P 600 (small) |
1,157.53 |
1,181.71 |
3.1% |
2.1% |
up |
down (weak) |
neutral |
|
|
MSCI World Index |
1,977.74 |
2,083.70 |
0.1% |
5.4% |
down |
up (weak) |
up (weak) |
|
|
Bitcoin |
16,535.23 |
28,947.53 |
7.9% |
75.1% |
down |
up |
neutral |
|
|
|
|
|
|
|
|
|
|
|
|
Gold Mining Stock Indices |
|
|
|
|
|
|
|
|
|
Gold Bugs Index (HUI) |
229.75 |
245.77 |
2.5% |
7.0% |
down |
up |
neutral |
|
|
TSX Gold Index (TGD) |
277.68 |
295.40 |
1.2% |
6.4% |
down |
up |
up (weak) |
|
|
|
|
|
|
|
|
|
|
|
|
% |
|
|
|
|
|
|
|
|
|
U.S. 10-Year Treasury Bond yield |
3.88% |
3.69% |
(3.2)% |
(4.9)% |
|
|
|
|
|
Cdn. 10-Year Bond CGB yield |
3.29% |
3.23% |
(3.0)% |
(1.8)% |
|
|
|
|
|
Recession Watch Spreads |
|
|
|
|
|
|
|
|
|
U.S. 2-year 10-year Treasury spread |
(0.55)% |
(0.82)% |
(7.9)% |
(49.1)% |
|
|
|
|
|
Cdn 2-year 10-year CGB spread |
(0.76)% |
(1.08)% |
(10.2)% |
(42.1)% |
|
|
|
|
|
|
|
|
|
|
|
|
|
|
|
Currencies |
|
|
|
|
|
|
|
|
|
US$ Index |
103.27 |
103.95 |
(0.2)% |
0.7% |
up |
down (weak) |
up |
|
|
Canadian $ |
73.92 |
74.50 |
1.4% |
0.8% |
up |
neutral |
down |
|
|
Euro |
107.04 |
107.07 |
(0.2)% |
flat |
down |
down |
down (weak) |
|
|
Swiss Franc |
108.15 |
110.02 |
(0.4)% |
1.7% |
down |
up |
up |
|
|
British Pound |
120.96 |
124.52 |
0.8% |
2.9% |
neutral |
up |
down (weak) |
|
|
Japanese Yen |
76.27 |
71.44 |
0.4% |
(6.3)% |
down |
down (weak) |
down |
|
|
|
|
|
|
|
|
|
|
|
|
|
|
|
|
|
|
|
|
|
|
Precious Metals |
|
|
|
|
|
|
|
|
|
Gold |
1,826.20 |
1,969.60 |
1.3% |
7.9% |
down |
up |
up |
|
|
Silver |
24.04 |
23.75 |
1.7% |
(1.2)% |
down |
up (weak) |
up (weak) |
|
|
Platinum |
1,082.90 |
1,003.50 |
(2.4)% |
(7.3)% |
down |
up (weak) |
up |
|
|
|
|
|
|
|
|
|
|
|
|
Base Metals |
|
|
|
|
|
|
|
|
|
Palladium |
1,798.00 |
1,403.50 |
(1.6)% |
(21.9)% |
down |
down |
down |
|
|
Copper |
3.81 |
3.73 |
1.4% |
(2.1)% |
down |
down (weak) |
neutral |
|
|
|
|
|
|
|
|
|
|
|
|
Energy |
|
|
|
|
|
|
|
|
|
WTI Oil |
80.26 |
71.74 |
(1.3)% |
(10.6)% |
down |
down |
neutral |
|
|
Nat Gas |
4.48 |
2.17 |
(10.3)% |
(51.6)% |
down |
down |
down |
|
Source: www.stockcharts.com
Note: For an explanation of the trends, see the glossary at the end of this article.
New highs/lows refer to new 52-week highs/lows and, in some cases, all-time highs.
Source: www.stockcharts.com
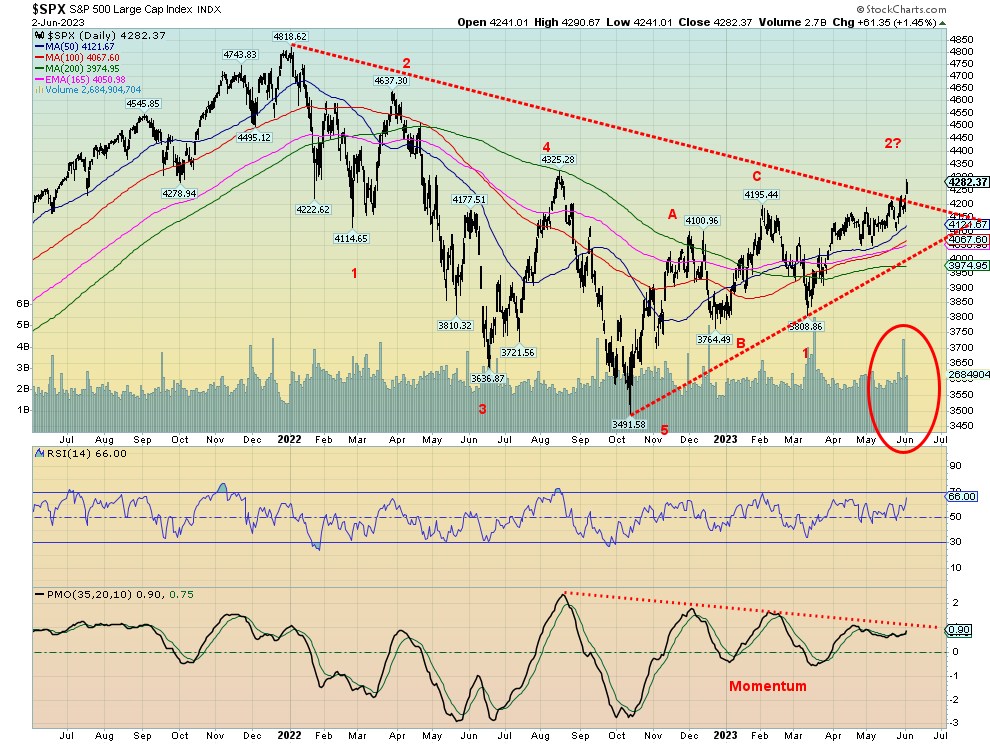
The stock market was pleased about the suspension of the debt ceiling and it was even more pleased about the job numbers on Friday. To the bears out there, which are plentiful, right now the market is focusing on the good news (job numbers were great) and ignoring the background noise (the rising unemployment rate, the ongoing trouble in the housing market, consumer market, and commercial real estate market, persistent inflation, and more). Responding positively to good news and ignoring bad news makes for an upward chugging market. But it doesn’t necessarily mean it’s a good market, even as it seems to suggest it is climbing a wall of worry.
This past week the S&P 500 gained 1.8%, the Dow Jones Industrials (DJI) was up 2.0%, the Dow Jones Transportations (DJT) gained 1.8%, and the NASDAQ was up 1.7%. The NY FANG Index was up 3.3%, carrying the market higher once again while the S&P 500 Equal Weight Index gained 1.8%, the same as the weighted S&P 500. The S&P 400 (Mid) was up 2.6% and the S&P 600 (Small) jumped 3.1%. At least they were up, giving us the impression of a budding bull.
In Canada, the TSX Composite was up 0.5%, and the TSX Venture Exchange (CDNX) was up 0.8%. In the EU, the London FTSE fell 0.3%, the EuroNext dropped 0.5%, the Paris CAC 40 fell 0.7%, while the German DAX gained 0.4%. Signs continue that the EU is falling into a recession as we know Germany is now in an official recession. In Asia, China’s Shanghai Index (SSEC) rose 0.6%, the Tokyo Nikkei Dow (TKN) made new highs again, up 2.0%, while Hong Kong’s Hang Seng (HSI) rose 1.1%. The TKN is inching towards the all-time highs but still has a long way to go.
Elsewhere, Bitcoin gained 7.9% back over 28,000 while the MSCI World Index was effectively flat, up only 0.05%.
The S&P 500 finally jumped firmly over that downtrend line from the January 2022 high and closed over 4,200. That bodes well going forward. Maybe we finally are feeling the January effect that saw the January market moving higher, suggesting that 2023 might not be so bad. Now we are into the period of what we note as the summer rally, which could carry us into July. Beyond that, we not so sure as there are just so many divergences between the indicators and the indices. We keep showing that falling momentum indicator of the S&P 500, even as the S&P 500 ploughs higher. The S&P 500 Equal Weight Index has also lagged the S&P 500 but did jump nicely this past week. Seems if your name isn’t Meta, Nvidia, Apple, Tesla, Microsoft, or Amazon, nobody gives two hoots about you. The tech-heavy NASDAQ has been the big winner this year, powering up 26% so far. The DJI, meanwhile, is only up 1.9% in 2023, lagging badly, and just another divergence that suggests, yes, we may be going higher but be cautious. As we noted, we’ve seen this picture before and it ends in tears.
In the interim, we’ll follow it higher, but beware the first week or so of July, a period that has seen tops in the past. We like the jump in volume this past week as that seemed to support the premise that we could be moving higher. At an RSI of 66, we are getting high but not as yet overbought. The debt ceiling debacle is behind us, but a ratings downgrade might shake the market. The job numbers were great and the market treats all the negative news as background noise. The bears keep pumping the bad news and they are not wrong, but they could be early, that’s all. Hope they are still solvent when the bear returns.
We have one breakdown point at 4,100, but the key and a confirmation of a breakdown comes under 3,900. Next up could come the August 2022 high of 4,325. Only above 4,500 can we think about the possibility of new all-time highs. Oddly enough, a possible head and shoulders pattern that formed at the lows from May to December suggests we could see new all-time highs up around 4,900. We won’t dismiss it. After all, the famous Nifty Fifty rally of 1972 took us to new highs above what we saw in 1966, but then fell 50% into 1974.
Source: www.stockcharts.com
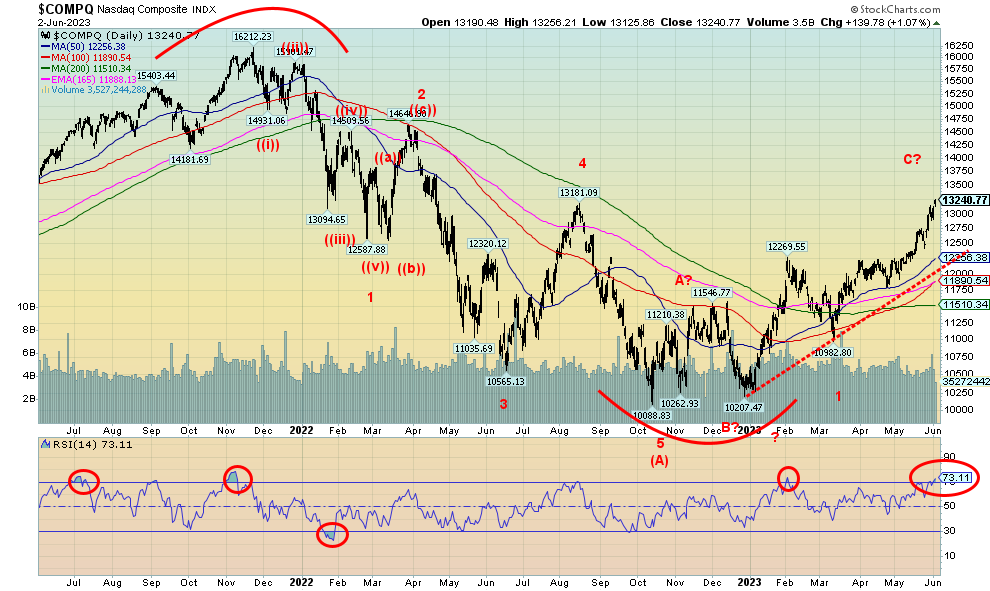
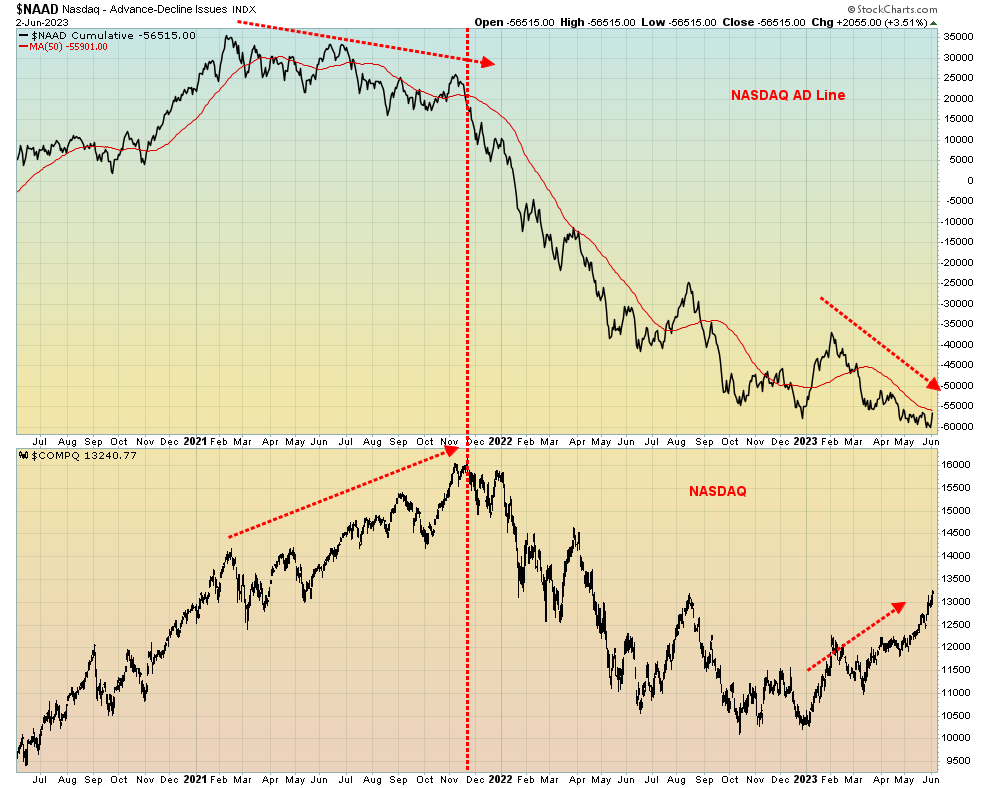
The NASDAQ continues to beat higher with a solid gain of 1.7% this past week. Helping matters along was, as usual, the FAANG stocks with the big winner this past week not Nvidia, as one would expect, but Snowflake, rebounding from a bad previous week. SNOW gained 16.8%. Otherwise, the best was Tesla, up 10.8%. Six of them made new 52-week highs: Meta, Apple, Netflix, Microsoft, Nvidia, and Advanced Micro. There was only one loser and that was Google, down just under 0.2%. The NY FANG Index gained 3.3% and continues to lead the way upward at the expense of everyone else. No surprise that the divergences just keep on going. The NASDAQ makes new highs but the DJI does not. For the NASDAQ, only 53% of stocks are above the 50-day MA and 37% above the 200-day MA. That’s well below recent highs, even as the NASDAQ powers higher. Our chart below of the NASDAQ vs. the NASDAQ advance/decline line shows a huge divergence, with the NASDAQ powering higher while the AD line powers lower. We are seeing this divergence everywhere. The market is going up but the indicators are telling us to be cautious. Note how it was at the high last November as the NASDAQ moved higher and the AD line was moving lower. The AD line won.
Source: www.stockcharts.com
Source: www.stockcharts.com
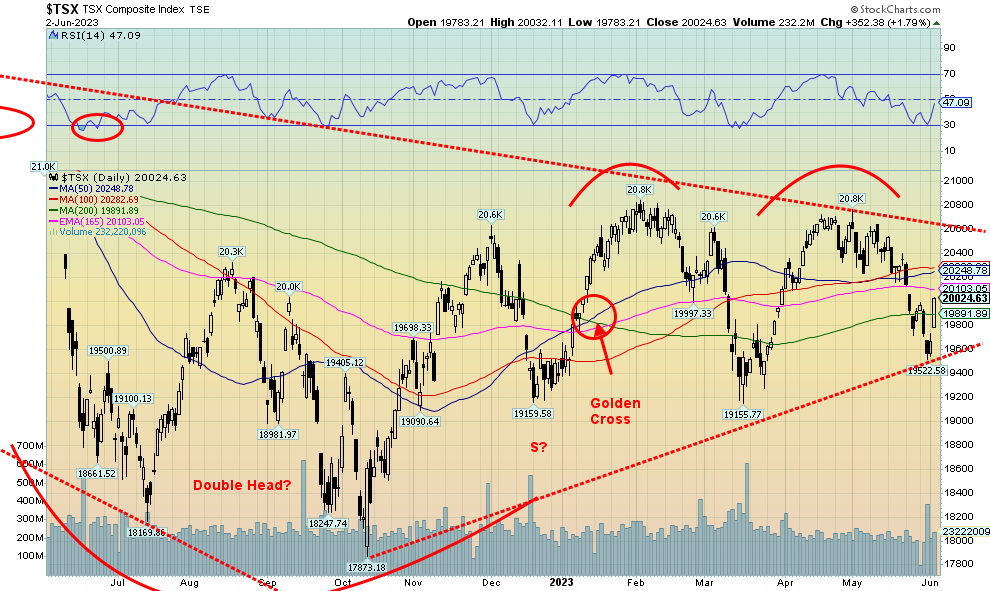
The TSX Composite did not show quite the same enthusiasm as the U.S. markets did this past week, but still finished in the black, up 0.5%. The junior TSX Venture Exchange (CDNX) remains in the doldrums but gained 0.8% this past week. Of the sub-indices, only three finished in the red while 11 posted gains. Leading the losers was Telecommunications (TTS), down 1.8%. Health Care (THC), a chronic loser, fell 1.3%, and Consumer Staples (TCS) lost 1.1%. Leading the winners was Metals & Mining (TGM), up 2.5%. Real Estate (TRE) jumped 2%, the only other significant winner, Information Technology (TTK), made new 52-week highs but gained only 0.3%. They can only wish they had Nvidia in the index. Anyway, that was a nice jump on Friday with the TSX up 1.8% on the day, saving the week from being a loser. A move over 20,250 would be positive, but we really need to see new highs above 20,800 to tell us we really are going higher. Under 19,500 we are looking lower to 19,200 and 19,000.
U.S. 10-year Treasury Bond/Canadian 10-year Government Bond (CGB)
Source: www.tradingeconomics.com, www.home.treasury.gov, www.bankofcanada.ca
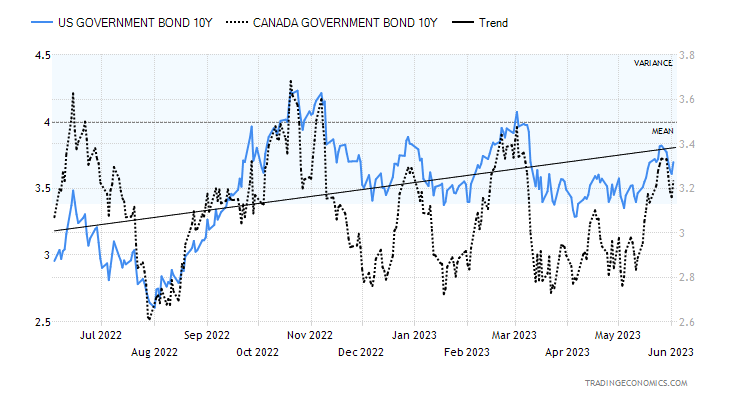
Interest rates were decidedly mixed this past week as initially the U.S. 10-year treasury note responded positively to the news that they had found a way to suspend the debt ceiling. But then came Friday’s unexpected job numbers and back up went yields. On the week the 10-year still finished lower at 3.69% vs. 3.81% the previous week, a decline of 3.2%. Canada fell too as the 10-year Government of Canada bond (CGB) was down to 3.23% from 3.33%, a decline of 3.0%. But short rates went up a bit and the spreads widened: the U.S. 2–10 spread fell to negative 82 bp from negative 76 bp and the Canadian 2–10 spread was down to 108 bp from negative 98 bp. The other watched spread—the 3-month–10-year spread in the U.S.—was negative 170 bp and in Canada negative 143 bp. Both spreads continue to point to a coming recession, but as we have noted, it won’t start until the yield curve starts to normalize. No sign of that yet.
At least with the debt limit suspension, that helped short rates and the four-week treasury bill fell to 5.24% from 5.6%. That’s still rather high. One thing the decline in yields did do this week was to keep intact what appears to us a descending triangle with the relatively flat bottom around 3.35% and a series of declining highs: a high in October 2022 at 4.32%, a second high in March 2023 at 4.07%, and the most recent high at 3.82%. Breaking the March high of 4.07% would tell us we are going higher, but a breakdown under 3.35% and especially under 3.00% would send us sharply lower. We continue to be with the potential descending triangle as a topping pattern, but won’t rule out an upside breakout.
Source: www.stockcharts.com
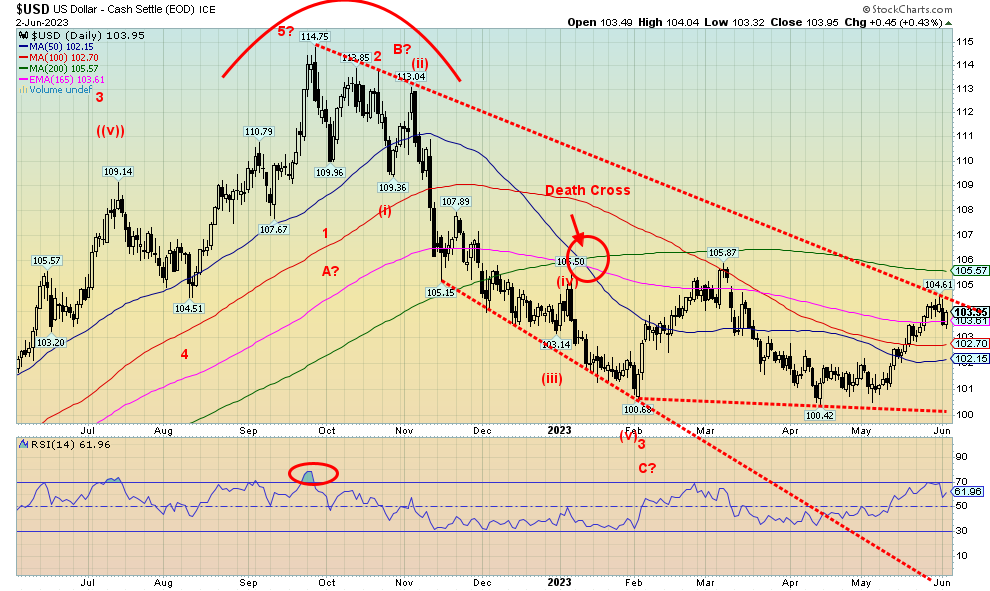
The US$ Index hit a high of 104.61 this past week as it appeared to break out and then fell back. It rebounded on Friday after the stronger than expected job numbers. So, our rebound rally may not be over just yet. The 200-day MA near 105.60 could still beckon. The wave pattern still appears to us as a five-wave decline from the September 2022 top at 114.75 and we are now on the C wave of an ABC correction to that decline. We can’t confirm whether last week’s high at 104.61 is it for the wave. Only a move back under 102 could suggest the top is in. The final breakdown is near 100 but we are not expecting that anytime soon. Passing the debt limit suspension was quite helpful and the strong job numbers also helped. Still, the US$ Index lost 0.2% this past week. The euro also fell, losing 0.2%, the Swiss franc dropped 0.4%, but it was the pound sterling that helped push the US$ Index as it gained 0.8%. The Japanese yen was up 0.4% while the Canadian dollar soared up 1.4%. Ultimately, we are bearish on the US$ Index, but the pattern suggests that we may not yet be over this upward correction. Under 102 would tell us it is over.
Source: www.stockcharts.com
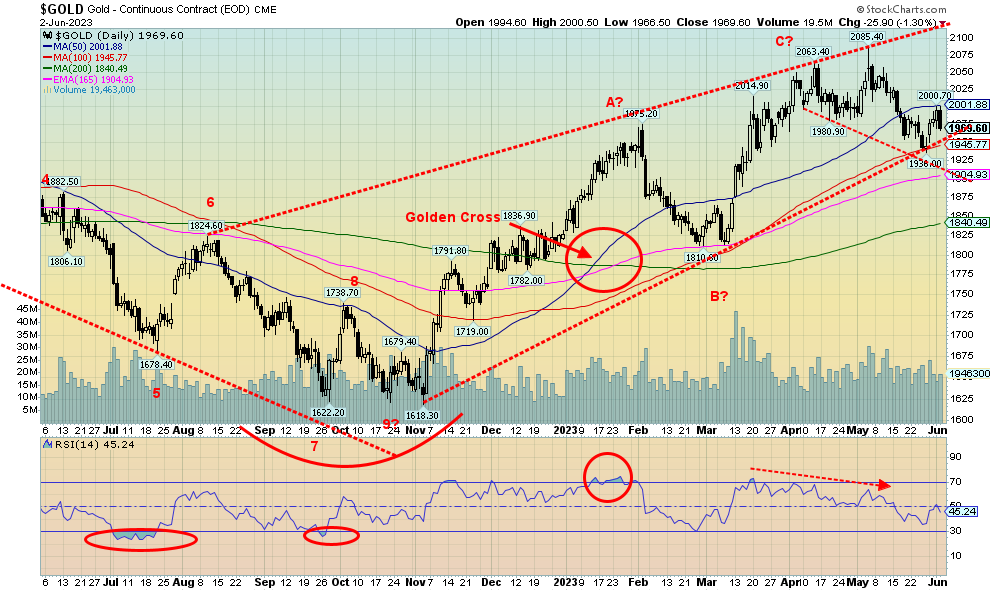
Gold broke a three-week downtrend and started to rally this past week, thanks to the US agreeing to a suspension of the debt limit. But then Friday’s strong job numbers spoiled the party, bringing back thoughts that the Fed might hike interest rates at the June 13–14 FOMC. Gold gained 1.3% this past week, but it would have been better if gold hadn’t fallen 1.3% on Friday following the job numbers. Silver was up 1.7% on the week while the gold stocks also rallied, with the Gold Bugs Index (HUI) up 2.5% and the TSX Gold Index (TGD) up 1.2%. But platinum didn’t fare well and fell 2.4%. A bad omen? Palladium fell 1.6% but copper jumped 1.4%, possibly buoyed by the job numbers.
There are a huge number of letter writers out there who are predicting the next big move in gold—that it will be explosive, the greatest bull market ever. Maybe selling gold letters is getting harder. But the market action works against them. It remains quite probable that we could embark on a big upmarket for gold, but as we have noted many times, we need to find our 7.83-year cycle low and our 23.5-year cycle low first. We are in the period but we have no confirmation that the low is in.
We have continually noted the divergence between gold and silver, with gold making new highs but silver nowhere near its highs. Gold could take out $2,100, but unless we are confirmed elsewhere it could be a false breakout. We came close with a recent high at $2,085, but even that fell just short of the August 2020 high of
$2,089. And while silver has not confirmed gold, the gold stocks as represented by the HUI and TGD have not confirmed as well. While gold is off only about 6% from its all-time high, silver is off 52% from its 2011 high. The gold stocks are just as bad as the HUI is down almost 62% from its all-time high and the TGD down 35%. The TGD is a star by comparison. Recent COTs show that the commercials are covering their shorts but that could continue for more than a few weeks before we see any upward move. There was no COT this week because of the Memorial Day holiday. The CFTC will release the COT on Monday.
The FOMC meets on June 13–14 for its interest rate decision. A pause could be positive for gold, but we’d need to see gold take out $2,000 and preferably $2,025 to confirm to us that a low is in. Above $2,050 new highs become probable.
Gold responds positively to lower interest rates, financial crisis, war, and loss of confidence in government. The debt limit suspension was positive for gold, but the strong job numbers on Friday sent gold down as fear of higher interest rates once again dominated. We seem to remain in what appears as some sort of broadening pattern. The current low end of the channel is down near $1,900. The 200-day MA is further away at $1,840. All could be targets.
On the bright side, we are up almost 22% from that November 2022 low. That’s the good news. The bad news is that the up move looks increasingly like an ABC corrective pattern and not the start of a new bull market. We are, we suspect, still looking for that 7.83-year and 23.5-year cycle low. It could happen in June/July, typically a period when gold does see lows. Otherwise, we could follow a bounce out of a potential June/July low and head to new lows into December which would be a more ideal time frame for major cycle lows. Meanwhile, the gold bugs keep screaming gold is going to the moon. Hope they are still solvent when the low is in.
Source: www.stockcharts.com
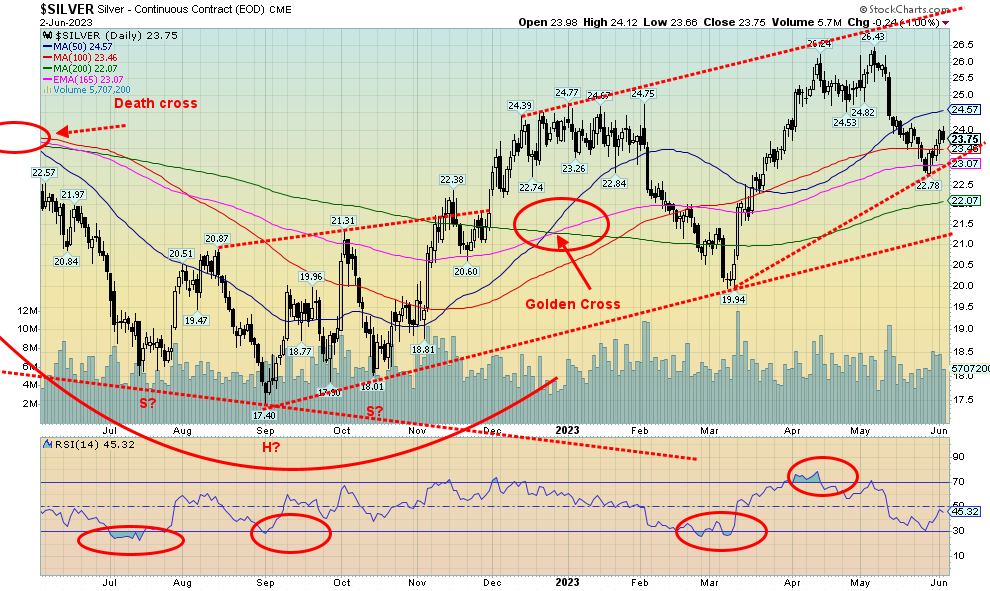
Silver’s three-week downswing ended this past week with a 1.7% gain. We briefly tried to pop over $24, but it failed to hold and we closed at $23.75. Friday’s wipeout saw silver lose 1.0%, thanks to the strong jobs report. Silver found support near the 165-day EMA and the 100-day MA. The 200-day MA is below near $22. The 50-day MA lies above at $24.60. We need to break that and preferably over $25 to suggest to us that a low is in. Above $25.60 new highs above $26.43 is probable.
Unfortunately, that pattern from the low in September at $17.40 appears to have unfolded as a large ABC corrective. What that suggests is a five-wave decline to new lows. Probably this current up move then is a countermove. If we start to move down again and break the low of $22.78, we are headed to $22 and possibly to that gentler uptrend line near $21. As with gold, we look for a potential low in silver in the June/July period. Volume so far on the up move is not overly strong.
As with gold, the COT is to be released Monday because of this past week’s Memorial Day holiday.
Source: www.stockcharts.com
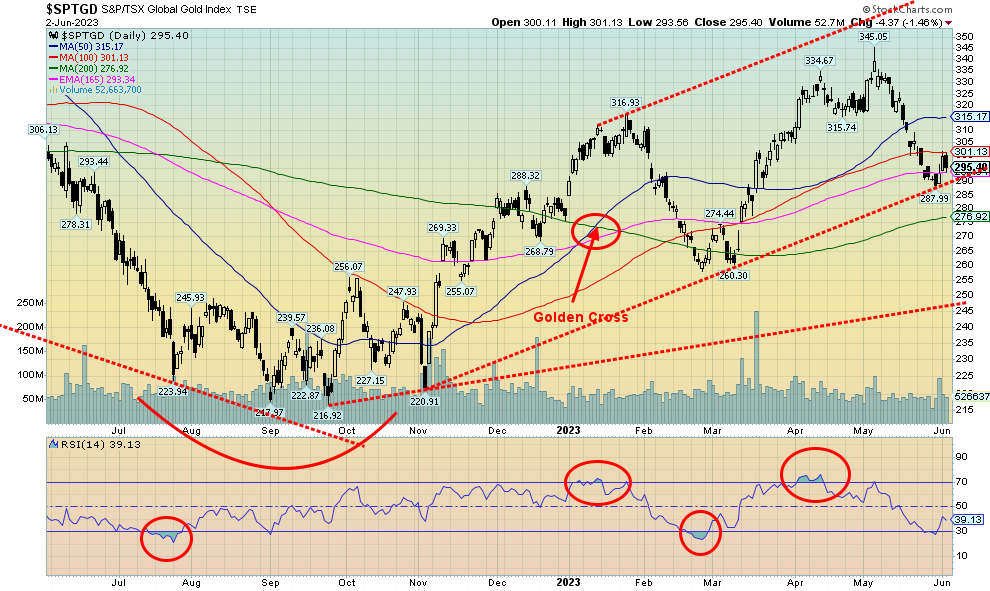
After falling sharply during the past three weeks, the gold stocks finally put in a positive week. The TSX Gold Index (TGD) was up 1.2% this past week while the Gold Bugs Index (HUI) jumped 2.5%. Friday’s job numbers spoiled the party as what would have been a much better gain turned sour as the TGD fell 1.5%. Still, a gain is a gain. Unfortunately, we did not take out any key points to suggest to us that a low is in. We need to see the TGD above 310 preferably above 315 to tell us that a low is in. That continues to leave us vulnerable to the downside. A break under 290 would be negative and could easily send us to 275. We did get slightly oversold at the low this past week with an RSI that dipped briefly under 30. So, it is very possible we could see further downward pressure this coming week and break under 290. We could say that the move from the September low at 217 to the recent high at 345 went up in five waves. This then might only be the first wave down of a corrective before we can resume the rally. We’ve noted the potential for gold/silver to bottom in the June/July period. The gold stocks would follow. If we broke that March low at 260, we’ll know we are in a more serious correction. But a correction nonetheless, not the start of a major bear market.
Source: www.stockcharts.com
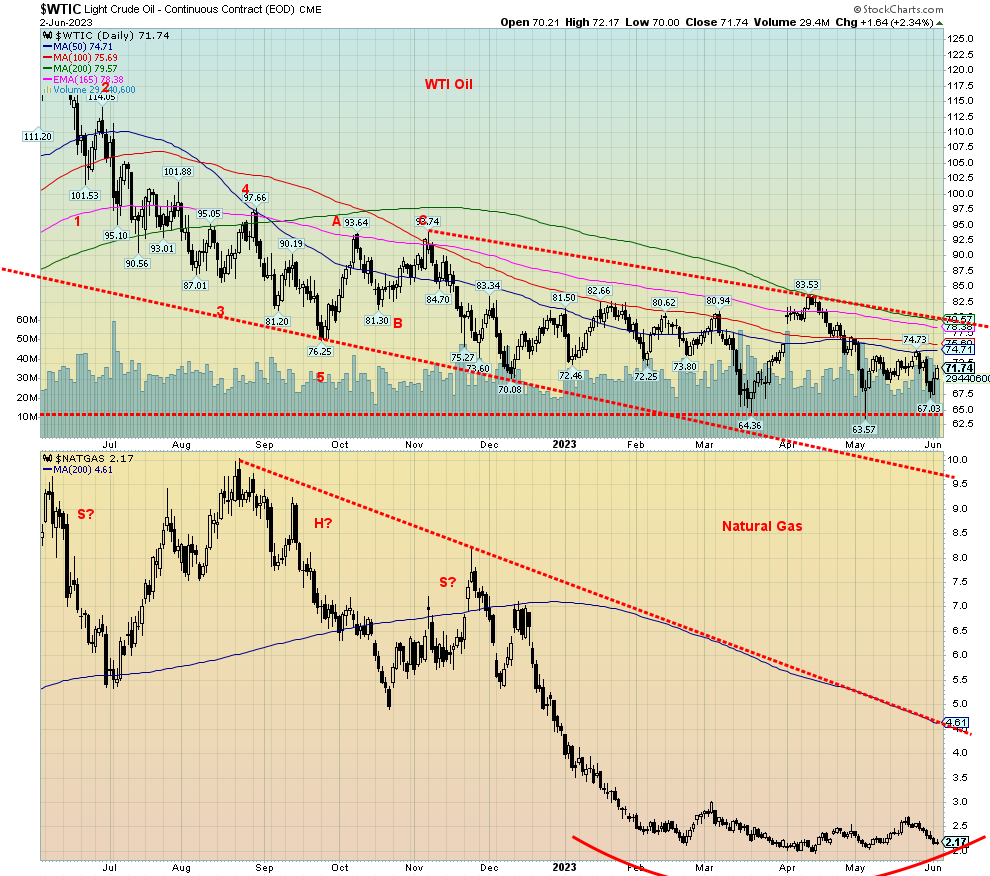
The Scoop will be coming out as the OPEC meetings get underway on June 4. At this point, it is uncertain as to what they might do. Further cuts to help raise the price of oil? That’s very possible, despite some disagreement about Russia doing a little boost. But the lifting or, actually, suspension of the debt ceiling has helped buoy the market. Then came the job numbers that were beyond expectations, causing the market to heave a sigh of relief and rise again. At least that helped bring Brent crude back over $75 and WTI over $71. But let’s not kid ourselves. This past week still saw WTI falling 1.3%, Brent down 2.4%, Henry Hub natural gas (NG) off 10.3%,
and the Dutch Hub NG down 3.4%. The Dutch Hub NG is back where it was in 2021.
For WTI we really need to break over $80, preferably over $82.50 to confirm a low. For NG, $3 remains our breakout point. NG continues to make a considerable rounding bottom. Its time will come, but we can’t say when.
As the technical divergences grow, it is a question of when not if we make an upward break for both oil and gas. The energy stocks have, in many ways, not followed the commodity into the hole. The ARCA Oil & Gas Index (XOI) gained 0.7% this past while the TSX Energy Index (TEN) was up 0.5%. Not a lot, but then they both recovered from being down on the week on Friday, thanks to those job numbers. Jobs are all that matter. The rising unemployment rate and all the other things happening are just background noise.
If there is one thing that concerns us for a sustained rally, it’s that the favourable seasonals are ending. NG’s strong season is February to June while oil’s strong seasonals are December to July. That doesn’t mean we won’t burst higher into July, but we’d be going against the seasonals. Unless something happens. The EU is preparing more sanctions on Russia and as, we have noted, ultimately sanctions don’t work except to raise prices. And there are many ways around sanctions, given that a major portion of the world is not a party to the sanctions against Russia. It is no surprise that Russia has actually increased exports despite sanctions with China and other Asian countries taking up the slack from what they lost to the EU. Surprisingly, however, Russia is still sending energy (oil and gas) to Germany and Italy amongst others.
NG might need some more time before it breaks to the upside. For oil, we need to see some upward follow-through this coming week. Getting above $75 will be the first hurdle. Over $80 will be the second one.
Copyright David Chapman 2023
|
GLOSSARY Trends Daily – Short-term trend (For swing traders) Weekly – Intermediate-term trend (For long-term trend followers) Monthly – Long-term secular trend (For long-term trend followers) Up – The trend is up. Down – The trend is down Neutral – Indicators are mostly neutral. A trend change might be in the offing. Weak – The trend is still up or down but it is weakening. It is also a sign that the trend might change. Topping – Indicators are suggesting that while the trend remains up there are considerable signs that suggest that the market is topping. Bottoming – Indicators are suggesting that while the trend is down there are considerable signs that suggest that the market is bottoming. |
Disclaimer
David Chapman is not a registered advisory service and is not an exempt market dealer (EMD) nor a licensed financial advisor. He does not and cannot give individualised market advice. David Chapman has worked in the financial industry for over 40 years including large financial corporations, banks, and investment dealers. The information in this newsletter is intended only for informational and educational purposes. It should not be construed as an offer, a solicitation of an offer or sale of any security. Every effort is made to provide accurate and complete information. However, we cannot guarantee that there will be no errors. We make no claims, promises or guarantees about the accuracy, completeness, or adequacy of the contents of this commentary and expressly disclaim liability for errors and omissions in the contents of this commentary. David Chapman will always use his best efforts to ensure the accuracy and timeliness of all information. The reader assumes all risk when trading in securities and David Chapman advises consulting a licensed professional financial advisor or portfolio manager such as Enriched Investing Incorporated before proceeding with any trade or idea presented in this newsletter. David Chapman may own shares in companies mentioned in this newsletter. Before making an investment, prospective investors should review each security’s offering documents which summarize the objectives, fees, expenses and associated risks. David Chapman shares his ideas and opinions for informational and educational purposes only and expects the reader to perform due diligence before considering a position in any security. That includes consulting with your own licensed professional financial advisor such as Enriched Investing Incorporated. Performance is not guaranteed, values change frequently, and past performance may not be repeated.
About the author


Website: https://www.enrichedinvesting.com
Disclaimer: David Chapman is not a registered advisory service and is not an exempt market dealer (EMD) nor a licensed financial advisor. We do not and cannot give individualised market advice. David Chapman has worked in the financial industry for over 40 years including large financial corporations, banks, and investment dealers. The information in this newsletter is intended only for informational and educational purposes. It should not be considered a solicitation of an offer or sale of any security. The reader assumes all risk when trading in securities and David Chapman advises consulting a licensed professional financial advisor before proceeding with any trade or idea presented in this newsletter. David Chapman may own shares in companies mentioned in this newsletter. We share our ideas and opinions for informational and educational purposes only and expect the reader to perform due diligence before considering a position in any security. That includes consulting with your own licensed professional financial advisor.