
The story of the week was the collision with the Francis Scott Key Bridge in Baltimore. What is the impact? Disrupted supply chains are already stressed thanks to droughts in the Panama Canal and war in the Red Sea/Suez Canal. Could things get even worse?
Wildfire season is threatening to start earlier and many are having difficulty obtaining insurance for both fires and floods. Extreme weather events are destined to get worse. The wars continue and also threaten to deepen. Geopolitical concerns are rising and domestic politics is extremely divisive.
Agriculture indices are poised to break out. Gold is making new all-time highs. But so are the markets even as some indices continue to diverge with each other. Even the TSX Composite made small new all-time highs this past week. Gold and equities are the subject of our chart of the week as signs continue to form that gold should outperform equities going forward. Lundin Gold Inc., for example, increased mineral reserves, generates strong free cash flow, pays a dividend, and is held in the Enriched Capital Conservative Growth Strategy.* The commodity super cycle appears to be alive and well and we note that as we review past cycles. We note that since 1770 seven have occurred. We appear to be working on the eighth.
Inflation is still alive as well as PCE prices demonstrated this past week. With a continued strong labour market interest rates are liable to remain high for longer than many currently expect even as many continue to believe rates will be cut by June.
Spring is in the air even if it remains cool and talk of a snowstorm is still around. Have a great week.
DC
* Reference to the Enriched Capital Conservative Growth Strategy and its investments, celebrating a 6-year history of strong growth, is added by Margaret Samuel, President, CEO and Portfolio Manager of Enriched Investing Incorporated, who can be reached at 416-203-3028 or msamuel@enrichedinvesting.com
“The investor is bombarded with staggering amounts of information, staggering amounts of stimuli that are designed to get the investor to buy and sell and trade, to do exactly the wrong thing, to create excessive profits for these intermediaries that aren’t acting in the investor’s best interests.”
—David Swenson, American investor, endowment fund manager, philanthropist, chief investment officer Yale University 1985–2021; 1954–2021
“Over the very long run, it is the economics of investing—enterprise—that has determined total return; the evanescent emotions of investing—speculation—so important over the short, have ultimately proven to be virtually meaningless.”
—John Bogle, American investor, business magnate, philanthropist, founder and CEO Vanguard Group and helped establish the index fund; 1929–2019
“I believe denying clients the ability to be hyper-traders is doing them a favour. Most people are not adept enough to take advantage of short-term mis-valuations, and I put myself in that category.”
—Howard Marks, American investor, writer, co-founder and co-chairman of Oaktree Capital Management, largest investor of distressed securities; b. 1946
Global supply chains just got a little tighter. While the collapse of the Francis Scott Key Bridge over the Patapsco River in Baltimore was a tragedy because of the deaths of at least six people, it could also cause some economic problems, particularly supply-chain disruptions. The Port of Baltimore is the U.S.’s 17th largest and 5th largest on the U.S. East Coast, handling some 52.3 million tonnes of goods valued at over $81 billion ($59 billion in imports and $22 billion in exports) in 2023. It also creates 15,000 jobs. Commuters will be severely disrupted for months, if not years, because a new bridge will have to be built at an estimated cost of at least $400 million and, by some estimates, upwards of $2 billion.
The Baltimore port was a major exporter of coal in the U.S. and there were exports of more than 750,000 cars in 2022. It will also trigger some $3–4 billion in insurance claims, making it the largest marine disaster claim ever. Coal supplies can be made up elsewhere, but that port would lose the revenue the exports generated. The handling of goods from Baltimore can also be done elsewhere, but that causes huge logistical problems in rerouting the container ships and the volumes at other ports. Some container ships and others are still stuck inside while others are stuck outside.
While disruption of the Baltimore port is significant, it is not expected to be big enough to drag the economy down. However, the supply chain woes it triggers just adds to the woes already being experienced by the drought in the Panama Canal and ongoing war with the Houthis of Yemen that has severely disrupted traffic through the Red Sea and Suez Canal. Much of the traffic has been rerouted around the Cape of Good Hope at the cost of considerably extra time and money. Some ships that normally go through the Panama Canal are also being rerouted around the Cape of Good Hope. Add in sanctions, which is a form of trade war, and some propensity for higher tariffs and we have a recipe for potentially significant disruption of the global economy.
World trade growth has been slowing for years and has particularly slowed since the pandemic. Trade agreements have been falling while trade restrictions have been growing. The World Bank has warned that
“Policy makers impeding cross-border trade are shooting themselves in the foot”. The world Bank has also warned that “Today, misguided populism in many countries is doing serious damage to global trade. Many countries have lost their appetite for new trade agreements.”
All of this adds to inflation woes, which could keep inflation higher for longer and delay any rate cuts. It’s bad enough that droughts and extreme weather are playing havoc in agricultural zones. Adding to the woes, farmers are finding it increasingly difficult to obtain insurance, or the cost is becoming prohibitive. Claims have been increasing every year. Statistics Canada reported that crop insurance gross payments were $890 million in 2018, $3.8 billion in 2021, and $4.9 billion in 2022. Drought was the primary cause. Losses were experienced for Saskatchewan provincial crop insurers, totaling some $3.9 billion in 2021. Multiply that through other crop- growing provinces and U.S. states. Extreme weather events are putting many insurers on the brink of bankruptcy and many are finding that they can no longer obtain flood or fire insurance, depending on where they live.
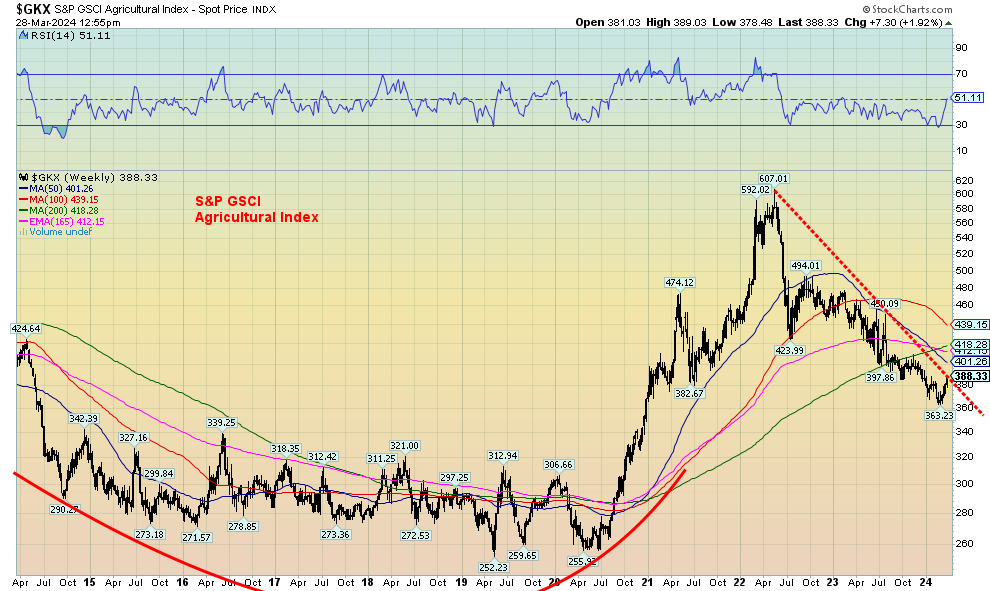
Source: www.stockcharts.com
One would think that with all these woes the S&P GSCI Agricultural Index would be higher. Agricultural prices soared following the pandemic of 2020, leaping over 200% into 2022. Extreme weather events, droughts, inflation, supply chain disruptions, rising costs, and the Russia/Ukraine war all played a role. Oddly enough, it
was improved yields that led to higher supply through 2022/2023, lowering prices. But that slumber may be about to end as the index appears poised to break that downtrend line from the early 2022 top.
The S&P GSCI Agricultural Index is a sub-index of the S&P GSCI Index. Its components include grains such as wheat, soybeans, and corn, livestock such as hogs and cattle, and softs such as cocoa, coffee, sugar, and cotton. The broader S&P GSCI Commodity Index is not dissimilar to the Commodity Research Bureau (CRB) Index as it also contains energy and metals, both industrial and precious along with agriculture.
All this is a part of what some call the commodity super cycle.
Commodity Prices 1770–2013
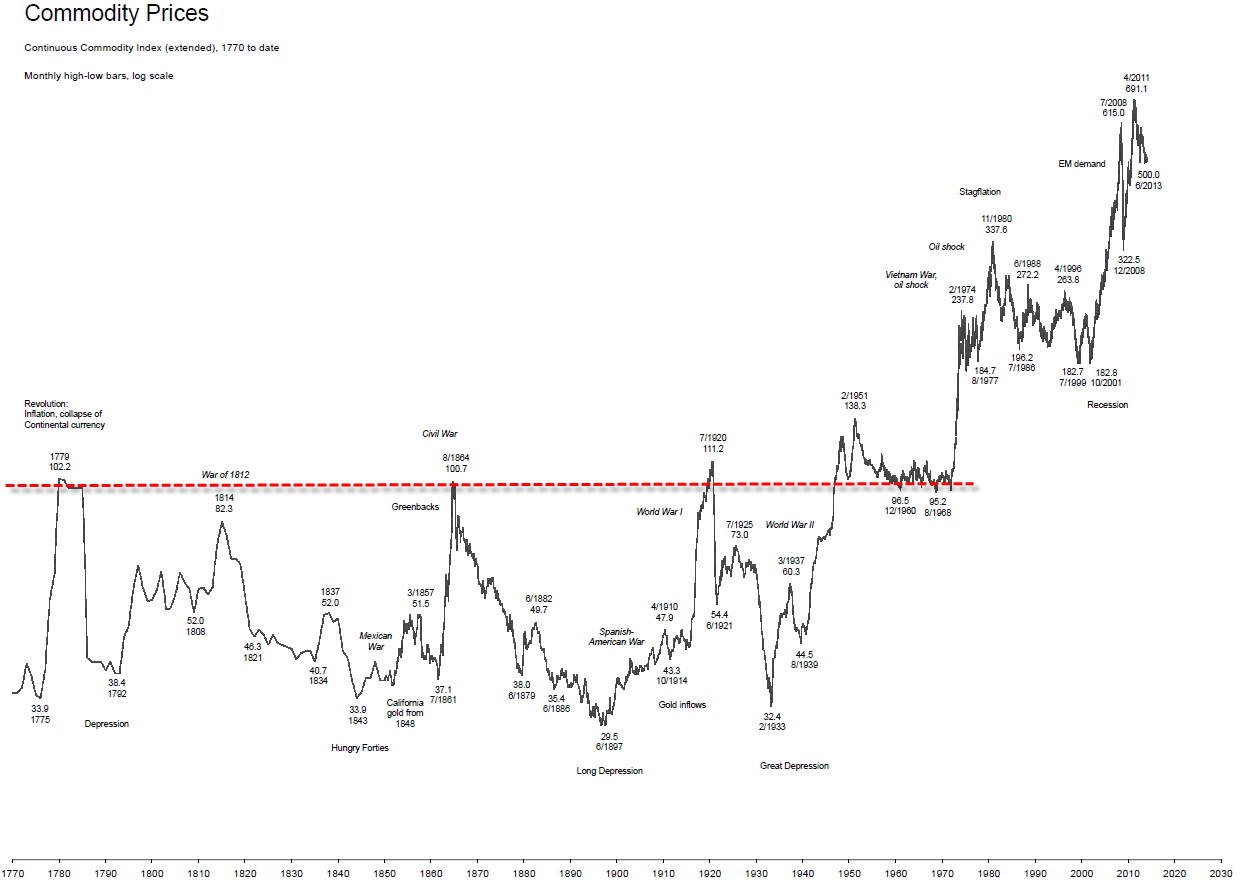
Source: www.goldchartsrus.com
The long-term chart above shows commodity prices from 1770 onwards. This chart only goes to 2013. After peaking last in 2011, commodity prices were on a long nine-year decline, bottoming in 2020 with the pandemic. The first phase of the rebound topped in May 2022. Following this corrective period we now appear poised to begin a new phase to the upside as a number of commodities have been rising of late, including oil, gold, uranium, and copper. We expect to see new highs on this phase that should take us above the May 2022 peak.
Commodity Super Cycles
|
Commodity Super Cycle |
Gain % Trough to Peak |
Peak to Peak (years) |
Trough to Trough (years) |
What Happened |
|
1775–1779 |
301% |
|
|
American Revolution, Seven Years’ War |
|
1792–1814 |
214% |
35 |
17 |
War of 1812–1814, Napoleonic Wars |
|
1861–1864 |
271% |
50 |
51 |
U.S. Civil War |
|
1897–1920 |
377% |
56 |
54 |
World War I |
|
1933–1951 |
427% |
31 |
36 |
Great Depression, World War II |
|
1968–1980 |
355% |
29 |
35 |
Vietnam War, Oil shock |
|
2001–2011 |
378% |
31 |
33 |
Emerging market demand, War on Terror |
|
2020–? |
? |
? |
19 |
Russia/Ukraine war, Israel/Hamas war, pandemic |
|
Average |
332% |
39 |
41 |
|
Source: www.goldchartsrus.com
Our table seems to indicate that there is a peak in commodity prices roughly every 39 years. The trough is similar, but appears to occur every 41 years. It can vary, as we can see, as peaks ranged from 29 years to 56 years and troughs from 17 years to 54 years. One common element was that wars were usually associated with the rise in commodity prices. That should come as no surprise as wars followed by reconstruction help push up demand for many commodities.
Wars are also disruptive to supply chains. Add in things like a pandemic, oil shocks, and more and the conditions are very good for a rise in commodity prices. Gold is merely a hedge against geopolitical tensions. Note that gold rose to record peaks in 1980 and 2011 both times coinciding with a commodity super cycle. While gold was fixed during the period of the Great Depression and World War II, gold stocks rose sharply to record prices during the period. Gold prices also surged higher during the War of 1812–1814 and the Napoleonic Wars as well as during the U.S. Civil War, despite being fixed during those periods. There was only a small rise to the fixed price during World War 1 before it settled back after the war.
Nonetheless, war is a common theme during the all the commodity super cycles. Today we have the threat that the wars could expand and we have supply disruptions. And a collision with a bridge just made the supply disruptions a bit worse. Inflation is not likely to come down much more than it has and could even start to rise again. Gold is currently rising on the threat of war according to economist Martin Armstrong of Armstrong Economics. What if the wars currently between Russia/Ukraine and Israel/Hamas expanded to include more players? Both appear to be headed in the direction. And ultimately that is good for gold as faith in fiat currencies falls.
Chart of the Week
Dow/Gold Ratio
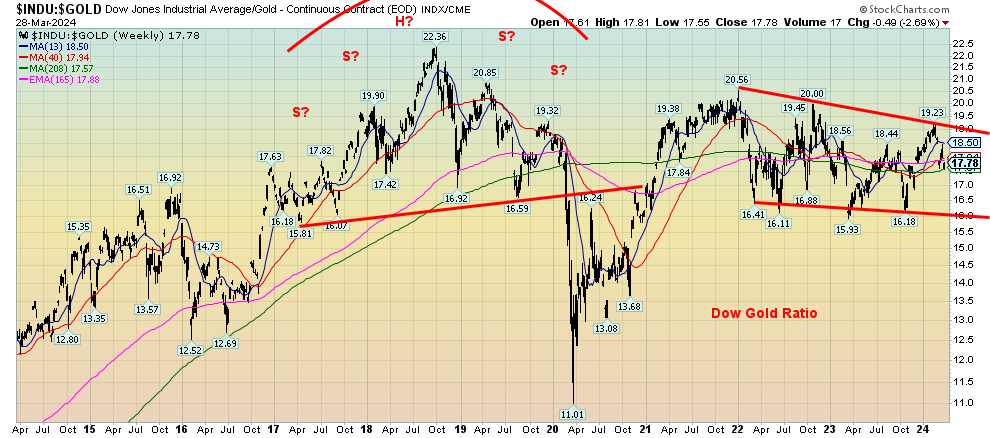
Source: www.stockcharts.com
There is a slow shift going on in markets. That shift is out of equities and into commodities. No, it is not as yet very visible; however, the above chart of the Dow Jones Industrials (Dow)/Gold ratio is emblematic of that shift. The peak was seen in October 2018 at 22.36. It was during this period the Dow/Gold ratio took on the look of a large head and shoulders pattern. It proved prescient and, during the pandemic crash of March 2020 when equities plunged, gold also fell but at a much slower rate. The Dow/Gold ratio bottomed at 11.01.
After that the ratio rose once again in favour of equities as the Magnificent Seven rally got underway. It was during this period that the Dow/Gold ratio diverged from the S&P 500 (SPX)/Gold ratio and the NASDAQ/Gold ratio. Both the SPX and NASDAQ to gold ratios made their peak in late 2021 while the Dow/Gold ratio was making a lower high below the peak of 2018. Nonetheless, the pattern for the Dow/Gold ratio shows the ratio is slowly rolling over, making a series of lower highs. That should favour gold over the Dow going forward. As we noted, it is not as pronounced with the SPX/Gold ratio or the NASDAQ/Gold ratio, but they too are rolling over. What we don’t have at this time is a firm sell signal for the ratio.
An initial sell signal for the ratio would come under 17.6, but a firm sell signal would come only when the down channel is broken under 16.0. Both the SPX/Gold ratio and the NASDAQ/Gold ratio are bit further away from giving us firm sell signals. However, recently, both have made lower highs than those seen in late 2021, even as the stock markets and gold both hit new all-time highs.
SPX/CRB Ratio
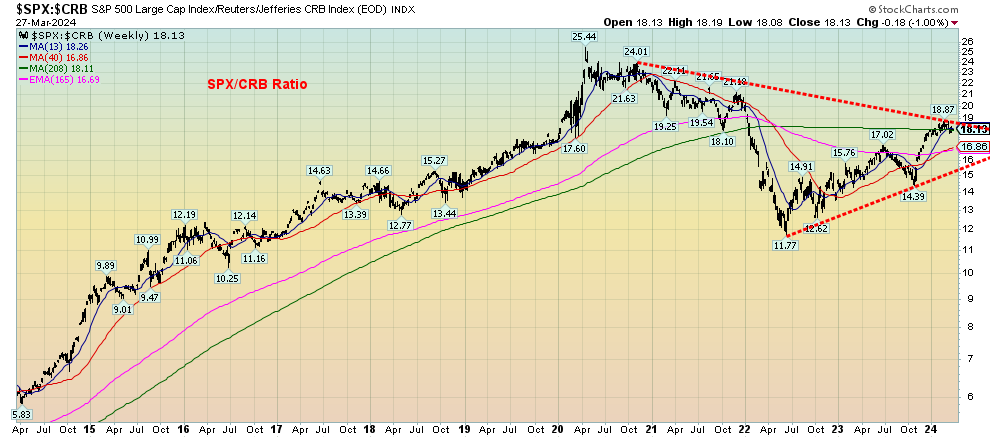
Source: www.stockcharts.com
Another way of looking at all this is the S&P 500 (SPX)/Commodity Research Bureau (CRB) ratio. Are commodities poised to outperform equities? Once again, this ratio suggests they should. The ratio peaked in early 2020 with the stock market high. An important bottom was seen in 2022 as the CRB rallied or at least fell at a slower rate during a period that SPX and equities fell. Since then, the ratio has been recovering in favour of equities. But have they now run into sharp resistance at the four-year MA? The ratio is making a lower high even as the S&P 500 has been making new all-time highs. A large symmetrical triangle appears to be forming. The triangle is currently testing the 4-year MA. But we’d need a firm break above 19/20 to suggest we’re going higher. A breakdown under 15 would start a downtrend.
The equities market has been dominated by Magnificent Seven and the big tech stocks. See the reaction to the introduction of Donald Trump’s media & technology company (DJT) that surged 59% on opening to over $8 billion, making it instantly one of the largest companies in the world. Commodity areas have seen only modest investment. An article in The Globe and Mail Report on Business (March 27, 2012), entitled “Commodities comeback is good news for Canadian investors” by Tim Shufelt, noted that 3% of S&P 500 investors have their funds in energy while only 2% are in materials (https://www.theglobeandmail.com/investing/markets/inside-the-market/article-commodity-prices-investing/ ).
The gold market is quite small. Gold itself has a nominal value of roughly $15 trillion, representing only about 3% of global assets. The entire gold stock market could be gobbled up by someone like Apple and there’d be change left over. They could also gobble up most of the materials market where the largest company is Linde PLC, a large global chemicals company out of Germany but based in the U.K. With a market cap of roughly $224 billion, it pales in comparison to Apple at $2.7 trillion. (Note: Microsoft is currently the largest company with a market cap of $3.1 trillion.) The largest gold mining company is Newmont with a market cap of $40 billion.
The result of all this is that a small shift out of the broader market into the resource-based commodities market could have a profound impact on the price of numerous stocks. The market is just too small comparatively. We have constantly noted how cheap gold mining companies are relative to gold. It’s a situation that is overdue to change.
Markets & Trends
|
|
|
|
% Gains (Losses) Trends
|
|
||||
|
|
Close Dec 31/23 |
Close Mar 29, 2024 |
Week |
YTD |
Daily (Short Term) |
Weekly (Intermediate) |
Monthly (Long Term) |
|
|
Stock Market Indices |
|
|
|
|
|
|
|
|
|
S&P 500 |
4,769.83 |
5,254.35 (new highs)* |
0.4% |
10.2% |
up |
up |
up |
|
|
Dow Jones Industrials |
37,689.54 |
39,807.37 |
0.8% |
5.6% |
up |
up |
up |
|
|
Dow Jones Transport |
15,898.85 |
16,211.62 |
1.3% |
2.0% |
up |
up |
up |
|
|
NASDAQ |
15,011.35 |
16,379.46 |
(0.3)% |
9.1% |
up |
up |
up |
|
|
S&P/TSX Composite |
20,958.54 |
22,167.03 (new highs)* |
0.8% |
5.8% |
up |
up |
up |
|
|
S&P/TSX Venture (CDNX) |
552.90 |
563.39 |
2.0% |
1.9% |
up |
neutral |
down |
|
|
S&P 600 (small) |
1,318.26 |
1,344.66 (new highs)* |
2.5% |
2.0% |
up |
up |
up |
|
|
MSCI World |
2,260.96 |
2,370.92 |
(0.1)% |
4.9% |
up |
up |
up |
|
|
Bitcoin |
41,987.29 |
70,816.05 |
11.3% |
68.7% |
up |
up |
up |
|
|
|
|
|
|
|
|
|
|
|
|
Gold Mining Stock Indices |
|
|
|
|
|
|
|
|
|
Gold Bugs Index (HUI) |
243.31 |
247.21 |
7.2% |
1.6% |
up |
up |
down (weak) |
|
|
TSX Gold Index (TGD) |
284.56 |
290.46 |
5.8% |
2.1% |
up |
up |
down (weak) |
|
|
|
|
|
|
|
|
|
|
|
|
% |
|
|
|
|
|
|
|
|
|
U.S. 10-Year Treasury Bond yield |
3.87% |
4.21% |
0.2% |
8.8% |
|
|
|
|
|
Cdn. 10-Year Bond CGB yield |
3.11% |
3.49% |
0.6% |
12.2% |
|
|
|
|
|
Recession Watch Spreads |
|
|
|
|
|
|
|
|
|
U.S. 2-year 10-year Treasury spread |
(0.38)% |
(0.42)% |
2.3% |
(10.5)% |
|
|
|
|
|
Cdn 2-year 10-year CGB spread |
(0.78)% |
(0.65)% |
3.0% |
16.7% |
|
|
|
|
|
|
|
|
|
|
|
|
|
|
|
Currencies |
|
|
|
|
|
|
|
|
|
US$ Index |
101.03 |
104. |
0.1% |
3.5 |
up |
up (weak) |
up (weak) |
|
|
Canadian $ |
75.60 |
73.90 |
(0.1)% |
(2.3)% |
down |
down (weak) |
down |
|
|
Euro |
110.36 |
107.91 |
(0.2)% |
(2.2)% |
down (weak) |
neutral |
neutral |
|
|
Swiss Franc |
118.84 |
110.89 |
(0.6)% |
(6.7)% |
down |
down |
up |
|
|
British Pound |
127.31 |
126.24 |
0.2% |
(0.8)% |
down (weak) |
neutral |
neutral |
|
|
Japanese Yen |
70.91 |
66.06 |
flat |
(6.8)% |
down |
down |
down |
|
|
|
|
|
|
|
|
|
|
|
|
|
|
|
|
|
|
|
|
|
|
Precious Metals |
|
|
|
|
|
|
|
|
|
Gold |
2,071.80 |
2,238.40 (new highs)* |
3.6% |
8.0% |
up |
up |
up |
|
|
Silver |
24.09 |
24.92 |
0.3% |
3.5% |
up |
up |
up (weak) |
|
|
Platinum |
1,023.20 |
921.10 |
2.5% |
(10.0)% |
up (weak) |
down (weak) |
down |
|
|
|
|
|
|
|
|
|
|
|
|
Base Metals |
|
|
|
|
|
|
|
|
|
Palladium |
1,140.20 |
1,021.50 |
2.3% |
(10.4)% |
up |
down (weak) |
down |
|
|
Copper |
3.89 |
4.01 |
flat |
3.0% |
up |
up |
neutral |
|
|
|
|
|
|
|
|
|
|
|
|
Energy |
|
|
|
|
|
|
|
|
|
WTI Oil |
71.70 |
83.17 |
3.2% |
15.9% |
up |
up (weak) |
neutral |
|
|
Nat Gas |
2.56 |
1.76 |
(2.8)% |
(31.3)% |
down (weak) |
down |
down |
|
Source: www.stockcharts.com
Note: For an explanation of the trends, see the glossary at the end of this article.
New highs/lows refer to new 52-week highs/lows and, in some cases, all-time highs.
- * New All-Time Highs
Source: www.stockcharts.com
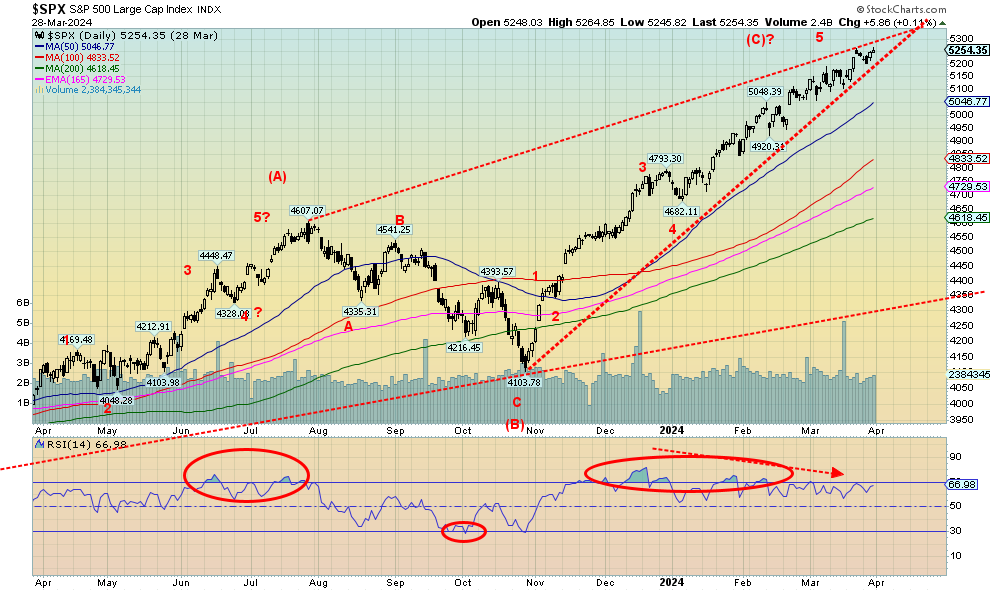
Things seem to be running out of steam. Yes, we had another up week and, yes, the S&P 500 (SPX) put in another all-time high. Some others joined the SPX, notably the Value Line, NYSE, AMEX, Dow Jones Composite (DJC), the S&P 400 (Mid), the Russell 1000 and 3000, and the Wilshire 5000; however, neither the Dow Jones Industrials (DJI), the NASDAQ, the NASDAQ 100, nor the S&P 100 (OEX) made all-time highs. As usual of late, the Dow Jones Transportations (DJT) was nowhere near all-time highs as the DJT continues to diverge sharply with the DJI.
The market hasn’t cracked yet. But that ascending triangle formed by the SPX is getting tighter and tighter and the odds favour a break of some sort, soon. Yes, it could just waffle through, but the odds favour a strong break. Below 5,200 we get our first break, under 5,100 we get our second break, and under 4,900 it’s all over.
On the week, the SPX gained 0.4%, the DJI was up 0.8%, the DJT gained 1.3%, while the NASDAQ actually fell, down 0.3%. The NASDAQ fell, thanks to the NY FANG Index which dropped 2.0%. The S&P 400 (Mid) gained 1.8% to new 52-week highs while the S&P 600 (Small) was up 2.4%, also to 52-week highs. The S&P 500 Equal Weight Index rose 1.6% and, yes, it made new all-time highs. Bitcoin rebounded but failed (so far) to reach new all-time highs, up 11.3%, and closing over $70,000.
In Canada, the TSX Composite made all-time highs (barely), up about 0.8%, while the TSX Venture Exchange (CDNX) was up 2.0%. In the EU, the London FTSE made all-time highs, up 0.5%, the EuroNext made all-time highs, up 0.7%, while both the Paris CAC 40 and the German DAX also made all-time highs, up 0.7% and 1.6% respectively.
In Asia, China’s Shanghai Index (SSEC) was down 1.2% as real estate woes continue, the Tokyo Nikkei Dow (TKN) lost 1.5%, while Hong Kong’s Hang Seng (HSI) eked out a gain of 0.3%. The MSCI World Index was down a small 0.1%.
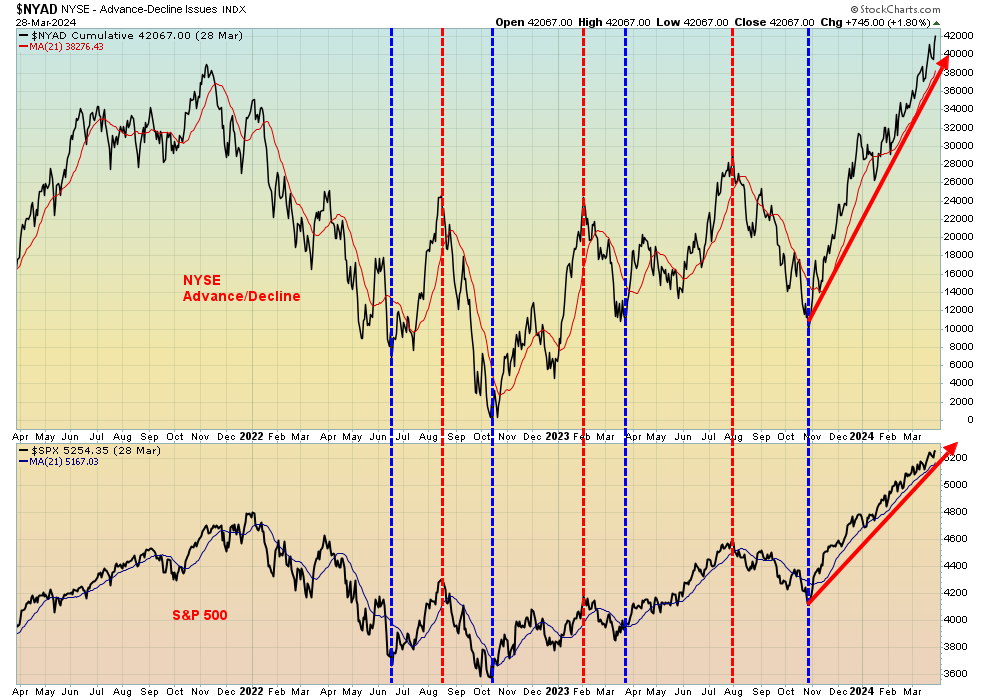
If there is a problem with this market, which is at record highs and appears poised for further gains, it is that breadth indicators are mostly positive. The NYSE advance/decline line has been making new highs with the indices, and the percentage of stocks trading above both their 50-day and 200-day MAs remains high at 85% with only small divergences so far. New highs vs. new lows remain well in favour of new highs. The S&P Bullish Percent Index is at 74.4% high but not super-extreme. Sentiment indicators remain bullish while the CBOE put/call ratio is at 56, which is bullish but not super-bullish. Breadth indicators do not appear to be a problem. The VIX Volatility Index has remained of late at levels associated with market complacency.
Source: www.stockcharts.com
All this suggests that the indices are poised for further gains, even as they make less and less sense at these levels. The Shiller PE Ratio remains very high at 35.14 while the S&P 500 PE ratio is at 28.5, also high. Earnings yield is 3.5%. Price to book and price to sales ratios are also high historically. So, the warnings are there, but is anyone paying attention or do they care?
Source: www.stockcharts.com
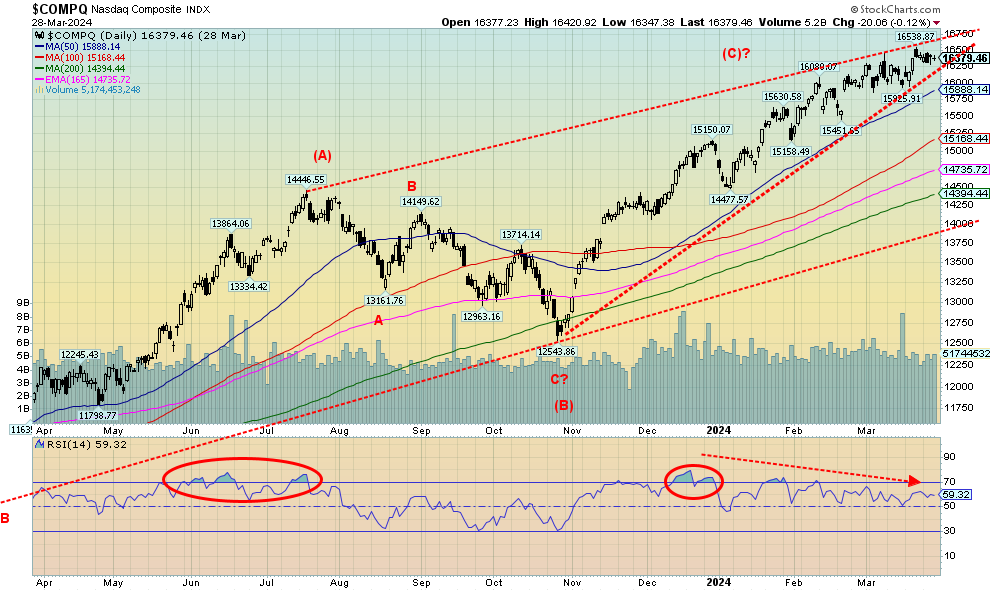
Unlike the other indices, the NASDAQ did not post a gain this past week, losing 0.3%. It did not make a new all-time high, either. It’s no surprise who dragged it down as the NY FANG Index fell 2.0%, led by a 4.2% decline in Nvidia. Are the days of the Magnificent Seven over? Meta fell 4.7%, Netflix lost 3.3%, and even Microsoft fell 1.9%. If it was any consolation, Tesla jumped 2.9%. Of the seven, four were in the red. What’s left now for the NASDAQ is to break down under that sharply rising trend line from what appears to be a huge ascending wedge triangle. Right now, that’s around 16,200. A break under the 50-day MA near 15,900 would most likely seal the deal. That triangle is getting narrower and narrower and it’s either going to waffle its way through or it will crack. The odds of an upside break appear slim.
Source: www.stockcharts.com
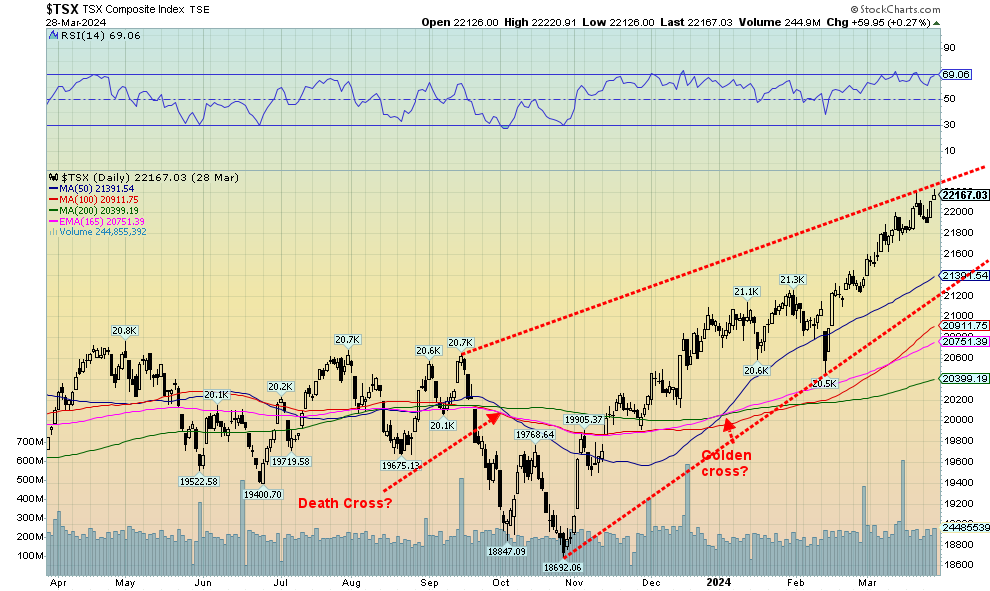
Once again, the TSX put in record highs this past week, thanks to gains in materials and energy. Of the 14 sub-indices, there were 10 gainers and four losers. New all-time highs were seen for Energy (TEN) that gained 2.7% on the week and Financials (TFS) that was up 0.8%. Health Care (THC) made 52-week highs with a gain of 4.0%. Other big gainers were Golds (TGD), up 5.8%, Metals & Mining (TGM), up 3.4%, and Materials (TMT), up 4.8%. Leading the losers was Information Technology (TTK), off 1.5%. Interestingly, the TSX Composite made very slight new all-time highs but the TSX 60 failed. A divergence? The TSX continues to rise in what we see as an ascending wedge triangle. Ultimately, these patterns are bearish. The rise has been steeper since that low back in February. It is a matter of when, not if, the index will fall. A break of 21,800 would be negative, but we really need to get back under 21,200 to bust the pattern. It could then suggest a decline back towards the October 2023 low of 18,700. The RSI is at 69, not quite overbought but nonetheless high. Energy and Materials (Gold, Metals) remain the best choices of where to be.
U.S. 10-year Treasury Note, Canada 10-year bond CGB
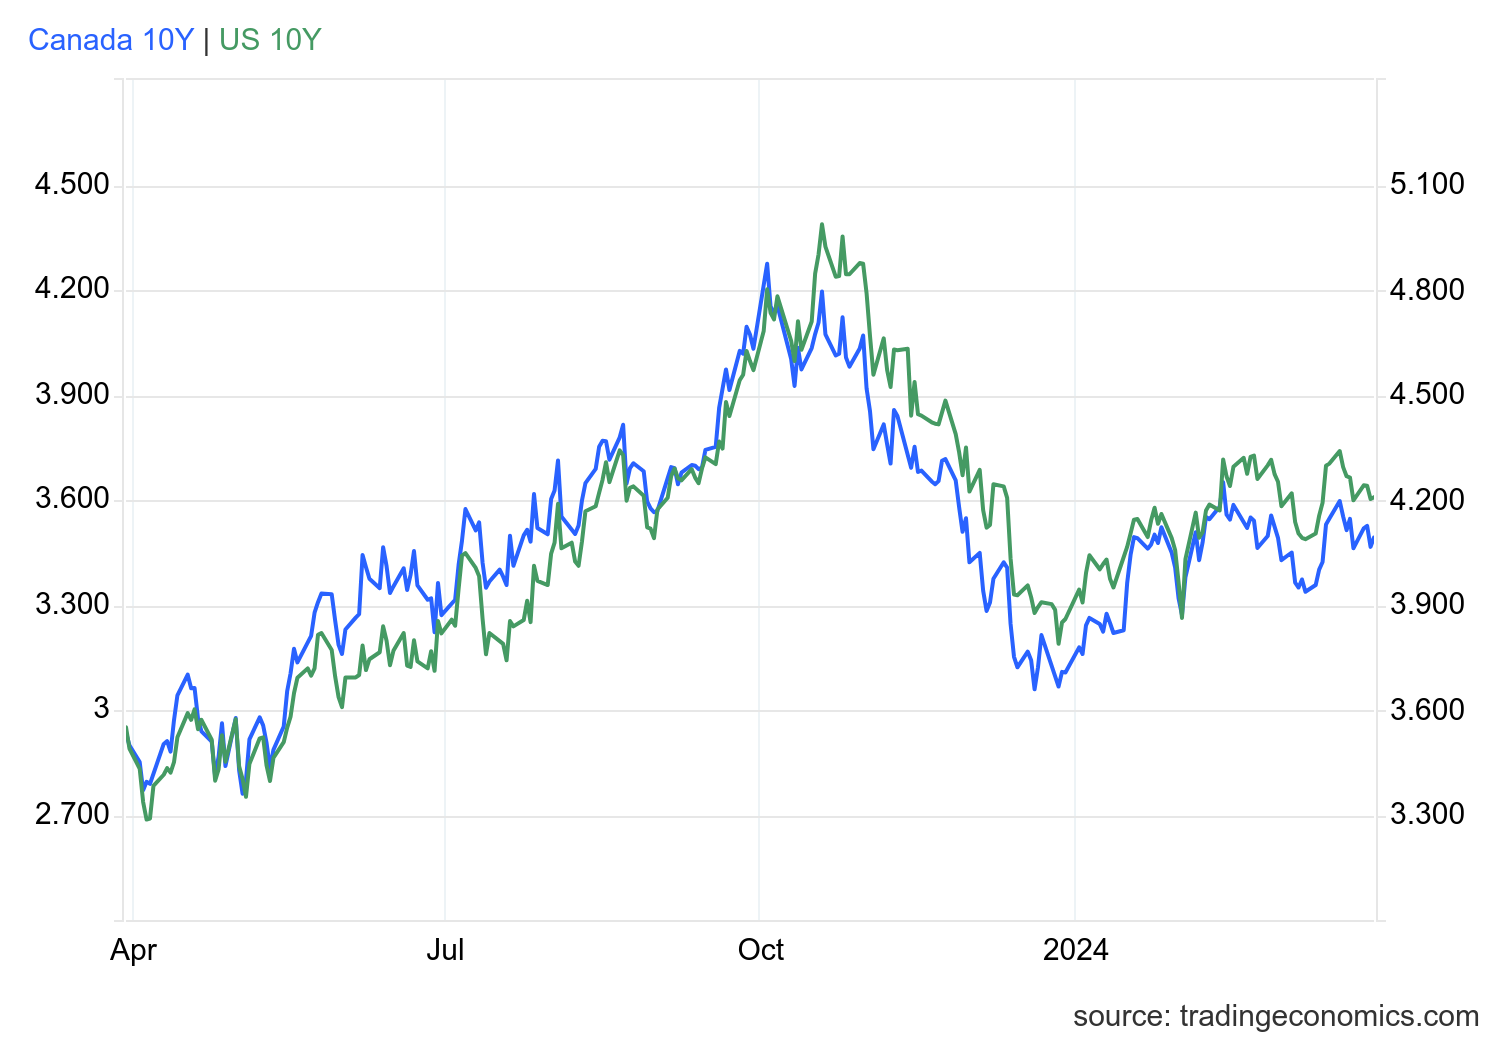
Source: www.tradingeconomics.com, www.home.treasury.gov, www.bankofcanada.ca
We sorted out Trading Economics’ new presentation of charts. So it’s back to Canada and the U.S. 10-year on the same chart. This past week the U.S. 10-year treasury note traded pretty steadily, closing at 4.21% vs. 4.20% the previous week. Mixed signals on the economy and from Fed officials kept the rate steady. They revised Q4 GDP growth to 3.4% from 3.2% and initial claims came in at 210,000 this past week when they expected 215,000. For the previous week it was 212,000. Fed officials seemed to indicate that they are in no rush to cut rates. So the economy is still growing and the labour market remains tight, suggesting to the Fed that there is little need to cut rates. The 2–10 spread was negative 42 bp vs. negative 43 bp the previous week. In Canada, the Government of Canada 10-year bond (CGB) rose slightly to 3.49% from 3.47%. Here too Canada’s GDP came in better than expected with January revised up to a gain of 0.6% vs. a decline of 0.1% in December. The preliminary GDP for February showed a gain of 0.4%, lower than the previous preliminary gain of 0.6% but well above expectations of a gain of 0.1%. This should keep the BofC from rushing to cut rates as well. We review PCE prices next, followed by a graph of GDP growth in both Canada and the U.S.
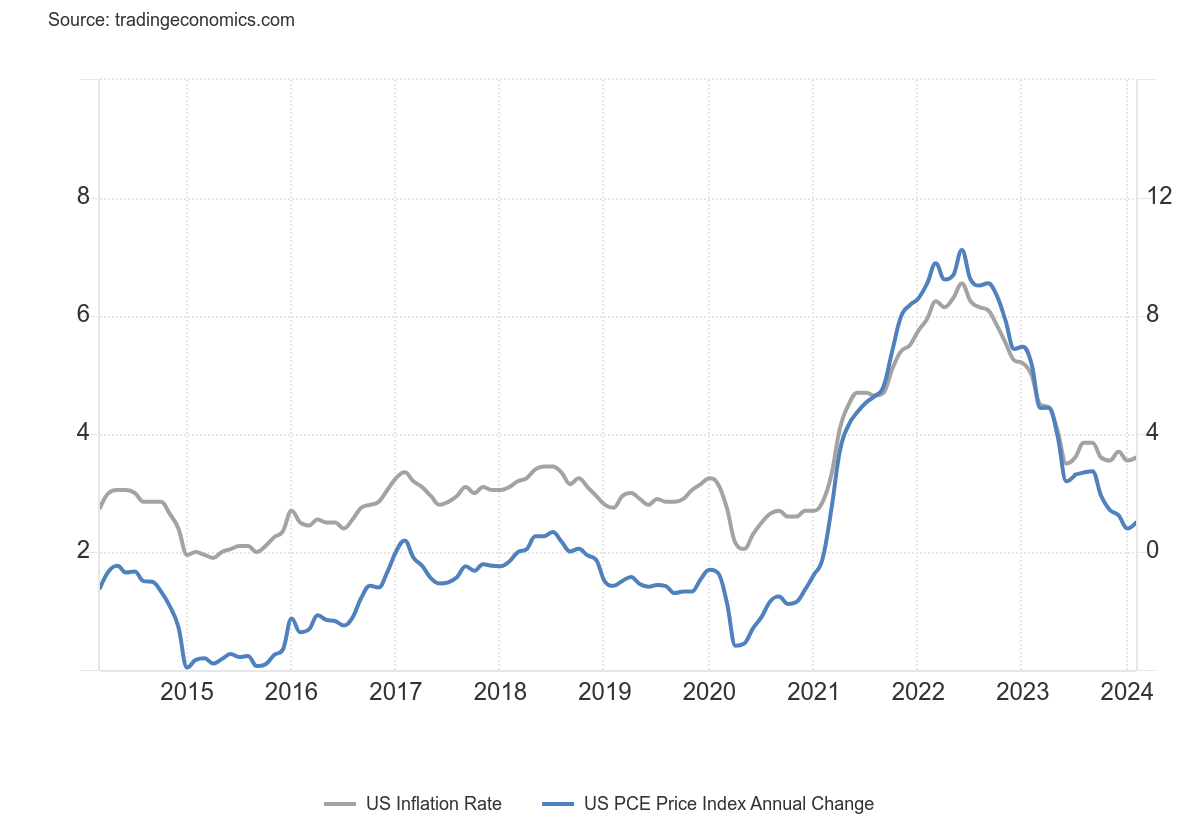
U.S. PCE Prices, CPI 2014–2024
Source: www.tradingeconomics.com, www.bls.gov, www.bea.gov
Personal consumption expenditures prices rose 0.3% in February and were up 2.5% year over year (y-o-y). The monthly rise was marginally below expectations but the y-o-y rise exceeded expectations. The core PCE rate (ex-food and energy) was up 0.3% vs. a gain of 0.5% in January. The core PCE is one the Fed follows the most closely. The core PCE y-o-y was 2.8% vs. 2.9% the previous month. The core PCE rate has been steadily falling since peaking at 6.6% in September 2022. The chart above compares the CPI with PCE prices.
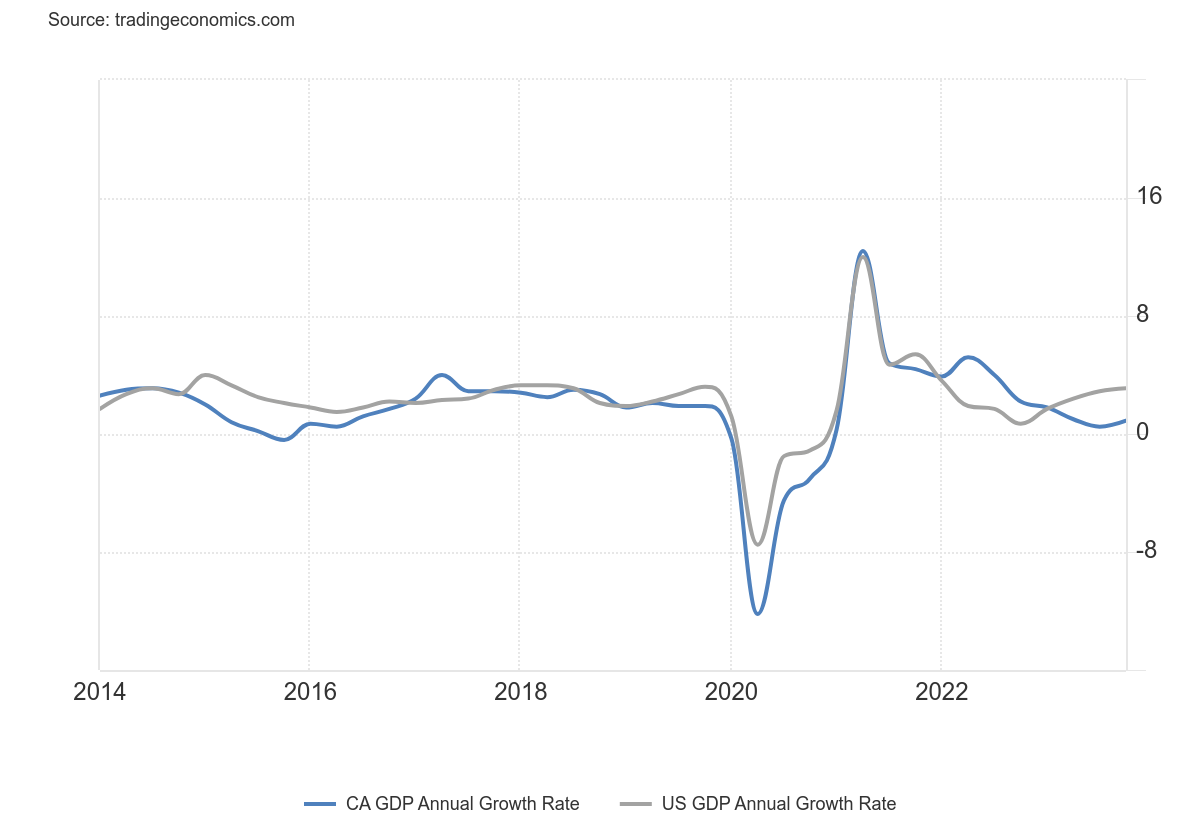
Next is a chart of GDP growth for both Canada and the U.S. While the U.S. is outpacing Canada what is noticeable is that GDP has been rising not falling as many expected. This alone could keep the pressure on higher interest rates for longer.
Canada and U.S. Annual Growth Rate Q4 2014–2024
Source: www.tradingeconomics.com, www.statcan.gc.ca, www.bea.gov
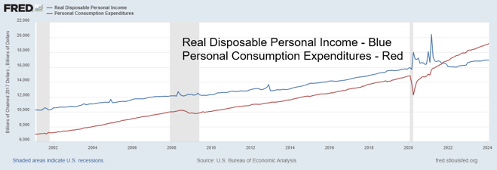
Real Disposable Personal Income, Personal Consumption Expenditures – 2000–2024
Source: www.stlouisfed.org
Are consumers spending more than they are earning? That would appear to be the case. Personal income for February 2024 rose 0.3%, generally in line with expectations but below last month’s rise of 1.0%. Personal spending jumped 0.8%, way above the expected rise of 0.3% and last month’s 0.2%. The personal income rise in January was actually a departure from what was normally reported. Here we chart real personal disposable income vs. personal consumption expenditures and what we discovered is expenditures have been exceeding income since 2021. Before that, income was consistently higher than expenditures. Consumers, it seems, are increasingly going into debt to maintain their lifestyle, a situation that can’t continue. Given Canada’s record household debt to income, which is one of the highest in the world, we suspect it is the same situation.
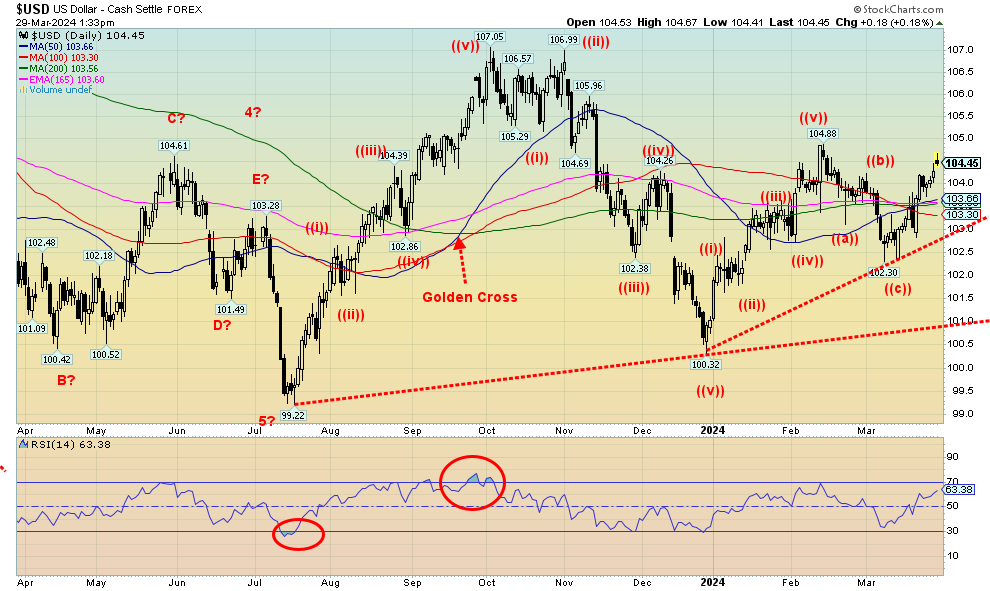
Source: www.stockcharts.com
Is the US$ Index going to go higher despite gold also going higher? That’s inconclusive, but Friday saw the US$ Index jump, even as gold soared to new all-time highs. The action of the US$ Index on Friday suggests that it should take out the recent high of 104.88. Or the index is possibly forming a double top, giving us a classic flat ABC-type correction to the downswing from 107.05 in September 2023 to 100.32 in late December 2023. Taking out 105 might suggest higher levels yet for the US$ Index. Continued decent U.S. economic numbers or higher inflation should help the US$ Index reach higher levels.
For the most part, the currency markets were pretty quiet this past week. The US$ Index gained 0.1%, the Cdn$ fell 0.1% and the euro was off just under 0.2%; however, the Swiss franc continued to weaken, falling 0.6%. The pound sterling was the only one up on the week, gaining 0.2%, while the Japanese yen was flat on the week.
This week could tell if we are going to fail or break to new highs.
Source: www.stockcharts.com
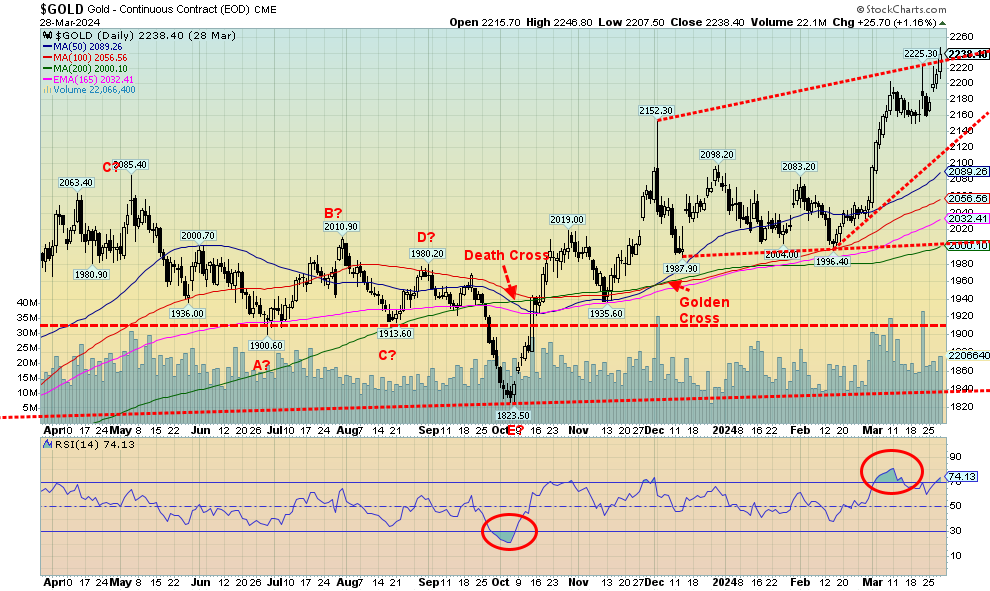
Gold bugs were ecstatic as gold prices leaped to new all-times once again, closing the week firmly over $2,200. The catalyst was, as usual, geopolitical concerns as gold becomes a safe haven. As well, there remain expectations that the Fed will cut rates as early as June. Gold not only made fresh all-time highs in U.S. dollars but also made new all-time highs in Cdn$, euros, Swiss francs, Japanese yen, and pound sterling in addition to numerous other currencies. Gold’s 3.6% gain on the week helped silver, even though it only gained 0.3%, platinum that gained 2.5%, and the near precious metals that saw palladium up 2.3% although copper pulled back a tad, off about 0.1%.
The gold stocks enjoyed a good up week with the Gold Bugs Index (HUI) up 7.2% and the TSX Gold Index (TGD) gaining 5.8%. A good week for the gold bugs, but one hopes they don’t become ecstatic too soon as, with both silver and gold stocks lagging gold, it is not yet time to celebrate. But, as we noted earlier, the gold market is quite small in comparison to the broader stock market, so a small allocation of funds into the gold market can move gold, silver, and the gold stocks up swiftly. Many others including cryptos, meme stocks, the Magnificent Seven, and more have enjoyed their day in the limelight, but gold and the gold stocks have been largely ignored as their performance lagged everyone. Gold? Considered by many as a barbarous “relic”, even though it has been around as money and currency for upwards of 5,000 years. It’s been only 53 years since the end of the last gold standard. All previous experiments in fiat currencies eventually failed. One can print an endless amount of paper dollars, but gold is limited. No wonder $1,000 today only buys about 0.5 ounces of gold, whereas just 53 years ago $1,000 could buy almost 29 ounces of gold. That’s devaluation of the fiat currency. As we’ve shown, as debt and money supply rise, gold rises as well. It is not so much gold going up but currencies going down.
With the now record run to close at $2,238 this past week, support can be seen down to around $2,160. Below that a fall to $2,100 is possible. Ultimate support is now at $2,000. We may have seen that level for some time. Gold is once again becoming a bit overbought but, given the current head of steam, we could soon see $2,300. A firm break through $2,300 could send gold to its next targets up around $2,500. The drivers as usual will be geopolitical concerns, falling confidence in government, debt growth, and fears we could fall into a recession. Now, if only silver and the gold stocks would catch up.
Source: www.stockcharts.com
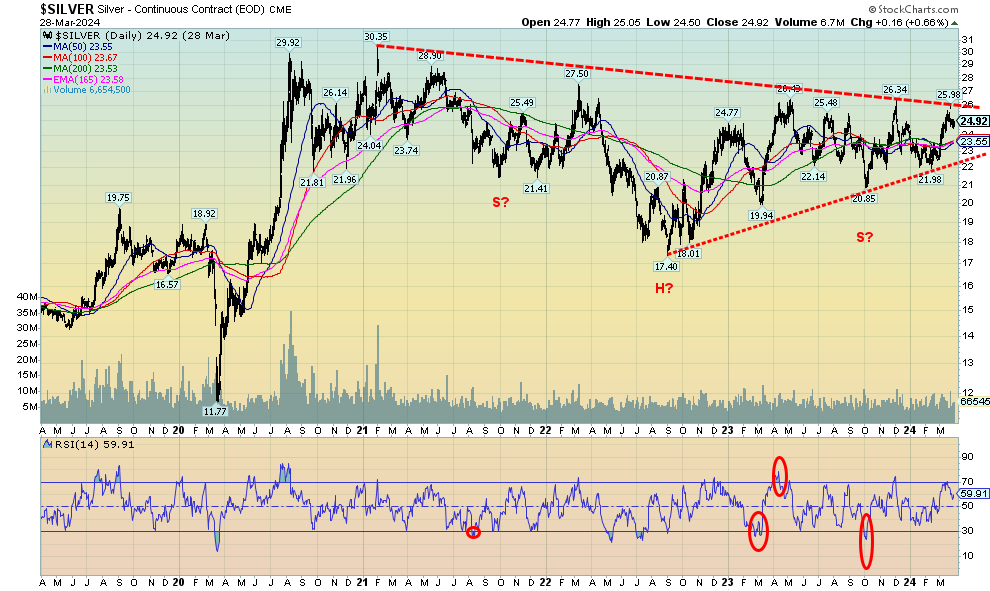
While all of the attention is focused on the record-breaking gold prices, we remain concerned about lagging silver. Yes, silver gained 0.3% this past week and is now up 3.5% on the year, but it continues to lag sorely behind gold, which was up 3.6% this past week and up 3.5% on the year. What’s worse, gold is making record prices and silver is nowhere near its all-time highs seen near $50 in 1980 and 2011. It is a divergence that has concerned us for some time. While conventional wisdom has both gold and silver going higher, one always wonders if silver is the right one and if so, it’s pointed down, not up. However, silver has been making what appears to us as a potentially massive head and shoulders reversal pattern over the past three years or so. We just need it to bust up through the potential neckline near $26 and then take out that high of $27.50 seen back in 2022. If we do, targets may be up to $38/$40. Patience is a virtue, they say, but silver fans have been patient for too long and are due for their ray of sunshine that has so far only blessed gold. Naturally, we wouldn’t want to see a pullback that takes out that last important low at $21.98. We doubt that would happen, but a break would reward our patience. Maybe this week? Silver stocks enjoyed a good up week.
Source: www.stockcharts.com
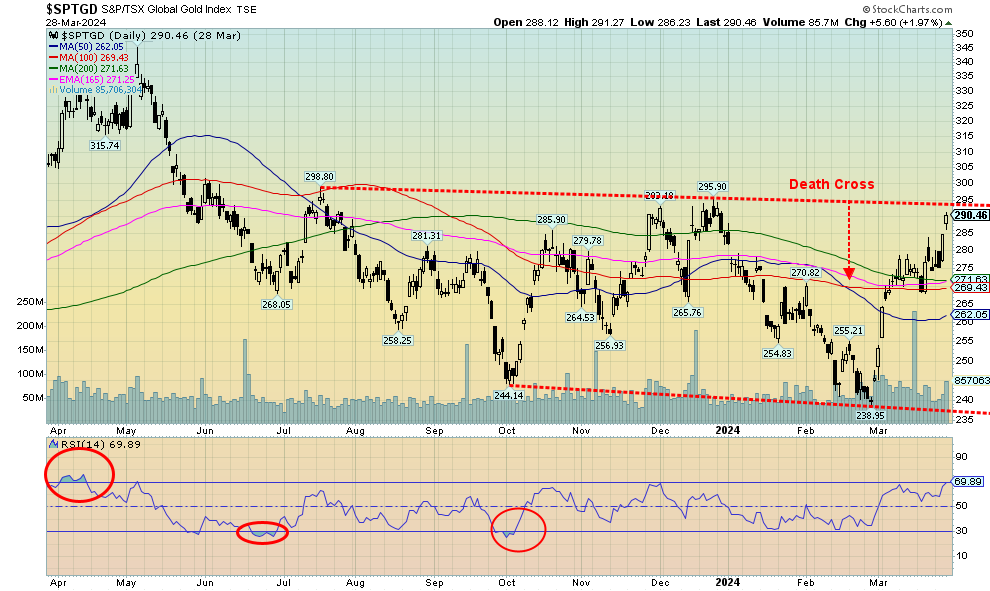
Thanks to record gold prices, the gold stock indices enjoyed a strong up week. The TSX Gold Index (TGD) gained 5.8% while the Gold Bugs Index (HUI) jumped 7.2%. Even some junior gold stocks jumped this past week but, overall, they remain well behind and undervalued. While the Gold/HUI ratio improved in favour of the HUI, the reality is that the gold stocks in general remain grossly undervalued. They still have not broken out although, as the chart notes, TGD is getting close to breaking over 295/300. Once firmly over (close basis and preferably as well over 310) potential targets are up to 350/355 and new highs over the May 2023 high. For comparison, the HUI needs to break out over 255 and has potential targets up to 310/315. That would still be short of the May 2023 high.
For the short term, the gold stock indices are approaching overbought. However, that is a condition that can remain in a strong market. The market has swiftly recovered with the TGD up 21% since that low in late February. Both the TGD and the HUI are now up on the year by 2.1% and 1.6% respectively. All is not lost for the gold bugs. The Gold Miners Bullish Percent Index (BPGDM) is up to 46.4 so it still has good room to move higher. Over 75 is getting into overbought range, but in a strong bull we could even make it to a 100.
The TGD chart looks positive, but a close over 295/300 would help convince us that we could be breaking out and on a good upward run. It’s a small market so it doesn’t take much of a shift to make the market rise quickly.
XAU/Gold Ratio
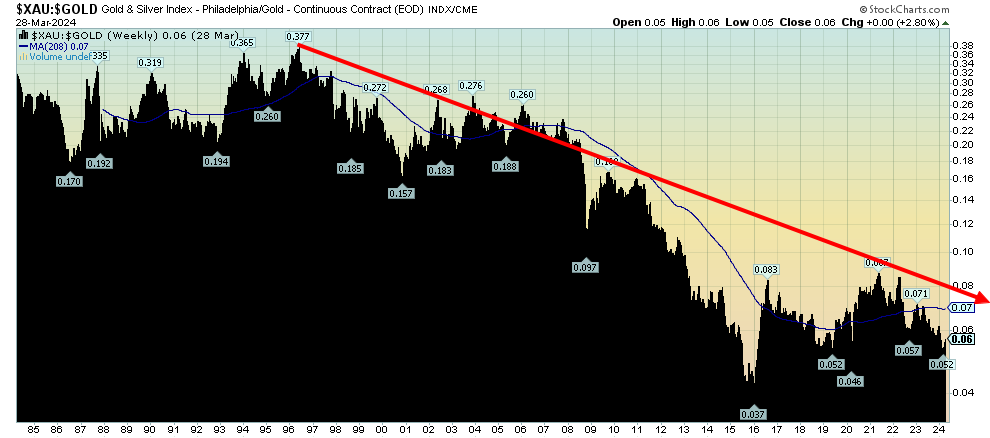
Source: www.stockcharts.com
Here’s another way of looking at how cheap gold stocks are vs. gold. Normally we look at the Gold/HUI ratio, a ratio that has shown that gold stocks are cheap vs. gold. This one is the Philadelphia Gold & Silver Index (XAU) to Gold Ratio. It has been in a steady downtrend since the mid-nineties. The worst was in 2015, when gold prices fell from a record high of $1,923 in 2011 to their nadir in December 2015 at $1,045, a decline of about 46%. The gold stocks were destroyed. The XAU fell about 84%. Arguably, the gold stocks vs. gold have been forming a bottom pattern. However, that is not as yet realized. Otavio Costa, an analyst at Crescat Capital, recently noted it is a shunned industry. Nobody is clamouring these days to become a geologist. Companies struggle to raise money. It is an industry that is mining and looking for limited product; however, it is product that is needed in industry. If so, buying into the industry is an opportunity. A breakout over 0.08 might start things percolating. It’s been down too long—and it’s a long way back to that 1995 high of 0.377.
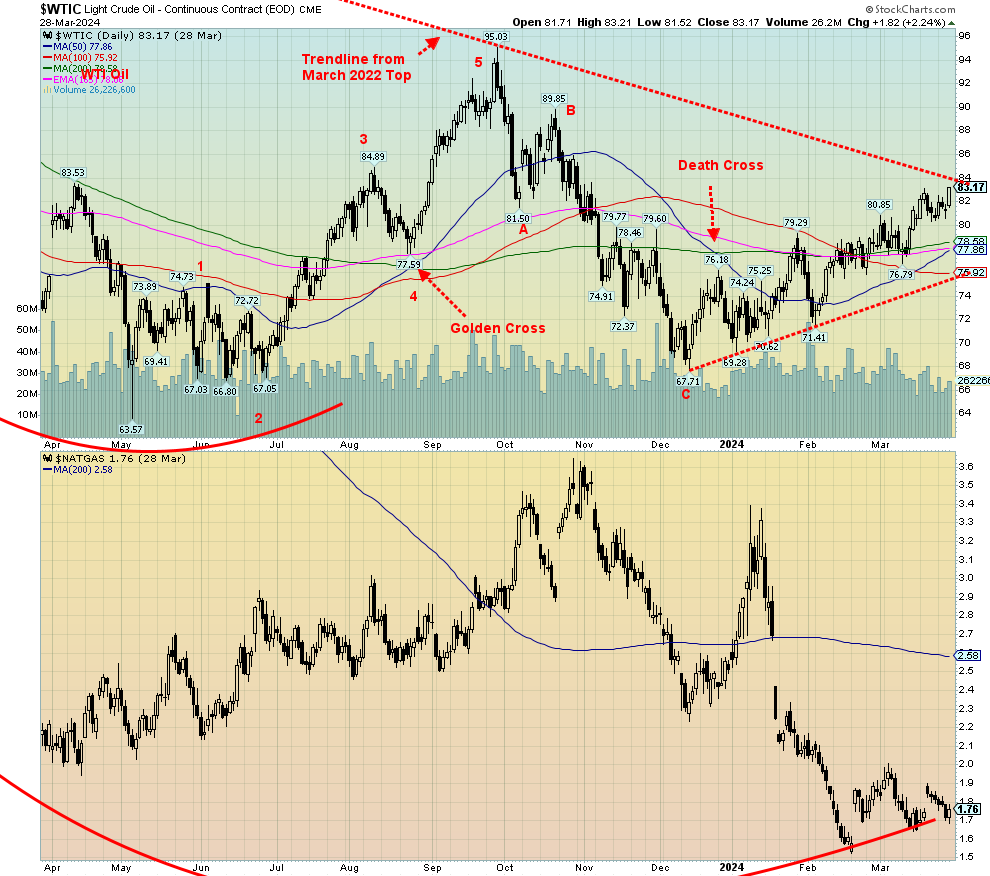
Source: www.stockcharts.com
WTI oil prices are creeping slowly towards our $84 breakout point. Expectations are growing that OPEC will keep its production cuts for all of 2024. Any uptick in the economic outlook could also put further pressure on oil prices. This past week WTI oil gained 3.2%, closing just under our $84 breakout at $83.17. Brent crude also rose up 2.6% at $87. Natural gas (NG), as it has been waffled, closed down 1.6% while NG at the EU Dutch Hub was off 1.6%. Energy stocks were not put off by NG and rose to new all-time highs as the ARCA Oil & Gas Index (XOI) gained 1.8% and the TSX Energy Index (TEN) was up 2.7%. A firm breakout over $84 should send the energy indices (and stocks) even higher.
Technically, WTI oil is holding a good uptrend line with sufficient periods of consolidation occurring before moving to the next level. Once above $84, however, WTI could start to spike higher, especially if accompanied by an event that pushes it up. And an event to push oil higher remains a possibility, with the Russia/Ukraine war and ongoing tensions in the Middle East.
NG continues to trace what we believe is a long bottom pattern. But the reality is that NG must break up over $2.60 to remotely suggest to us that we are busting upwards. Even a move over $2 would be positive. Our suspicion is the low is in, but we do not as yet have positive buy signals.
The market closed well in March. One energy area that could experience upward pressure is coal. The closing of the Baltimore terminal where coal is exported makes up 28% of the U.S. exports. A number of shipping companies could also have problems.
Copyright David Chapman 2024
GLOSSARY
Trends
Daily – Short-term trend (For swing traders)
Weekly – Intermediate-term trend (For long-term trend followers)
Monthly – Long-term secular trend (For long-term trend followers)
Up – The trend is up.
Down – The trend is down
Neutral – Indicators are mostly neutral. A trend change might be in the offing.
Weak – The trend is still up or down but it is weakening. It is also a sign that the trend might change.
Topping – Indicators are suggesting that while the trend remains up there are considerable signs that suggest that the market is topping.
Bottoming – Indicators are suggesting that while the trend is down there are considerable signs that suggest that the market is bottoming.
Disclaimer
David Chapman is not a registered advisory service and is not an exempt market dealer (EMD) nor a licensed financial advisor. He does not and cannot give individualised market advice. David Chapman has worked in the financial industry for over 40 years including large financial corporations, banks, and investment dealers. The information in this newsletter is intended only for informational and educational purposes. It should not be construed as an offer, a solicitation of an offer or sale of any security. Every effort is made to provide accurate and complete information. However, we cannot guarantee that there will be no errors. We make no claims, promises or guarantees about the accuracy, completeness, or adequacy of the contents of this commentary and expressly disclaim liability for errors and omissions in the contents of this commentary. David Chapman will always use his best efforts to ensure the accuracy and timeliness of all information. The reader assumes all risk when trading in securities and David Chapman advises consulting a licensed professional financial advisor or portfolio manager such as Enriched Investing Incorporated before proceeding with any trade or idea presented in this newsletter. David Chapman may own shares in companies mentioned in this newsletter. Before making an investment, prospective investors should review each security’s offering documents which summarize the objectives, fees, expenses and associated risks. David Chapman shares his ideas and opinions for informational and educational purposes only and expects the reader to perform due diligence before considering a position in any security. That includes consulting with your own licensed professional financial advisor such as Enriched Investing Incorporated. Performance is not guaranteed, values change frequently, and past performance may not be repeated.
About the author


Website: https://www.enrichedinvesting.com
Disclaimer: David Chapman is not a registered advisory service and is not an exempt market dealer (EMD) nor a licensed financial advisor. We do not and cannot give individualised market advice. David Chapman has worked in the financial industry for over 40 years including large financial corporations, banks, and investment dealers. The information in this newsletter is intended only for informational and educational purposes. It should not be considered a solicitation of an offer or sale of any security. The reader assumes all risk when trading in securities and David Chapman advises consulting a licensed professional financial advisor before proceeding with any trade or idea presented in this newsletter. David Chapman may own shares in companies mentioned in this newsletter. We share our ideas and opinions for informational and educational purposes only and expect the reader to perform due diligence before considering a position in any security. That includes consulting with your own licensed professional financial advisor.