
Fear and consequence. That seems to be this past week's theme. The fear is that the wars in the Middle East between Israel/Hamas and the war between Russia and Ukraine could expand. At the center is Iran. Gold responded with a breakout once again to new all-time highs plus a potential multi-year breakout from a huge cup and handle pattern. Silver, too. The consequence is oil prices rising, having broken the downtrend line from the 2022 top at the beginning of the Russia/Ukraine war.
The March job numbers came out. They are the subject of the chart of the week. Once again they were gangbusters. But a dig underneath reveals things aren't quite as rosy.
Stocks wobbled even as the Magnificent Seven now the Magnificent Five rose once again. It wasn't enough. Except the TSX rose thanks to Golds and Energy. But new highs in the stock market cannot be ruled out yet.
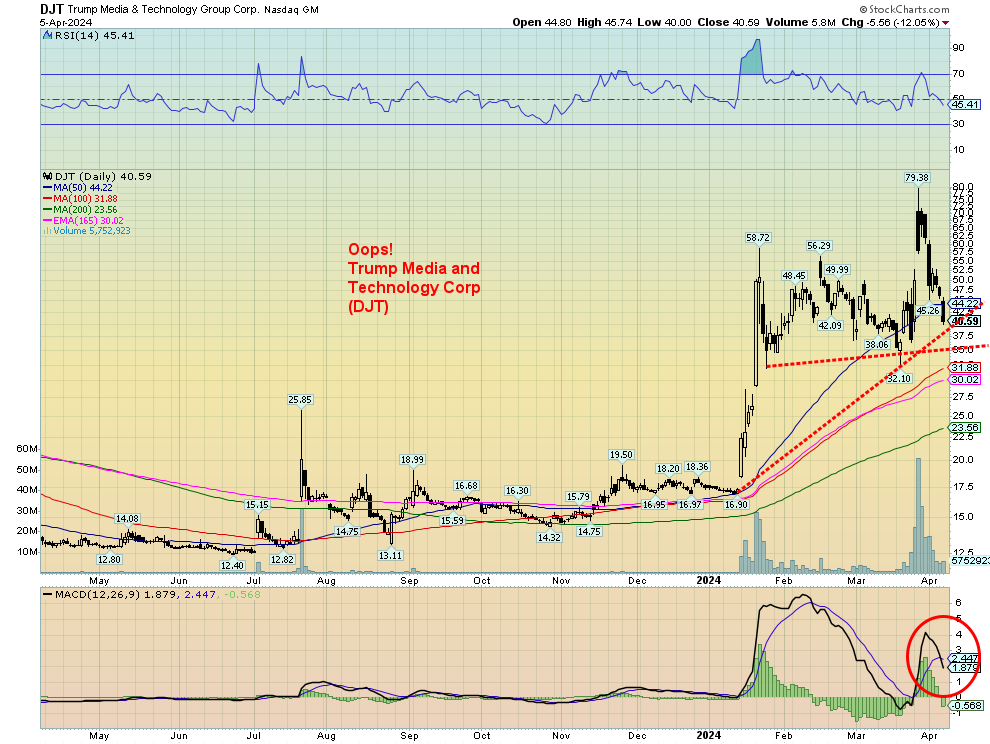
Need we mention that Trump Media's IPO is turning to pixie dust? And why is the monetary base expanding once again? Gold in other currencies are soaring. For example, Kinross Gold Corporation recently announced production, cost and capital that met guidance, free cash flow that doubled year-over-year and is held in the Enriched Capital Conservative Growth Strategy.* It was an interesting week.
The weather is warming up. Get out and enjoy. Have a great week!
DC
* Reference to the Enriched Capital Conservative Growth Strategy and its investments, celebrating a 6-year history of strong growth, is added by Margaret Samuel, President, CEO and Portfolio Manager of Enriched Investing Incorporated, who can be reached at 416-203-3028 or msamuel@enrichedinvesting.com
“Pessimists sound smart; optimists make money.”
—Stephen McBride, professional investor, chief analyst, Risk Hedge (www.riskhedge.com), a disruption research firm, author of The Jolt; b. Dublin, Ireland
“The biggest risk of all is not taking one.”
—Mellody Hobson, American businesswoman, President Co-CEO Ariel Investments, Chair Starbucks, former chair of DreamWorks Animation, married to George Lucas; b. 1969
“A U.S. dollar is an IOU from the Federal Reserve Bank. It’s not backed by gold or silver. It’s a promissory note that doesn’t actually promise anything.”
—P.J. O’Rourke, American author, journalist, political satirist, author of Parliament of Whores, Give War a Chance, amongst others; 1947–2022
War, or the threat of escalation of war, sparked a sharp uptick for both gold and oil. Gold is the fear trade. Oil is the consequence trade. The alleged Israeli attack on the Iranian consulate in Damascus, Syria that killed a few high-ranking Iranian officers is one spark. With Iran vowing retaliation, the war that started between Israel and Hamas threatens to rise to another level. Iranian-backed groups such as Hezbollah in Lebanon and the Houthis of Yemen are already creating havoc along the northern border with Israel and Lebanon and causing major shipping problems in the Gulf of Aden/Bab al-Mandab Strait, the Red Sea, and the Suez Canal. As well, there have been attacks on U.S. bases in Syria and Iraq by Iranian-backed militia operating in both Syria and Iraq.
The second spark is the ongoing war between Russia and Ukraine where, in what many describe as a stalemate, Russia may advance further in the Donbas. Ukraine has been attacking Russian oil refineries; some such as the Taneco refinery, Russia’s third largest, are upwards of 1,300 Kms (800 miles) from Ukraine. Ukraine has also hit other Russian oil refineries. The damage varies, but the attacks have brought a sharp rebuke from the U.S., who are concerned about the negative impact on oil prices. However, the attacks on the oil refineries have been responded to by Russia with increased attacks on Ukraine’s energy infrastructure.
There are, in all probability (according to reports we read in European papers), NATO troops in Ukraine providing logistics and other assistance. There are an estimated 20,000 foreign nationals as part of the Ukrainian military. French President Macron has said NATO troops should be in Ukraine, but both German and Poland deny there are any there. There has been a build-up of Polish military along the Ukrainian border. All of this is raising the temperature with Russia, who say they are fighting both NATO and Ukraine. Russia has been accused of cyberattacks on Western computers that could shut down the system.
All of this is heating up both wars and both are now threatening to expand.
To add to the oil woes, Mexico announced cutbacks to exports, giving another negative jolt to the markets. The U.S., who is the world’s largest producer, can only make up so much of what is being cut elsewhere. OPEC continues with their cuts.
War and the threat of war is a significant factor for the price of oil. The Yom Kippur War in 1973 led to the Arab oil embargo that sparked a $7+ spike in the price of oil or 183%. It was also one of the causes of the steep recession of 1973–1974. The Iranian hostage crisis and Russia’s invasion of Afghanistan in 1979 sparked another run-up for oil as it gained almost $25 or 166%. That spike sparked the steep recessions of 1980–1982.
WTI Oil 1970–2024 (Inflation-Adjusted)
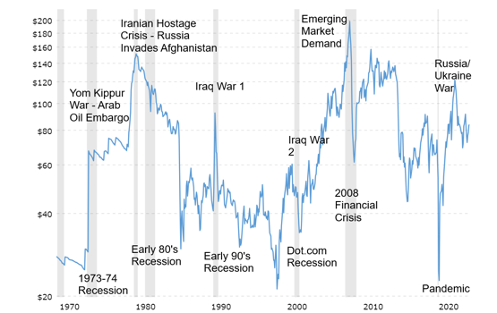
Source: www.macrotrends.net
The next crisis was the Iraq War 1 in 1990 that also sparked a recession in the early 1990s. Oil prices gained over $22 or 131%. Iraq War 2 in 2003 also sparked a jump in oil prices, but the gain was only about $10 or 36%. A bigger influence for oil prices was the surge in demand from emerging markets, led by China, that saw WTI oil rise to record levels of $147, gaining well over $100 over 400%. The Russia/Ukraine war (2022) sparked a run-up for oil of roughly $50 to $130 as oil gained about 75% in six months.
The question now is, what might an expansion of the wars in Russia/Ukraine and Israel in the Middle East do to oil prices once again? Iran could cause considerable problems if they were to disrupt or even block the Straits of Hormuz where 30% of the world’s oil comes through. Regardless of increased production from the U.S., who is now the world’s largest producer, it would not be enough to offset the impact of a severe disruption in the Straits. Some have suggested that WTI oil could soar past $150.
Gold and war don’t appear as closely related. For years, gold prices were fixed. Still, gold rose during the U.S. Civil War and Lincoln had suspended the gold standard to finance the war, but the gold peak didn’t come until 1869 after the war had ended. There were rises during and after World War I and even World War II, despite fixed prices. However, it took the Vietnam War to put pressure on the Bretton Woods system that eventually collapsed in 1971 and was completely collapsed by 1973. Gold rose, but the biggest rise didn’t occur until the late 1970s, coinciding with the Iranian hostage crisis and Russia’s invasion of Afghanistan. Gold soared to a record high at the time of $877. On an inflation-adjusted basis, the January 1980 mark still stands.
Gold 1999–2024
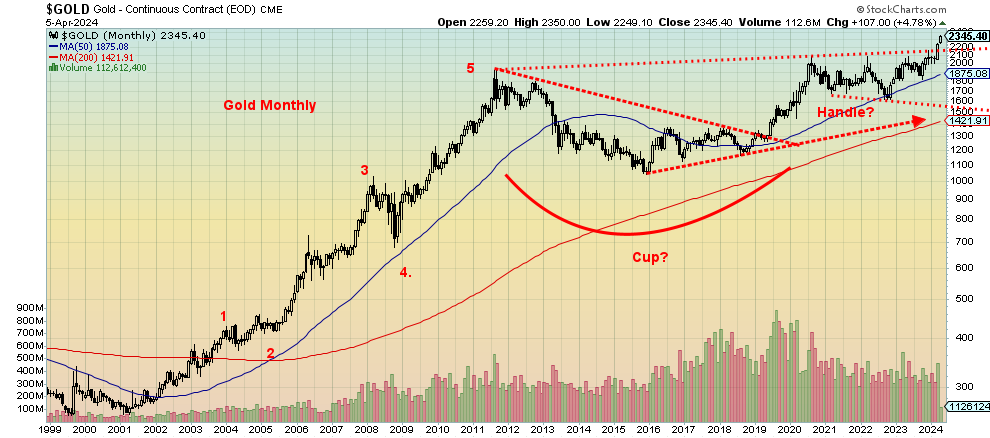
Source: www.stockcharts.com
Our long-term chart of gold suggests it is making a major breakout from what appears as a cup and handle pattern. The cup was formed during the long period from 2011 to 2020. Gold rose sharply out of the pandemic low in March 2020. However, since then it has been in a downward/sideways pattern, forming what we believe is the handle of the pattern. With its breakout above $2,200 it appears to be busting above the handle. If that is correct, the pattern suggests that gold could have targets up to $3,050 zone with potential minimum objectives to $2,375/$2,385. Gold is now crossing over $2,300 (June futures front month).
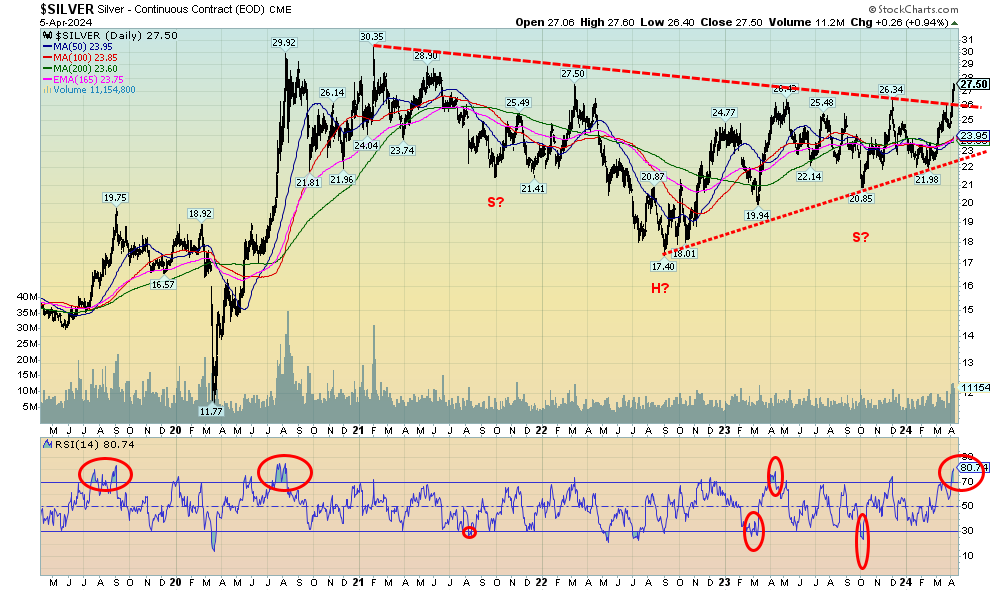
We have a similar pattern on silver, only the pattern is more massive and dates from the highs of 1980. The cup was the long period between 1980 and roughly 2006 when silver broke above earlier highs. The second peak in 2011 at roughly the same level as 1980 started the formation on what appears as the handle and projects silver to potentially rise to about $75 once we clear above $27.50. Minimum potential targets appear to be $38/$40. Could it all be a false breakout? Possibly but the fundamentals behind it are strong so a false breakout is unlikely.
These are significant breakouts and they do come after what we believe were important cycle lows for both gold and silver. Gold made its 7.8-year cycle low and possibly the 23.5-year cycle low in November 2016. Silver made what may be an important half-cycle low to the 18.5-year cycle in March 2020. We are now going into the second half of that cycle and it is potentially the most explosive.
Silver 1970–2024
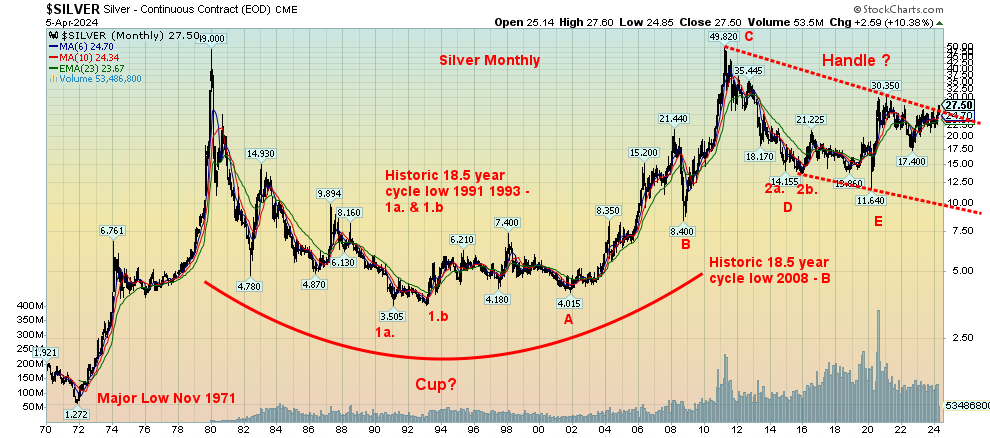
Source: www.stockcharts.com
Oil is also poised to go higher, possibly substantially. The Russia/Ukraine war sparked a breakout. The correction that has been going on for months now has only been testing that original breakout line. The March 2020 pandemic low was an important cyclical low, possibly a 9-year–half-cycle low to the longer 18-year cycle. If that’s correct, then we are in the second phase and that is usually the most explosive. That March 2020 low did come almost 12 years after the 2008 low but remained within range 7–11 years, although just barely.
Fear and consequence can be important drivers for both gold and oil. War or just the threat of it is the fear. Gold is responding to the fear. The consequence is a potential sharp rise in the price of oil where drivers will eventually feel it at the pump. As we have said so many times, the gold market is small so even a small re-allocation of funds to the sector can move prices very quickly.
WTI Oil 1982–2024
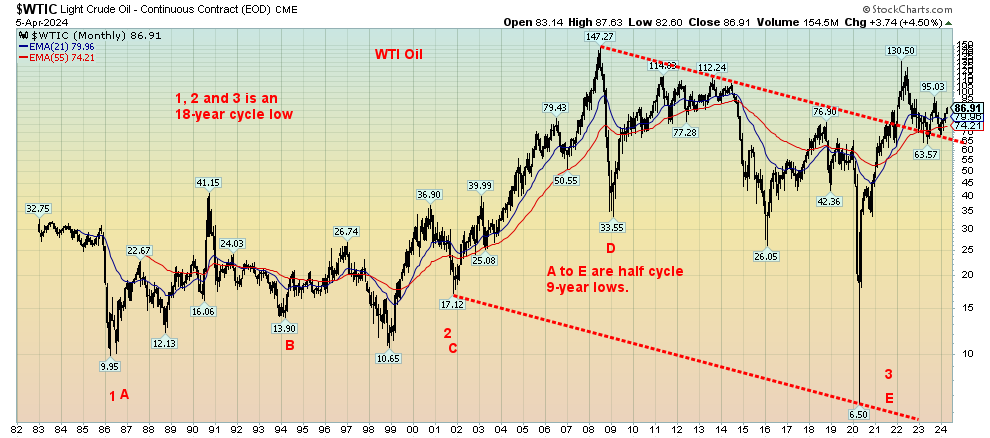
Source: www.stockcharts.com
Should we add that central banks have been significant buyers of gold over the past few years? Why are central banks buying? A big driver is diversification away from the U.S. dollar. Both Russia and China are buying gold to shore up their currencies. China has even talked about a gold standard. Gold remains a key store of value and since being set free to trade in August 1971 has been a high performer, higher than the stock markets with the exception of the NASDAQ. Gold is major source of value. Global debt levels, which have long crossed $300 trillion, remain a concern for many central banks. All of this supports the long-term outlook for gold.
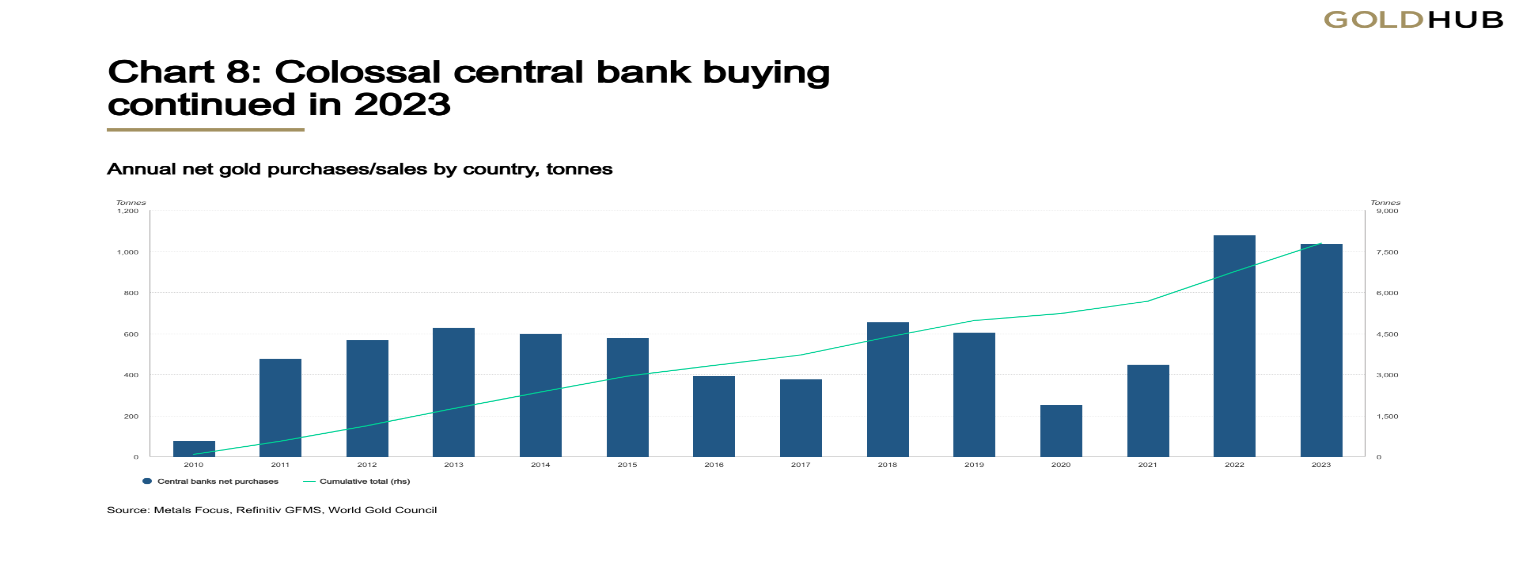
Source: www.gold.org, www.metalsfocus.com, www.refinitiv.com
Chart of the Week
U.S. Job Numbers
Employed Persons, Unemployed Persons 2019–2024
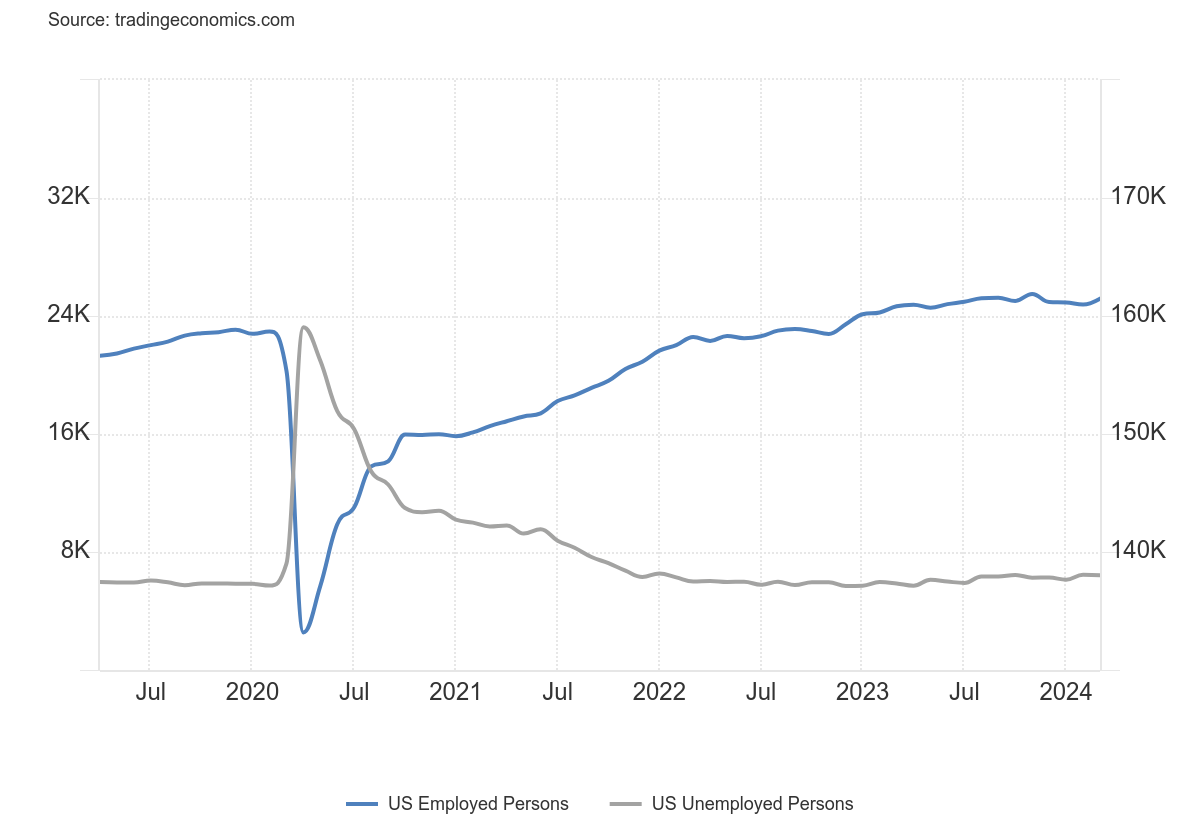
Source: www.tradingeconomics.com, www.bls.gov
Oops! They did it again. Yes, the nonfarm payrolls came in higher than expected. The gain was 303,000 when they were expecting only 200,000. That’s quite a jump. Even the revisions were revised up with January revised up 27,000 while February was mildly down 5,000 with a net 22,000 gain. Revisions are a constant with the nonfarm payrolls. Here’s a chart we found, courtesy of James Wong, a fixed income portfolio manager out of Hong Kong. He notes that since January 2023 the nonfarm payrolls have been downgraded seven times, amounting to a revised drop of 251,000 over the period. January 2024 was revised down 125,000 before revising it up 22,000 this past month.
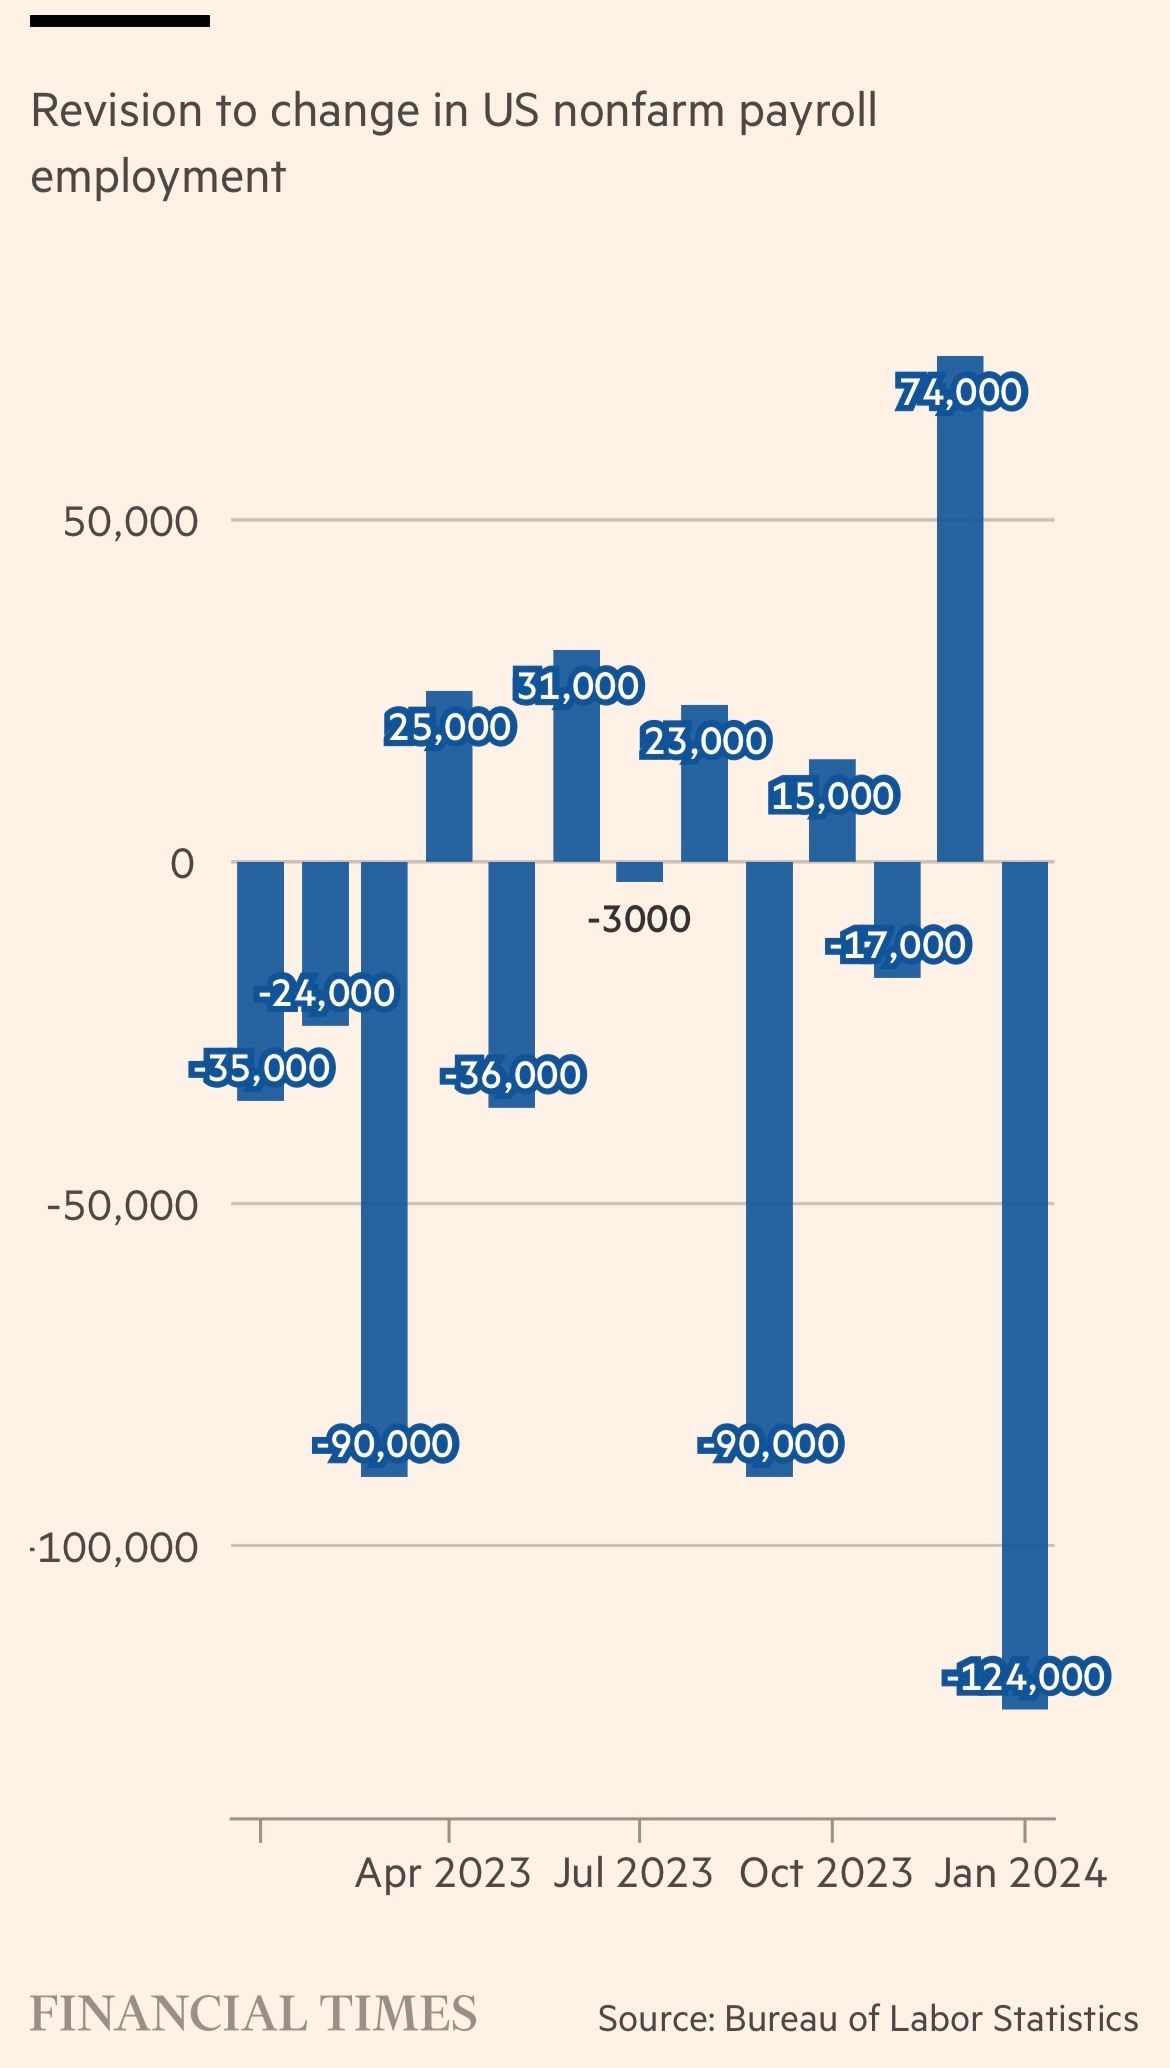
Source: www.ft.com, www.bls.gov
As we have noted many times, the employment numbers come from two different sources. The establishment survey provides the nonfarm payrolls. The household survey provides everything else. The establishment survey collects from businesses and organizations while the household survey collects from households or individuals. It is noted that the household survey captures more, but the broader based establishment survey can be somewhat more reliable and less volatile.
The total population level—meaning all those 15 years of age and over—rose by 173,000. The civilian labour force was up a whopping 469,000 and the employment level was up 498,000. The number for those working full-time fell 6,000, but for those working part-time jumped 691,000. That suggests that the rosy report was really all part-time work. Tellingly, the percentage holding multiple jobs rose to 5.2% from 5.1%.
The unemployment rate (U3) fell to 3.8% from 3.9% while the U6 unemployment rate (plus all persons marginally attached to the labour force plus total employed part-time for economic reasons as a percentage of the total labour force and all persons marginally attached to the labour force), the highest reported by the Bureau of Labour Statistics (BLS), was steady at 7.3%. The Shadow Stats (www.shadowstats.com) unemployment rate (U6 plus all those defined out of the labour force in a revision in 1994) was 25.8% also unchanged from February. Noted that the unemployed noted in Shadow Stats numbers are currently found in not in the labour force.
The labour force participation rate rose to 62.7% vs. 62.5% while the employment population ratio was up to 60.3% vs. 60.1%. That suggests there are more people employed and more attached to the labour force as that is reflected in the employment level that jumped 498,000. But, as we noted, they are primarily part-timers. Those not in the labour force fell by 296,000 to just under 100.0 million. Of those not in the labour force, 58.5 million are retirees while 8.5 million are on disability. 1.4 million have looked for work and available but can’t find a job. There is also a group of older workers over 65 who would work if they could find a job. That totals roughly 32.8 million. Some 16 million are men between 16 to 64 with no disability but considered to be not in the labour force. There is some cross over in these numbers.
The average weeks unemployed rose to 21.6 weeks vs. 20.9 weeks while the median weeks unemployed was up to 10.7 weeks vs. 9.2 weeks. Both of those are interesting as they suggest that, yes, people are employed but the unemployed are out there longer. The percentage unemployed 27 weeks or longer rose to 19.5% from 18.7%.
Average hourly earnings were up 0.3% in March, in line with expectations and year over year (y-o-y) was also in line, up 4.1%.
Given the strong numbers, one might believe it will throw cold water on any rate cut in June. Maybe, maybe not. An additional piece we noted is that, of the nonfarm jobs, 232,000 were in the private sector. Interestingly, the key age group 25–54 years actually lost jobs, down 48,000, while those 55 years and older gained 234,000. Those under 25 also rose. Most jobs were in leisure/hospitality, education/healthcare, and government and, as we noted, were mostly part-time. On the surface the report looks good. Underneath, not so good. It was weak, flimsy.
Canada Job Numbers
Employment Rate, Unemployment Rate 2019–2024
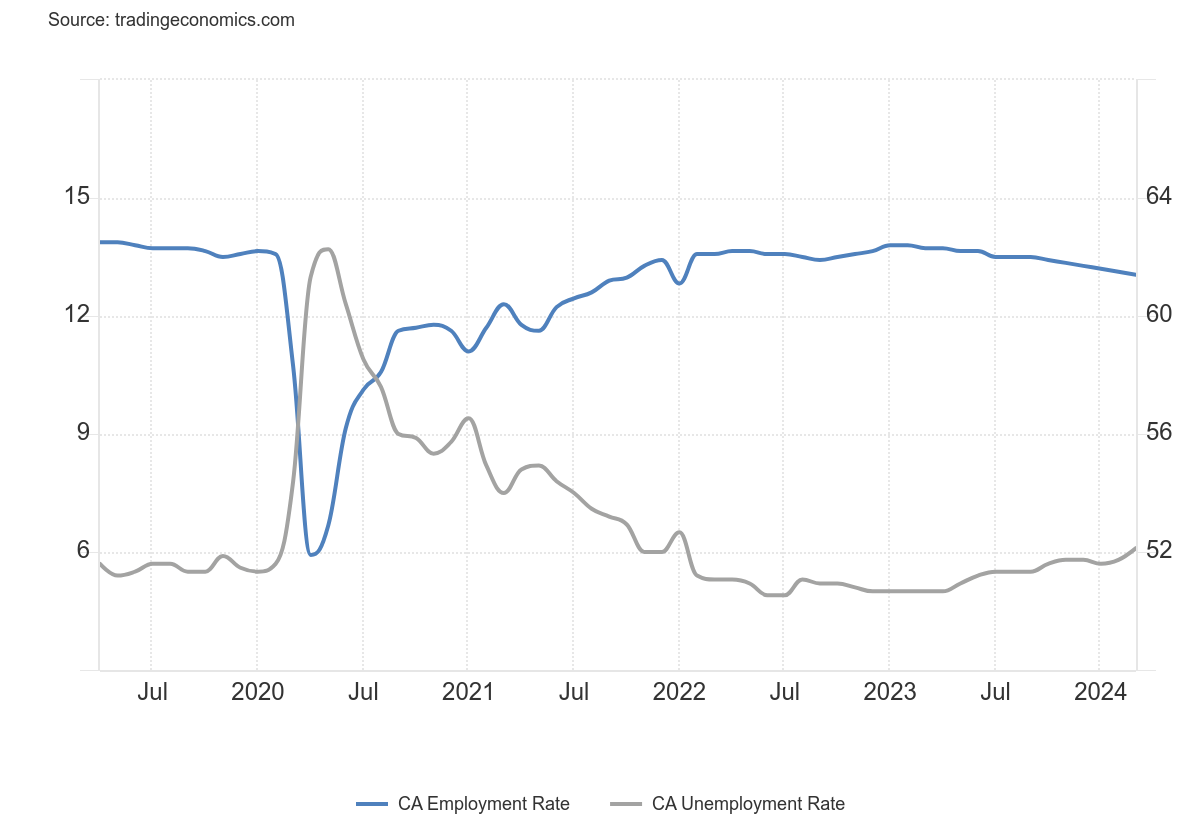
Source: www.tradingeconomics.com, www.statcan.gc.ca
If the U.S. job numbers went up, Canada’s went down. Canada’s job growth has been very good, so a pause is not surprising. Rather than the creation of 15,000 jobs, Canada lost 2,200 jobs. Full-time employment fell 700 while part-time employment was off 1,600. The labour force participation rate remained unchanged at 65.3%. Note that is higher than the U.S. A higher LFPR tends to translate into higher unemployment as March unemployment rose to 6.1% from 5.9%. It’s the highest level since 2017, outside of the big jump during COVID. Some 60,000 joined the labour force seeking work which helped push up the unemployment rate. The R8 unemployment rate (includes discouraged searchers, the waiting group, and a portion of involuntary part-timers), the highest reported by Statistics Canada, rose to 8.8% from 8.4%.
Job losses were mostly in accommodation and food services, explaining why most of the losses were part-time. Young people under 25 lost 28,000 jobs while those in the core age rose 20,000. Older people above 55 also saw gains. Average hourly wages were up 5% y-o-y, when all they expected was a rise of 4.7%. That will keep the inflation watch on.
Canada has experienced good job growth over the past year, so a one-month blip is may not be of too much concern. However, it does suggest some weakness. It’ll probably help Tiff Macklem keep rates unchanged at minimum and may even encourage a rate cut.
Markets & Trends
|
|
|
|
% Gains (Losses) Trends |
|
||||
|
|
Close Dec 31/23 |
Close Apr 5, 2024 |
Week |
YTD |
Daily (Short Term) |
Weekly (Intermediate) |
Monthly (Long Term) |
|
|
Stock Market Indices |
|
|
|
|
|
|
|
|
|
S&P 500 |
4,769.83 |
5,204.34 |
(1.0)% |
9.1% |
up |
up |
up |
|
|
Dow Jones Industrials |
37,689.54 |
38,904.04 |
(2.3)% |
3.2% |
up |
up |
up |
|
|
Dow Jones Transport |
15,898.85 |
15,919.20 |
(1.8)% |
0.1% |
up |
up |
up |
|
|
NASDAQ |
15,011.35 |
16,248.52 |
(0.8)% |
8.2% |
up |
up |
up |
|
|
S&P/TSX Composite |
20,958.54 |
22,264.38 (new highs)* |
0.4% |
6.2% |
up |
up |
up |
|
|
S&P/TSX Venture (CDNX) |
552.90 |
584.33 |
3.7% |
5.7% |
up |
up (weak) |
down |
|
|
S&P 600 (small) |
1,318.26 |
1,308.66 |
(2.7)% |
(0.7)% |
neutral |
up |
up |
|
|
MSCI World |
2,260.96 |
2,363.18 |
(0.3)% |
4.5% |
up |
up |
up |
|
|
Bitcoin |
41,987.29 |
67,497.87 |
(4.7)% |
60.8% |
neutral |
up |
up |
|
|
|
|
|
|
|
|
|
|
|
|
Gold Mining Stock Indices |
|
|
|
|
|
|
|
|
|
Gold Bugs Index (HUI) |
243.31 |
265.17 |
7.3% |
9.0% |
up |
up |
up (weak) |
|
|
TSX Gold Index (TGD) |
284.56 |
310.58 |
6.9% |
9.1% |
up |
up |
up |
|
|
|
|
|
|
|
|
|
|
|
|
% |
|
|
|
|
|
|
|
|
|
U.S. 10-Year Treasury Bond yield |
3.87% |
4.41% |
4.8% |
14.0% |
|
|
|
|
|
Cdn. 10-Year Bond CGB yield |
3.11% |
3.63% |
4.0% |
16.7% |
|
|
|
|
|
Recession Watch Spreads |
|
|
|
|
|
|
|
|
|
U.S. 2-year 10-year Treasury spread |
(0.38)% |
(0.35)% |
16.7% |
7.9% |
|
|
|
|
|
Cdn 2-year 10-year CGB spread |
(0.78)% |
(0.63)% |
3.1% |
19.2% |
|
|
|
|
|
|
|
|
|
|
|
|
|
|
|
Currencies |
|
|
|
|
|
|
|
|
|
US$ Index |
101.03 |
104.30 |
(0.2)% |
3.2% |
up |
up (weak) |
up (weak) |
|
|
Canadian $ |
75.60 |
73.67 |
(0.3)% |
(2.6)% |
down |
down |
down |
|
|
Euro |
110.36 |
108.37 |
0.4% |
(1.8)% |
neutral |
neutral |
neutral |
|
|
Swiss Franc |
118.84 |
110.82 |
(0.1)% |
(6.8)% |
down |
down |
up (weak) |
|
|
British Pound |
127.31 |
126.35 |
0.1% |
(0.8)% |
down |
neutral |
neutral |
|
|
Japanese Yen |
70.91 |
65.95 |
(0.2)% |
(7.0)% |
down |
down |
down |
|
|
|
|
|
|
|
|
|
|
|
|
|
|
|
|
|
|
|
|
|
|
Precious Metals |
|
|
|
|
|
|
|
|
|
Gold |
2,071.80 |
2,345.40 (new highs)* |
4.8% |
13.2% |
up |
up |
up |
|
|
Silver |
24.09 |
27.50 |
10.4% |
14.2% |
up |
up |
up |
|
|
Platinum |
1,023.20 |
940.60 |
2.1% |
(8.1)% |
up |
up (weak) |
down |
|
|
|
|
|
|
|
|
|
|
|
|
Base Metals |
|
|
|
|
|
|
|
|
|
Palladium |
1,140.20 |
1,007.40 |
(1.4)% |
(11.7)% |
up (weak) |
down |
down |
|
|
Copper |
3.89 |
4.24 |
5.8% |
9.0% |
up |
up |
up (weak) |
|
|
|
|
|
|
|
|
|
|
|
|
Energy |
|
|
|
|
|
|
|
|
|
WTI Oil |
71.70 |
86.91 |
4.5% |
21.1% |
up |
up |
up (weak) |
|
|
Nat Gas |
2.56 |
1.78 |
1.1% |
(30.5)% |
neutral |
down |
down |
|
Source: www.stockcharts.com
Note: For an explanation of the trends, see the glossary at the end of this article.
New highs/lows refer to new 52-week highs/lows and, in some cases, all-time highs.
- * New All-Time Highs
Source: www.stockcharts.com
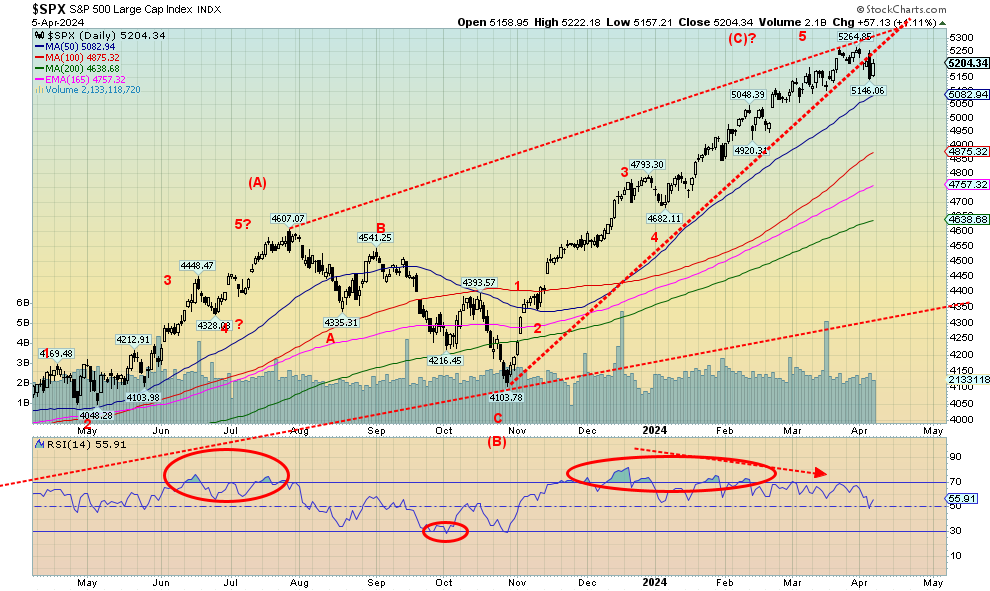
The S&P 500 (SPX) had its worst week since this latest rally got underway in October 2023. The SPX fell almost 1.0%. SPX rose 28% out of the October 2023 low, led by the Magnificent Seven. But the seven are down to five and things are getting a little wobbly as tensions grow, both geopolitically and domestically, and the debt is out of sight. Interest payments on the debt now exceed expenditures on defense (okay, not quite yet but they’re getting closer and the day they exceed $1 trillion just for debt interest alone is not far away). Total U.S. debt (governments, corporations, households) now exceeds $98 trillion, representing over 30% of global debt. While the worry and comments always seem to be on the government debt, the corporate and household debt totaling almost $60.0 trillion can’t be ignored. Consumers hold $25.5 trillion, but there are big worries, particularly in the commercial real estate market, on what impact it could have on the banks.
So far, all that has fallen is some big regionals. But what of the majors? What if we had another Lehman Brothers event? After that debacle, the days of the independent brokerage firms became the days of the big brokerages turned banks or gobbled up by banks. Oh yes, and derivatives where in the U.S. it is a $624 trillion market (face value not actual risk exposure where the real risk is cash flows). Globally derivatives total over a quadrillion face value. U.S. banks are the largest holders of derivatives. Goldman Sachs is estimated to hold some $203 trillion face value of derivatives.
As noted, the SPX fell about 1.0%, the Dow Jones Industrials (DJI) fell 2.3%, the Dow Jones Transportations (DJT —no, not that DJT) fell 1.8%, and the NASDAQ was off 0.8% as the NY FANG Index, up 1.3%, rescued it. The S&P 400 (Mid) fell 1.9% and the S&P 600 (Small) dropped 2.7% and is now negative 0.7% on the year. In Canada, the TSX Composite bucked the trend, thanks to the material sectors gaining 0.4% to new all-time highs. The TSX Venture Exchange (CDNX) came alive, up 3.7%. Bitcoin also wobbled falling 4.7%.
In the EU, they also wobbled as the London FTSE was off 0.8%, the EuroNext made all-time highs then closed lower, losing 0.4%, and the Paris CAC 40 and the German DAX did the same thing making all-time highs before the CAC lost 1.8% and the DAX fell about 2.0%. Those reversals suggest that the EU indices may have topped. But we’ve seen that before and then they go to new highs. In Asia, China’s Shanghai Index (SSEC) was up about 2.0% in a holiday shortened week, the Tokyo Nikkei Dow (TKN) lost 2.4% while Hong Kong’s Hang Seng (HSI) rose 1.1%.
The SPX could be breaking that huge ascending wedge triangle. But we’ll reserve an opinion on that until we get a confirmation when it breaks under 5,000 and then under 4,900. Otherwise, the wedge suggests that the October 2023 lows could be seen once again. That’s at 4,100, a drop of 20% from here. New highs, which remain quite possible, would keep this alive. We can’t rule it out, but the days look numbered.
Source: www.stockcharts.com
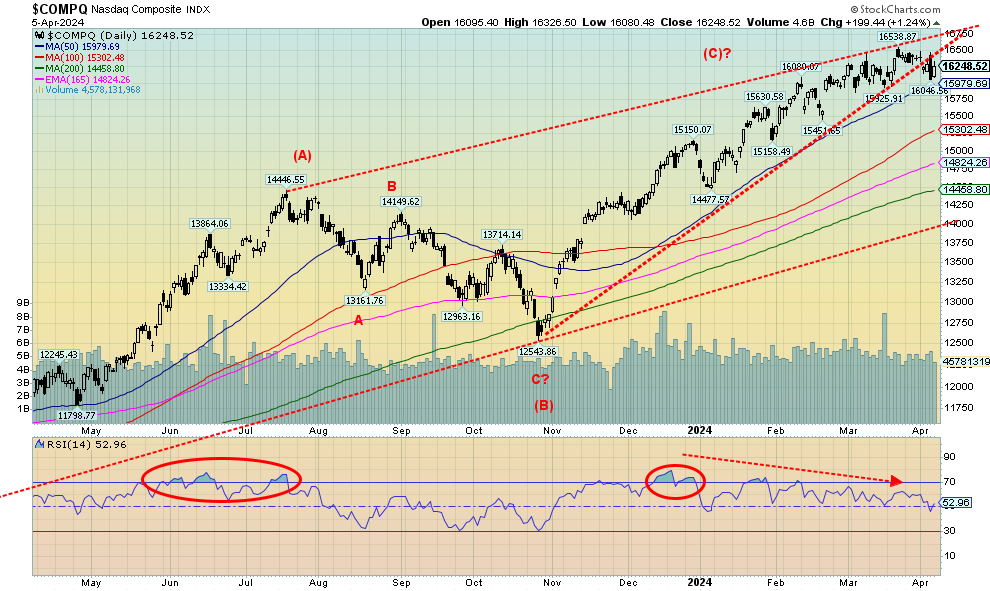
The NASDAQ wobbled this past week as it appears to have broken under a huge ascending wedge triangle. Confirmation could come with a come with a breakdown under 15,900. We’d say the leader was the FAANGs but the NY FANG Index actually rose this past week by 1.3%. Some FAANGs hit all-time highs notably Meta, Amazon, Netflix, and Google. Meta soars as it was up another 8.5% this past week. But the losers were also prevalent as Tesla fell 6.2%, knocking Elon Musk back to only the third richest person in the world. Donald Trump also took a hit as his Trump Media and Technology Corp (DJT) fell a whopping 34.5%, wiping out the gains since the IPO. It was called Trump and Dump. Two persons were charged with insider trading on the deal. The chart appears to be headed lower. If it breaks $35, the target could be $12. Under $30 it’s all over. As if his legal problems weren’t enough.
The NASDAQ looks in trouble, but we can’t rule out a recovery that takes us to new highs again. Such is the nature of the Magnificent Seven rally, even as the Magnificent Seven appear to be down to the Magnificent Five. Doesn’t quite have the same ring to it. The outliers? Tesla and Apple. The chart looks negative and, if we don’t break now, May is just around the corner. Sell in May and go away? That saying might have more meaning this year.
Source: www.stockcharts.com
Source: www.stockcharts.com
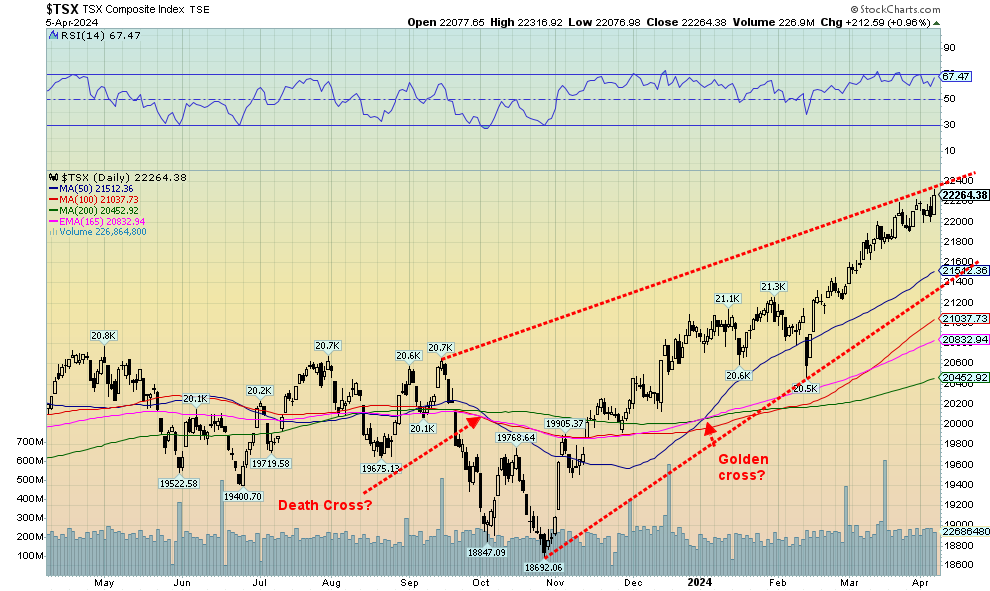
While the U.S. stock indices wobbled this past week, the TSX Composite rose, thanks to strong performances from Energy, Golds, Metals, and Materials. These are the sectors that we have noted one should be in. The TSX Venture Exchange (CDNX) also rose. The TSX was up 0.4% this past week to new all-time highs. The TSX 60 also made all-time highs, up about 0.1% and underperforming the broader index. The TSX Venture Exchange (CDNX) where the junior mining stocks are rose 3.7% but remains under-owned, unloved, and ignored. Of the 14 sub-indices, eight were down and six were up. But the six up helped the composite hit new highs. The leader was Golds (TGD) up 6.9%, followed by Energy (TEN), up 5.8%, Materials (TMT), up 5.4%, and Metals (TGM), up 4.6%. Leading the downers were Utilities (TUT), down 2.5%, Real Estate (TRE), down 2.4%, and Income Trusts (TCM), down 3.8%. Financials (TFS) were down 0.7% and Information Technology (TKK) was off 1.5%. Note the big losers were interest-sensitive sectors (see note on bonds). The TSX continues to rise in what appears as an ascending wedge triangle so it could still move higher, but time is running out. Either it bursts up through it, waffles sideways, or cracks and falls. The first crack is under 22,000 but the bigger crack is under 21,400. However, it will be the commodity sectors that keep it afloat. The others not so much.
U.S. 10-year Treasury Note, Canada 10-year bond CGB
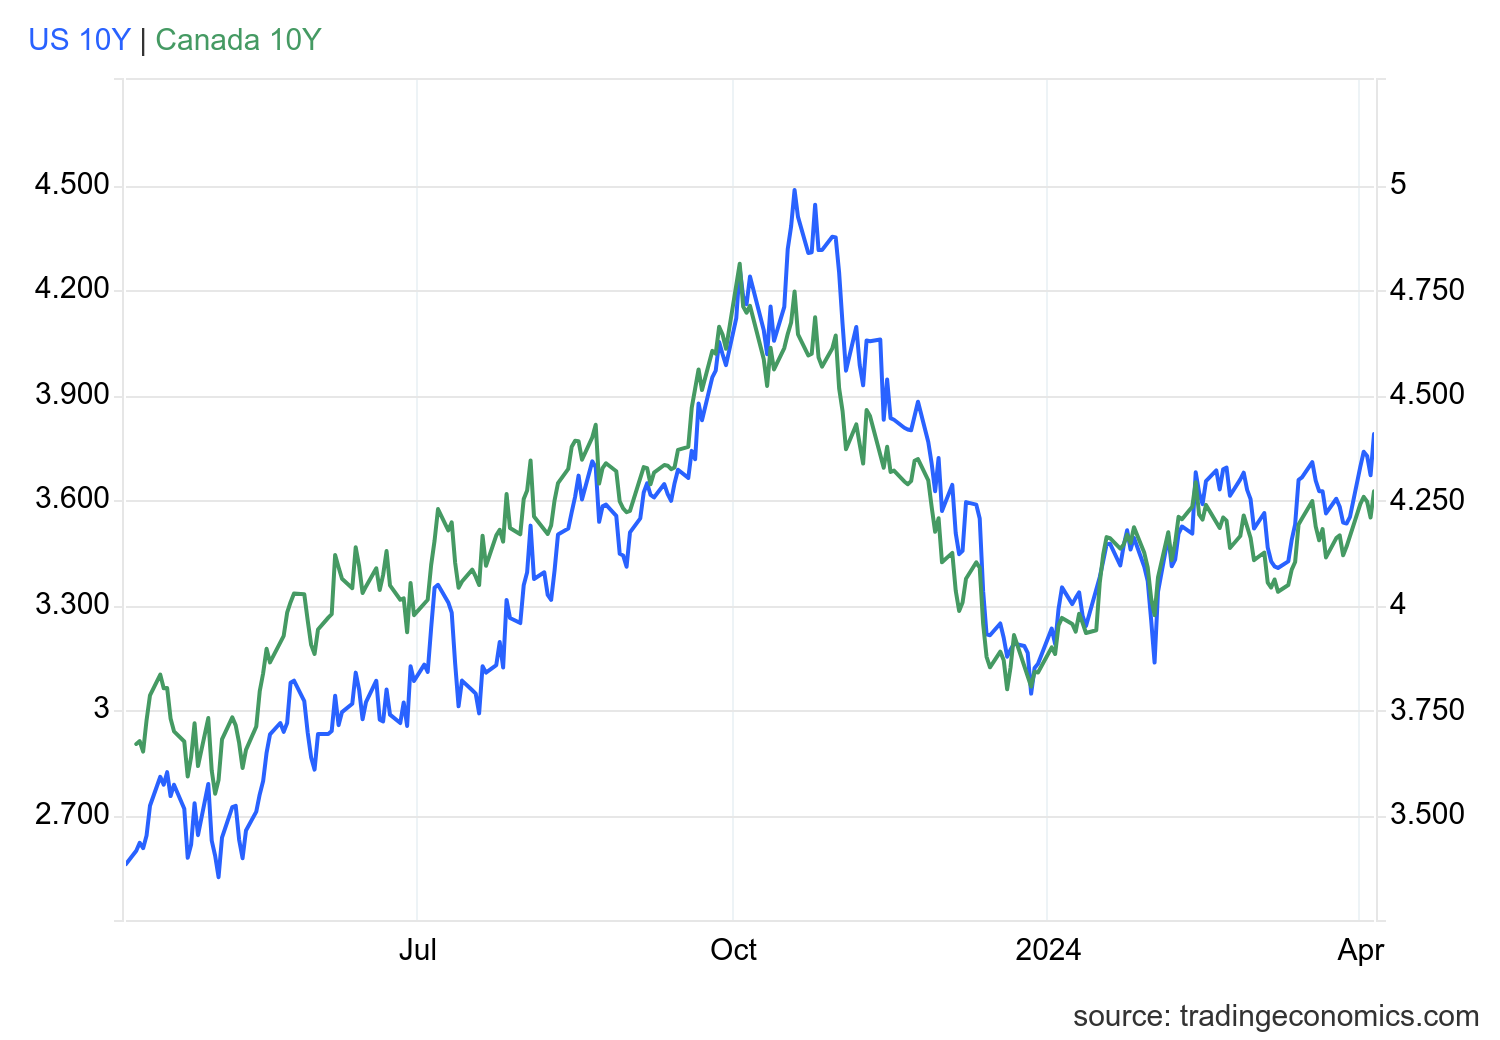
Source: www.tradingeconomics.com, www.home.treasury.gov, www.bankofcanada.ca
We’ve said very little in a way about interest rates. However, this past week we couldn’t help but notice that longer term U.S. interest rates rose. The U.S. 10-year treasury note was up to 4.41% from 4.21% (4.8%), while here in Canada the 10-year Government of Canada bond (CGB) rose to 3.63% from 3.49% (4.0%). Long interest rates are rising as the U.S. economy appears to be doing better than many expected, exemplified by the March jobs report that reported nonfarm payrolls up over 300,000. Okay, it was all part-time. The initial claims wobbled as they were 221,000 vs. 212,000 the previous week and an expectation of 214,000. The manufacturing purchasing managers indices (PMI) remain in recession territory, but the composite and services PMIs remain positive. JOLTS job openings were lower than expected while JOLTS quits were higher than expected. ISM manufacturing PMIs remain in positive territory.
The next excitement is the CPI on Wednesday, expecting 3.4% y-o-y and PPI on Thursday, expecting 2.1%. The Bank of Canada (BofC) interest rate decision is on Wednesday and is widely expected to leave things as they are. Watch Tiff Macklem’s press conference afterward. The Fed can control the short end of the market and we note that the 2–10 spread fell to negative 35 bp from negative 42 bp while in Canada it fell to negative 63
bp from negative 65 bp. Creeping down and from history we know that as the 2-10 spread narrows towards zero the odds of a recession rise. As the 10-year rises over 4.50%, the odds of a challenge of the October 2023 high of 4.98 rise. Over 4.70%, the odds are high we’ll see new highs above 5%. We’d have to break back under 4.00% to suggest lower yields. Long yields rising puts pressure on mortgage rates in a market that is already shaky, particularly commercial real estate. Vacancy rates in central cores are high and bankruptcies and delinquencies are rising. However, bond yields are responding to geopolitical tensions and rising astronomical debt levels and difficulty in selling all that debt. Buyers are balking. China’s holdings fell another $19 billion in January 2024 to the lowest level in years. The U.S. is dependent on G7 central banks to pick up the slack as other buyers back off. But not all G7 central banks are on board. Foreign holdings of U.S. treasuries fell $32.4 billion in January 2024. Is the Fed buying? Or is it something else? Is that why the monetary base is rising? (see next).
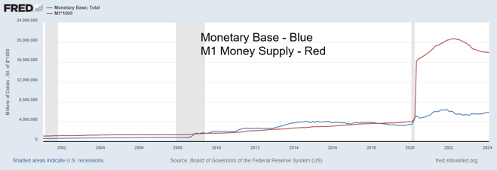
Source: www.stlouisfed.org
If the Fed were trying to keep a lid on things by maintaining higher interest rates and doing quantitative tightening (QT), why is the monetary base growing again? What is the monetary base? It’s the total amount of a currency in general circulation or in the commercial bank deposits held in the central bank's reserves. To put it another way, it is currency in circulation, currency in bank’s vaults, plus commercial bank reserves with the Federal Reserve.
Some refer to the monetary base as narrow money. Its symbol is M0 or MB. Next up is M1 (in red above) which is M0 plus demand deposits, traveler’s cheques, and savings deposits but not central bank reserves. M0 peaked at around $6.4 trillion in December 2021, then bottomed in February 2023 at $5.3 trillion. It’s now $5.9 trillion. Is the Fed quietly buying bonds again to put liquidity into the financial system? If so, what’s the problem? M1 peaked at $20.7 trillion in April 2022 and is still falling last at $17.9 trillion. Yes, the increase in M0 isn’t much ($600 billion), but it is significant. Usually, the two go together: M0 and M1. Will M1 soon start to rise again as well? All that suggests that the Fed is putting funds in, not taking them out. The Fed does that by buying bonds from commercial banks who then take cash from the Fed, thus increasing the monetary base. Does the Fed spot a problem?
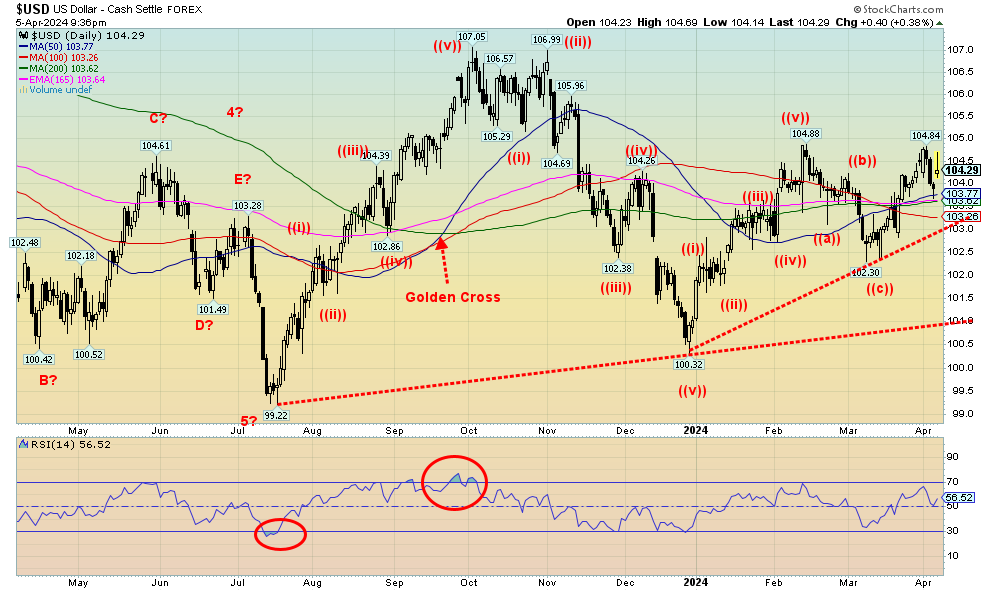
Source: www.stockcharts.com
The currencies are waffling. They don’t know what to do. Up a little, down a little. But the currency of choice is now becoming gold and silver. Fiat currencies eventually return to their intrinsic value—zero. Still, this past week the US$ Index fell 0.2%, the euro rose 0.4%, the Swiss franc was off 0.1%, the pound sterling was up about 0.1%, and the Japanese yen fell 0.2%. The Cdn$ fell 0.3%. But, no worries, gold in Cdn$ is now almost $3,200, up over 16% in 2024 as the Cdn$ has fallen 2.6%. The US$ Index (USDX) remains in an uptrend but it may be making a double top. Naturally, we can’t tell that until we fall under at least 103. Under 102, the USDX is going lower, targeting down to at least 100. Under 100, a bigger washout could get underway. What would cause that? Geopolitical tensions are actually favourable to USDX. But domestic political tensions could spark the opposite, especially if the U.S. election of 2024 were to degenerate into open warfare. That remains a possibility in listening to the candidates, as neither side may accept the results. The other risk remains with the debt crisis and the battle over the debt limit that could spark a U.S. default or just the more junior happening of a U.S. government shutdown. Under those circumstances, owning the U.S. dollar is not wise but owning gold is.
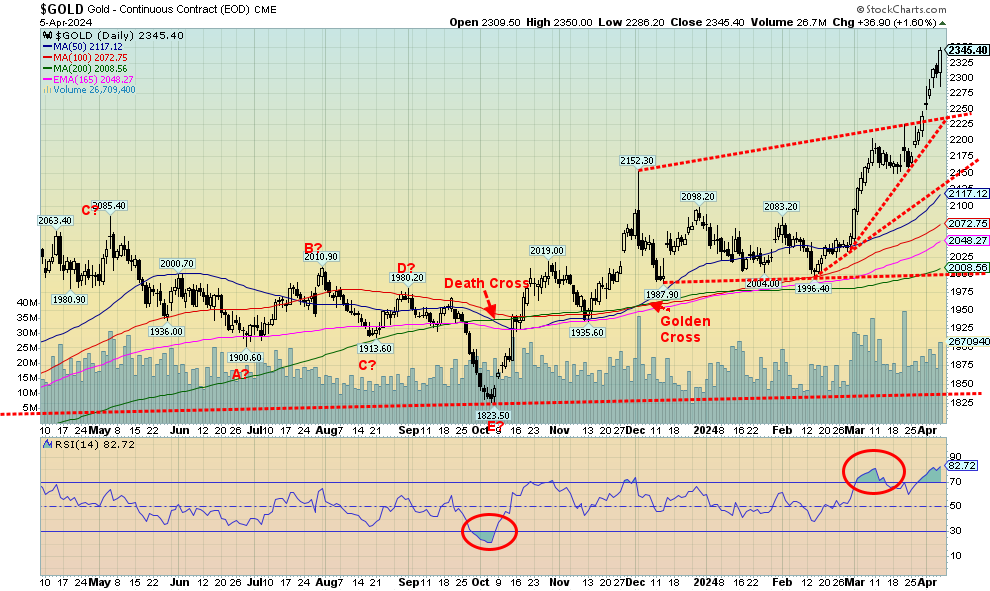
Source: www.stockcharts.com
The gold rush is just getting underway. Famous gold rushes exist. The two that stand out are the California Gold Rush of 1849 and the Klondike Gold Rush (Yukon) of 1896–1900 that made Dawson City famous. A few people got obscenely rich. Most didn’t and died paupers. And then there were the gold rushes that turned into pixie dust. Remember Bre-X? There is also fool’s gold (pyrite) and gold-plated titanium bars. If there was ever a sector full of con men, gold makes their eyes glaze over and there is a sucker born every minute. But man goes crazy over gold—in the Treasure of the Sierra Madre Fred C. Dobbs, played by Humphery Bogart, went mad because he thought his partners were stealing his gold.
The gold rush may just be getting underway. Hedge funds have returned to the sector. Gold still only makes up less than 5% of the world’s assets. The generalists are still not in as their attention remains with AI and Bitcoin. But gold has been currency and money since around 5000 BCE. The gold solidus was the currency of the late Roman Empire and the Byzantine Empire.
Global geopolitical tensions, central bank buying, massive unsustainable global debt, rising demand, particularly in Asia/China, and domestic political tensions with the upcoming U.S. elections are the fundamentals behind the rise in gold prices. None are going away anytime soon and all are threatening to get worse. Gold is what you buy when everything else is going to rat sh*t.

A gold treasure from Tomb Seven Monte Alban, Oaxaca, Mexico. Now in the Museum of the Santo Domingo Cathedral, Oaxaca, Mexico. Photo by David Chapman
This past week gold rose 4.8% and is now up 13.2% on the year, outpacing the S&P 500 and the TSX. Silver finally came alive and was up 10.4% and now up 14.2% in 2024. Even platinum woke up a bit, gaining 2.1%. The near precious metals were mixed as palladium fell 1.4% but copper rose 5.8%. Copper has also broken out as the need for copper rises (coupled with a not-growing supply and potential for shortages). The gold stock indices came alive and the Gold Bugs Index (HUI) was up 7.3% while the TSX Gold Index (TGD) gained 6.9%.
But the real moves are most likely in the junior gold mining sector, along with the junior gold exploration stocks. We saw major gold rushes in those sectors in 2001–2003, 2005–2007, and 2009–2011. Here the junior exploration stocks exploded 3X, 5X, some 10X, and even more. The last little rush was in 2020–2021, but that faded and the sector has been unloved, unowned, and extremely depressed. When it comes alive, as it appears to be in the early stages of doing, the moves can be explosive. The only people in those sectors even now are the die-hards who, if they haven’t hung themselves, were poised to raise a glass of poison as they watched the AI stocks and Bitcoin (meme stocks too) soar into the stratosphere while their stocks went lower and lower—so low that some were trading for less than cash in the bank. Many have struggled to raise funds for drilling. No broker will touch them. No bank will touch them. They are poison. But that is about to change.
We noted the massive decade long cup and handle pattern that suggests gold could rise as high as $3,000 possibly higher. The 1980 high is still the benchmark and, on an inflation-adjusted basis, that level is at $2,700 on a close basis and based on the high over $3,000.
The gold rush of 2024 is just getting underway and, if history is any guide, it may last at least 2–3 years.
Source: www.stockcharts.com
Silver is finally catching a bid. Silver this week finally took out $26, a point we had noted as a potential breakout, and is now threatening to break out over $27.50, the high of 2022. It’s a matter of when, not if. The huge triangle formed following the high of 2021, coupled with what looks like a head and shoulders reverse pattern, suggests that silver should rise at minimum to $39/$40. Higher potential is there from the massive cup and handle formation that formed from 1980 to the present, suggesting at minimum a rise to over $70. Suggestions that silver could rise to $150 are still just that—a suggestion. But, we note, don’t laugh—the inflation-adjusted 1980 high came in at $142 on a close basis in February 1980. So, $150 is not impossible. With the breakout in silver, those that find gold expensive may switch their attention to the poor man’s gold—silver. Silver has been money/currency for centuries. There was a time remembered by a few of us when the dimes, quarters, 50-cent pieces, and $1 coins were made of silver—okay, 80% silver. Ergo, that’s why even junk silver coins are valuable. 1967–1968 saw the last issue of silver coins in Canada. The coins were debased using nickel and copper, but mostly nickel. That 1967 silver coin is worth something. Today’s coins are worth not so much—okay, what the government tells you it’s worth. That reminds us how the Romans also debased the silver denarius in order to print money to pay for their endless wars. From Nero onwards, they constantly debased their silver coins and by the third century there wasn’t much left. The debasement of the silver denarius mirrored the decline of the Roman Empire. Do we face the same fate?
While funds are just starting to buy silver and particularly silver stocks, oddly enough the commercial COT is not reflecting the case. The commercial COT is at 28%, well below the 40% plus we prefer to see, so we know the commercials are bullish. However, we recall the commercial COT remained low during the 2009–2011 bull market. Still, we like the look of silver right now and believe the upward move is just getting underway. The gold/silver ratio is still exceptionally high at 85.3. In 2011 at the market high the ratio was 31.5, a level that would imply gold currently as it is at $2,345 and silver near $75. The gold/silver ratio in nature is at 17.5, implying silver should be at $135. In 1792, the U.S. government set the ratio at 15:1, suggesting today that silver should be at $155. Silver has considerable room to move higher.
,4003Source: www.stockcharts.com
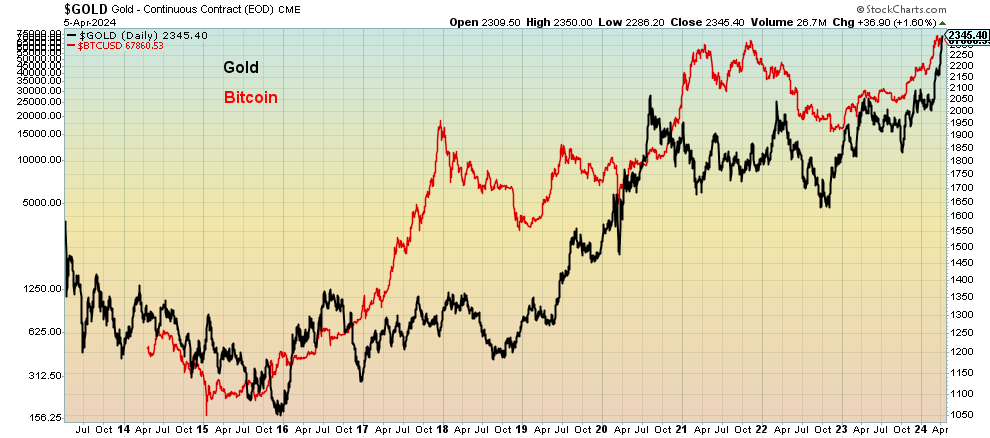
Tom McClellan of McClellan Financial Publications (www.mcoscillator.com) noted recently how gold and Bitcoin appear to be tracking each other. This is strictly a visual of the two. And the correlation definitely is not perfect as there is a time to own Bitcoin and a time to own gold. The magnitudes certainly don’t match (gold is up a modest 50% during the period while Bitcoin is up a whopping 13,605%) as Bitcoin has outperformed gold since Bitcoin got underway in 2014; however, the directions do have a certain sameness, particularly in the past few years. Merely a footnote to gold’s recent rise. Now if only gold would match Bitcoin in terms of magnitude. Bitcoin is up almost 61% so far in 2024. If gold had matched that, gold would be trading now north of $3,400. Nonetheless, the comparison is something to consider.
Source: www.stockcharts.com
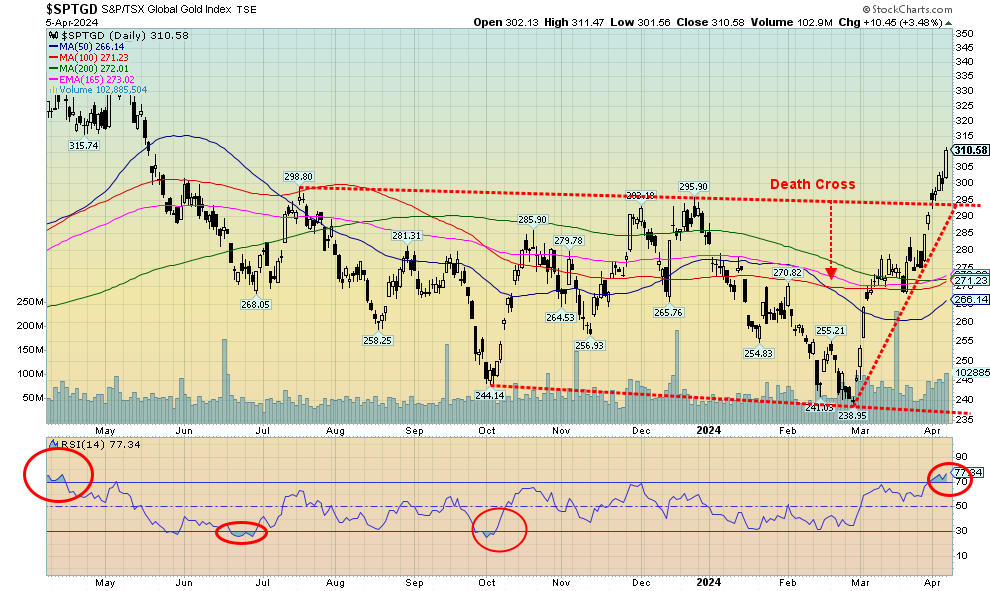
And, just like that, gold stocks are suddenly onside for 2024 after being down on the year and looking like the dregs of the century. With gold making new all-time highs and silver threatening a major upside breakout, the gold stocks are catching a bid. We even saw a few junior exploration stocks suddenly look alive after being dead, or at least perceived dead. The TSX Gold Index (TGD) jumped another 6.9% this past week and is now up 9.1% on the year. The Gold Bugs Index (HUI) added 7.3% and is up 9.0% in 2024. The often-overlooked Philadelphia Gold and Silver Index (XAU) also came alive, gaining 7.4% this past week and up 8.7% in 2024. All that compares favourably with the S&P 500 that is up 9.1% so far. The major difference is that the SPX is at all-time highs and the gold and silver indices are nowhere near their all-time highs. Which one has more potential at this point?
But before we get too excited, we note that the dailies are becoming overbought with an RSI above 70 while the weeklies and monthlies have room to move higher. The Gold Miners Bullish Percent Index (BPGDM) is now at 71. Once we get over 75, we are in overbought territory. The highest we’ve ever seen is 100 back in 2020–2021 when gold and gold stocks soared out of the pandemic. Another reminder is that the TGD is still down 32% from its all-time high seen in 2011 while the HUI is down a whopping 58%. That tells us if we are really catching a bid here the potential remains huge, as to get back to those highs the TGD would have to gain 47% while the HUI would need to pick up 141%. As we’ve so often noted, the gold universe is small. Even a small allocation of funds to the sector is kind of like trying to push the Pacific Ocean through a garden hose.
The TGD is now over 300 with potential targets up to 355 as a minimum. The HUI could rise to 310–315 as a minimum. Still a way to go. As we noted, we are also seeing a bit of a bid on some of the junior exploration stocks so those with a speculative bent can look at them. But remember, all juniors are not created equally. They are just starting what might be a very powerful rise and, like tech stocks and crypto, it can get crazy as it goes higher.
With overbought conditions we might get pullbacks, but from the looks of this an historic rise appears to be underway. Despite the recent rise, the gold stocks remain cheap vis-à-vis gold.
Gold in Selected Currencies
Source: www.stockcharts.com
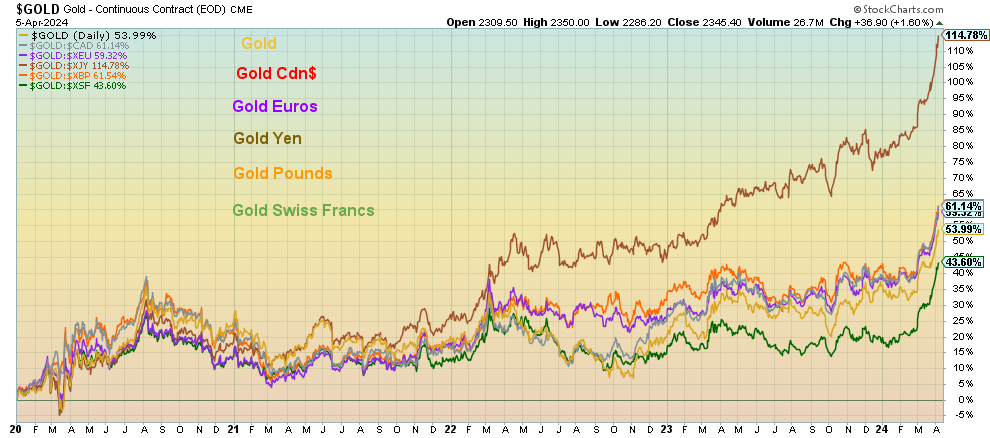
We’ve often noted that gold and silver are a currency (it’s even legal tender in some jurisdictions, notably a number of U.S. states such as Texas). If gold is rising, gold should be rising in all currencies. Or, to put it another way, the fiat currencies are losing value as gold (and silver) rise. Here is the proof since 2020 as gold in Japanese yen has led the way, up 115%. Gold in Cdn$ is up 61%, gold in euros up 59%, gold in Swiss francs up about 44%, and gold in pound sterling up about 62%. Gold itself is up roughly 54% since 2020. Gold’s gains in lesser currencies are even more dramatic. Gold protects purchasing power even as the purchasing power of the fiat currency deteriorates.
Source: www.stockcharts.com
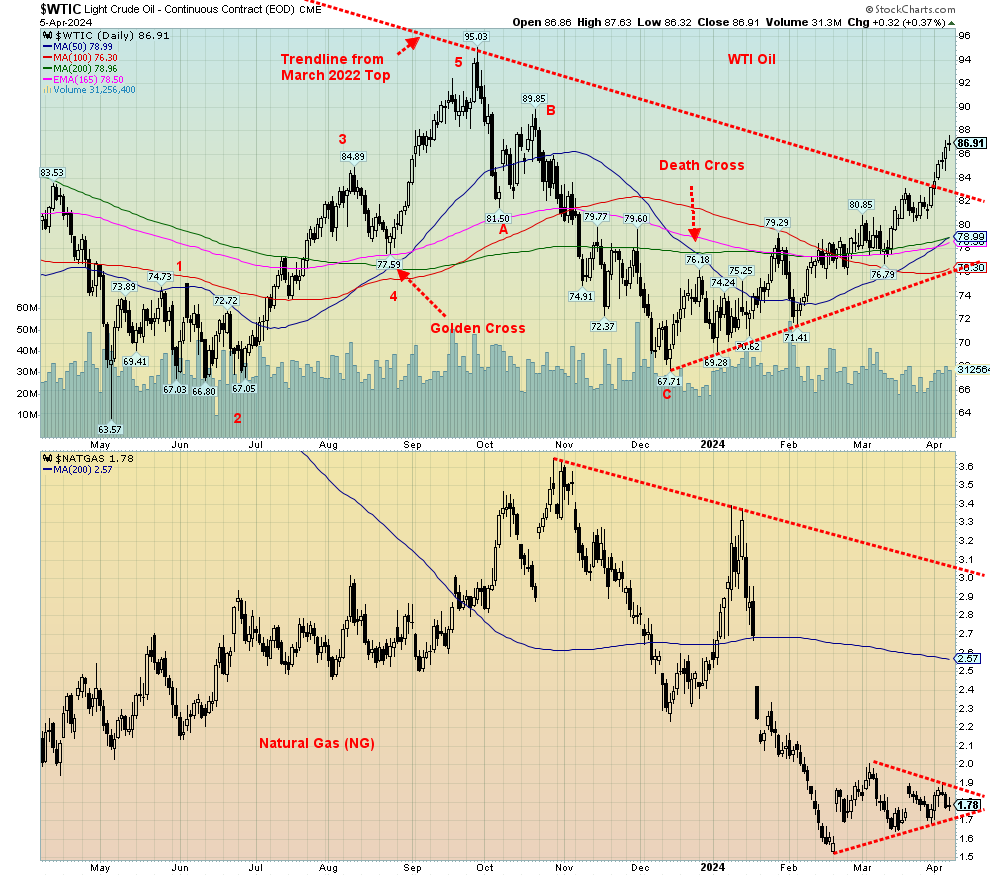
If gold is the fear, oil is the consequence. This past week WTI oil cleared $84 while Brent crude surpassed $90. Both WTI and Brent gained 4.5% on the week. We had noted earlier how the energy stocks had been jumping to all-time highs, forecasting an expected rise in the price of oil. Now oil is breaking out. The Arca Oil & Gas Index (XOI) added 5.2% this past week while the TSX Energy Index (TEN) was up 5.8%. Both soared to new all-time highs.
Many factors are in play here—the potential for Iran to strike back against Israel after the Israeli attack on the Iranian consulate in Damascus, the potential for an expansion of the Russia/Ukraine war as each pound their energy infrastructure, Mexico cutting back on exports, and OPEC continuing with their cuts. The U.S. is also trying to tighten sanctions against Iranian oil tankers, another potential source of conflict. While U.S., the world’s largest oil producer, can make up some of the difference they can’t cover it all by any means, particularly if the Iran/Israel spat spread to a disruption of the Straits of Hormuz where 30% of the world’s oil flows through. Canada can add as well, but both the U.S. and Canada together would be unable to make up any major disruption. Add in continued sanctions against Venezuela’s oil industry and the potential for oil prices to soar is real.
The breakout of WTI oil has potential minimum targets up to $110. Even higher potential is also visible. Natural gas (NG) could be making an important low as the forming bottom triangle suggests a break to the upside. NG at the Henry Hub was up a small 1.1% this past week, but EU NG at the Dutch Hub fell a small 2.7%. But, as we noted, oil stocks are leading and even NG stocks are rising as well. Crude oil stocks for the Strategic Reserve of the U.S. are rising off lows, but have considerable room to grow to reach previous high levels.
Oh, and need we mention that the U.S. sees a potentially active hurricane season. That could translate into major disruptions of the Gulf of Mexico and major refineries along the U.S. coast stretching from Louisiana through Texas. Finally, we read that Myanmar rebels are disrupting Chinese crude supplies as some have seized territory not far from PetroChina refineries in the deep southwest of China. The beat goes on. Oil and probably NG prices are going to go higher. All that would translate into higher prices at the pump and for North Americans heating their homes. The consequence of conflict.
Copyright David Chapman 2024
GLOSSARY
Trends
Daily – Short-term trend (For swing traders)
Weekly – Intermediate-term trend (For long-term trend followers)
Monthly – Long-term secular trend (For long-term trend followers)
Up – The trend is up.
Down – The trend is down
Neutral – Indicators are mostly neutral. A trend change might be in the offing.
Weak – The trend is still up or down but it is weakening. It is also a sign that the trend might change.
Topping – Indicators are suggesting that while the trend remains up there are considerable signs that suggest that the market is topping.
Bottoming – Indicators are suggesting that while the trend is down there are considerable signs that suggest that the market is bottoming.
Disclaimer
David Chapman is not a registered advisory service and is not an exempt market dealer (EMD) nor a licensed financial advisor. He does not and cannot give individualised market advice. David Chapman has worked in the financial industry for over 40 years including large financial corporations, banks, and investment dealers. The information in this newsletter is intended only for informational and educational purposes. It should not be construed as an offer, a solicitation of an offer or sale of any security. Every effort is made to provide accurate and complete information. However, we cannot guarantee that there will be no errors. We make no claims, promises or guarantees about the accuracy, completeness, or adequacy of the contents of this commentary and expressly disclaim liability for errors and omissions in the contents of this commentary. David Chapman will always use his best efforts to ensure the accuracy and timeliness of all information. The reader assumes all risk when trading in securities and David Chapman advises consulting a licensed professional financial advisor or portfolio manager such as Enriched Investing Incorporated before proceeding with any trade or idea presented in this newsletter. David Chapman may own shares in companies mentioned in this newsletter. Before making an investment, prospective investors should review each security’s offering documents which summarize the objectives, fees, expenses and associated risks. David Chapman shares his ideas and opinions for informational and educational purposes only and expects the reader to perform due diligence before considering a position in any security. That includes consulting with your own licensed professional financial advisor such as Enriched Investing Incorporated. Performance is not guaranteed, values change frequently, and past performance may not be repeated.
About the author


Website: https://www.enrichedinvesting.com
Disclaimer: David Chapman is not a registered advisory service and is not an exempt market dealer (EMD) nor a licensed financial advisor. We do not and cannot give individualised market advice. David Chapman has worked in the financial industry for over 40 years including large financial corporations, banks, and investment dealers. The information in this newsletter is intended only for informational and educational purposes. It should not be considered a solicitation of an offer or sale of any security. The reader assumes all risk when trading in securities and David Chapman advises consulting a licensed professional financial advisor before proceeding with any trade or idea presented in this newsletter. David Chapman may own shares in companies mentioned in this newsletter. We share our ideas and opinions for informational and educational purposes only and expect the reader to perform due diligence before considering a position in any security. That includes consulting with your own licensed professional financial advisor.