
The big news of this past week was the potential end of the grain deal between Russia/Ukraine. This sparked a jump in wheat and grain prices. Food inflation already tops the list and this should add to it. For countries dependent on grain, inflation is the least of their worries. As if that wasn't bad enough the heat waves, fires, floods, droughts are all continuing and they too have a negative impact. All this leads us to looking at the commodity super cycle. We believe we could be on the cusp of the next leg up.
Inflation came down in Canada and the U.K. We look at that as well. But with food inflation so high this respite may be short lived. Silver has outperformed gold of late leading us to look once again at the Gold/Silver ratio as our chart of the week. The ratio continues to look like a huge top suggesting holding silver over gold might be a good idea.
Markets hit new highs again this past week but many reversed and closed lower. See the FAANGs. Is a top in? Can't tell that yet. Gold continues to consolidate below its next resistance zone and oil appears to be on the cusp of a breakout. All that fits with the commodity super cycle. PrairieSky Royalty Ltd., for example, which generates royalty production revenues as petroleum and natural gas are produced from its properties and pays a dividend, reported record quarterly average oil royalty production, increased quarterly funds from operations, and reduced net debt, is also held in the Canadian Conservative Growth Strategy.*
The big event for the upcoming week is the FOMC interest rate announcement on Wednesday at 2pm. Expectations are that the Fed will hike another 25 bp. But watch the speeches for clues as to whether this will be the last rate hike for some time.
Here in Toronto we are blessed with good weather. No heat wave, no floods, no wildfires. Others are not so lucky. Get out and enjoy the weather if your area is blessed. Have a great week!
DC
* Reference to the Canadian Conservative Growth Strategy and its investments, celebrating a 5-year history of strong growth, is added by Margaret Samuel, President, CEO and Portfolio Manager of Enriched Investing Incorporated, who can be reached at 416-203-3028 or msamuel@enrichedinvesting.com
“The one thing you can be quite sure of is if we went into some very major war, the value of money would go down—that’s happened in virtually every war that I’m aware of. The last thing you’d want to do is hold money during a war.”
—Warren Buffett, American business magnate, investor, philanthropist, Chairman and CEO Berkshire Hathaway, net worth of $117 billion, fifth richest person in the world, from an interview in 2014; b. 1930
“Anyone taken as an individual is tolerably sensible and reasonable - as a member of a crowd, he at once becomes a blockhead.”
—Friedrich Schiller, German physician, playwright, poet, philosopher, wrote with Johann Wolfgang von Goethe; 1759–1805
“I find more and more that it is well to be on the right side of the minority since it is always the more intelligent.”
—Johann Wolfgang von Goethe, German poet, playwright, novelist, scientist, statesman, theatre director, critic, influential writer, huge influence on literary, philosophical, and political thought through the 18th century to even today; 1749–1832
The Broken Grain Deal
Southern Europe, Southern U.S., North Africa, the Middle East, parts of Brazil, India, China, and Southeast Asia swelter in extreme high temperatures; droughts are prevalent in the Southwestern and Northwestern U.S., Northern Canada, and the Canadian prairies (also wildfires), Brazil, Central America, a swath of Africa through the Central African Republic to Sudan and Somalia; Central Asia, parts of China, Pakistan, Afghanistan and Iran, and Europe from Moldova and Ukraine through Central and Southern Europe; and extreme flooding has hit parts of Italy, Australia, South Korea, Nigeria, the U.S. Northeast and Nova Scotia in Canada. Record-breaking wildfires have plagued parts of Canada since the spring. Nature gone berserk.
And, in the midst of all of this, Russia has announced they are backing out of the U.N.-brokered wheat deal that allowed Ukraine to export grain across the Black Sea. Predictably, wheat and other grain prices jumped in response, even as many are unsure of what it will all mean. Russia and Ukraine account for nearly 30% of global wheat production and upwards of 30% of global wheat exports. Russia is also a major supplier of fertilizer. Both countries provide significant supplies of other grain products such as barley. The hang-up is Western sanctions that have seen a major Russian agricultural bank blocked from the U.S.-dominated SWIFT payments system. That in turn has negatively impacted insurance and financing of Russian wheat exports. As well, an ammonia pipeline that has been damaged by the war has been blocked. Russia wants it unblocked.
Ships have been piling up trying to get through the Bosporus Straits, an important global choke point between the Black Sea and the Sea of Marmara. Even at that, there is one more choke point to get through to the Mediterranean Sea through the Dardanelles Strait. Both are controlled by Turkey. Turkey was a key driver behind the wheat deal. In response to the bombing of the Kerch Bridge between Russia and Crimea, the key port of Odessa, a major shipping port for Ukrainian wheat, has been bombed. The war escalates.
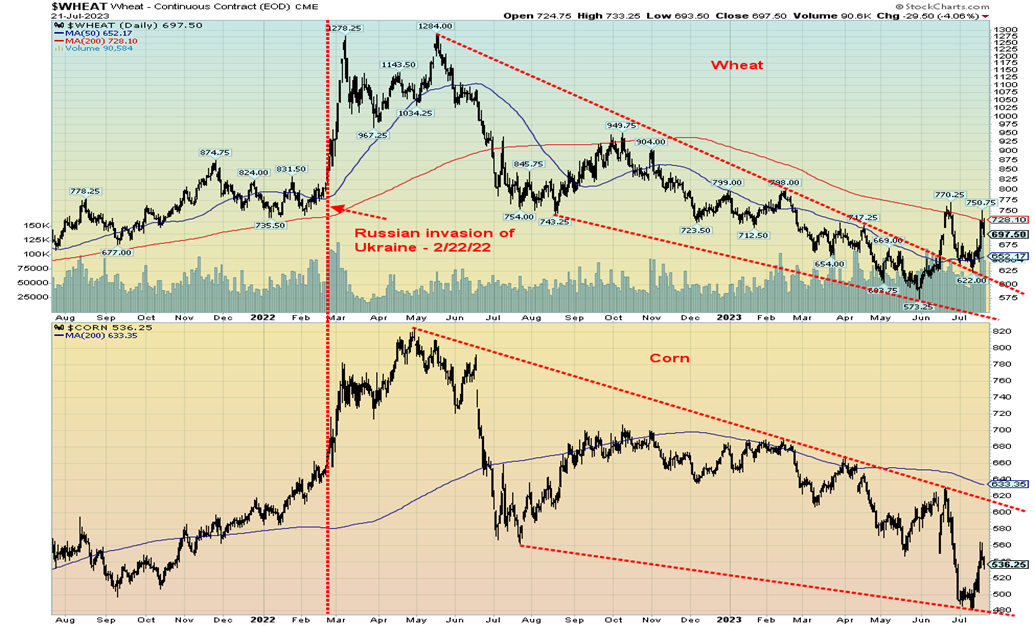
When the war broke out in February 2022, wheat and corn, along with other grain products, soared in price (see chart). Soaring grain prices have a global impact. But with brokered shipping deals in place, the price of wheat and corn have collapsed in price and are currently lower than they were in February 2022. The announcement of the potential end of the wheat deal has seen grain prices jump. In addition to grain prices rising, other commodities such as oil and gold have also been rising. Rising food prices along with shortages are impacting inflation globally and causing potential famines, particularly in East Africa, which imports some 80% of their grain needs.
The end of the wheat deal, if enforced by Russia, could be a game changer. There will now be safety concerns in the Black Sea, especially if Russia blocks traffic in and out of Ukrainian ports. Higher shipping costs could also result, which in turn could deter many from even trying to get in to the Black Sea. In bombing the key port of Odessa, it appears strikes have already destroyed some 60,000 tonnes of grain. A naval blockade of the port is also being set up. Possibly Russia itself will make up some of the shortfall and other countries may step up (U.S., Canada, Argentina, and others) if they can. Ukraine could ship overland, but that’s long and expensive. Calls are for the U.S. to send in warships to the Black Sea. But that in turn could set up a clash with Russia and the likelihood of that happening is remote.
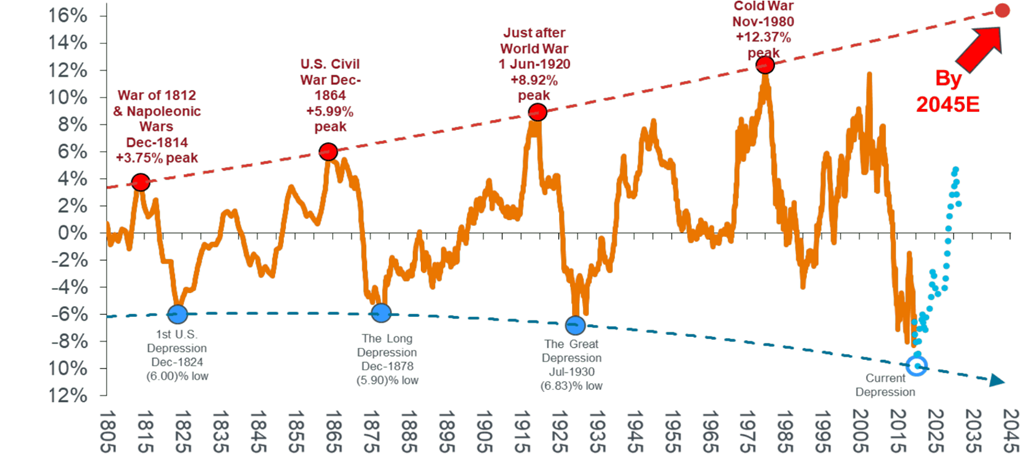
This has many talking about the potential for a commodity super-cycle. Since 1790, four commodity super-cycles have been identified, according to the chart below. Not surprisingly, they are usually associated with wars. Peaks were seen coinciding with the War of 1812 and the Napoleonic Wars, the U.S. Civil War of the 1860s, World War I, and the Cold War peak, along with the Arab oil embargo and Iranian hostage crisis in the 1970s. Wars creates an increase in demand. Today, add in droughts, floods, heat waves, wildfires, sanctions, and supply disruptions, and you have a combustible recipe for sharply rising prices along with famines.
While the chart on the next page shows four commodity super-cycles, it is really more like six. Two not marked on the above chart include the cycle that generally coincided with World War II, the post-war boom, and the Korean war. That cycle peaked in the early 1950s after the end of the Korean War. The second one coincided with the so-called war on terror that included the invasions of Afghanistan and Iraq. That cycle peaked in 2008.
Commodity Super-Cycles 1790–
Source: www.glowlit.com, www.stifel.com, www.newworldeconomics.com, www.refinitiv.com
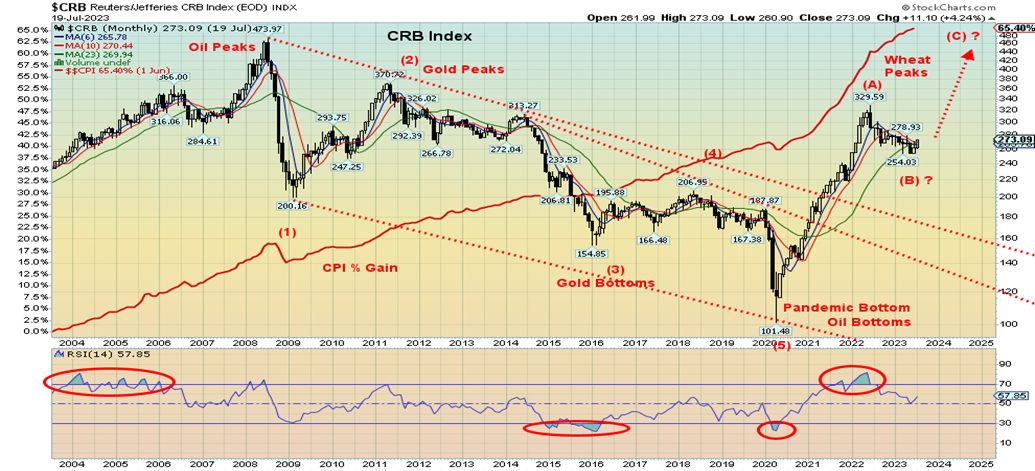
CRB Index 2004–2023
Source: www.stockcharts.com
Since then, the CRB Index has broken out. The first wave out peaked in June 2022, generally coinciding with the Russian/Ukraine wheat deal and a wheat price top. Commodities have generally been falling in price ever since, but are now showing signs we may be prepared to break out once again. Commodity prices have been quite depressed, particularly during the period 2015 to 2020. Some called it a commodity depression.
For the record, the CRB Index, or more properly the Commodity Research Bureau Index, is an indicator of global commodity prices. The index is comprised of 19 commodities in four sectors: energy, agriculture, precious metals, and industrial metals. Components include crude oil, natural gas, heating oil, unleaded gas, cocoa, coffee, corn, cotton, lean hogs, live cattle, orange juice, soybeans, sugar, wheat, gold, silver, copper, aluminum, and nickel.
Wheat and Corn 2021–2023
Source: www.stockcharts.com
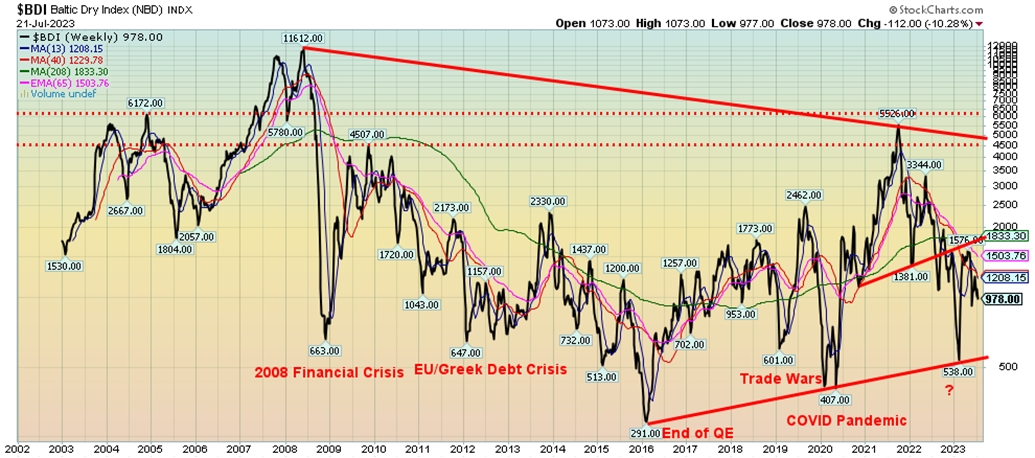
Baltic Dry Index 2003–2023
 As we can see, commodity super-cycles are not unusual. Each cycle lasted roughly 25–35 years. That, as the chart suggests, may not see its peak until 2045 or even later. But, as our chart of the CRB Index above (2004–2023) shows, different commodities peak and bottom at different times. Our backdrop for the commodity super-cycle is the war between Russia and Ukraine, along with the natural climate disasters that have become prevalent. But the war is not just limited to the shooting one between Russia and Ukraine as a new cold war that also includes China is also upon us. It’s a cold war that, in a worst-case scenario, could turn into World War III. At that point we’d have a commodity cycle on steroids—in other words, a commodity super-bubble.
Inflation
Both Canada and the U.K. reported a drop in inflation for June. They join the U.S. who earlier reported a drop in inflation. Canada is now reporting the lowest inflation in the G7.
Canada – Inflation and Core Inflation 1998–2023
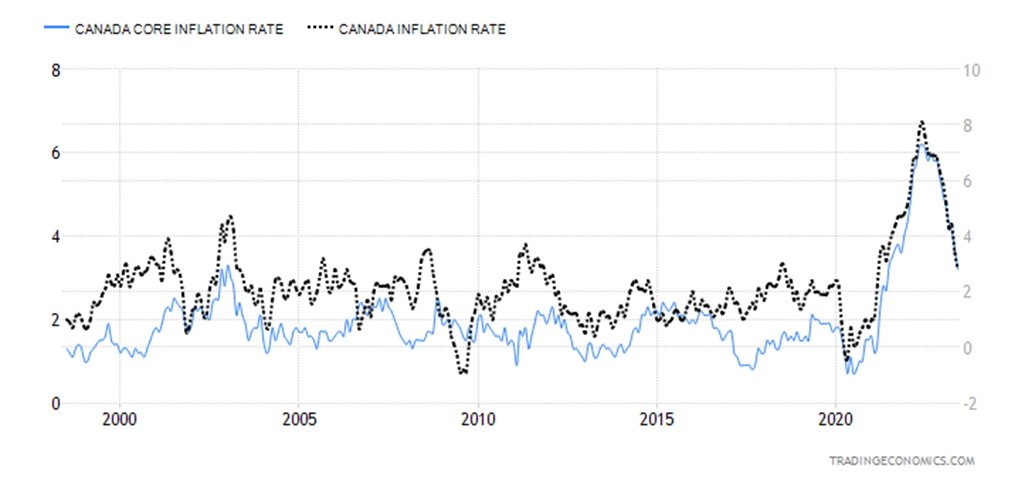
Source: www.tradingeconomics.com, www.statcan.gc.ca
The U.K. fared worse as they remain the highest in the G7 at 7.9%, down from 8.7% a month earlier and below expectations of 8.2%. But, as with Canada, core inflation remains sticky, coming in at 6.9%. That was also below expectations of 7.1%. With the drop in inflation for Canada, Canada now has the lowest inflation rate in the G7.
Maybe we should all be thankful that we are not Venezuela with an inflation rate last reported at 404%, the highest in the world. Despite the drop, nobody should be complacent. Oil prices have started to rise again and threaten to break out. That could eventually feed into the inflation rate and, instead of it falling further, prices could rise once again. The breakdown of the wheat deal is an unknown factor, but food prices could take another hit.
United Kingdom (U.K.) Inflation Rate 1998–2023
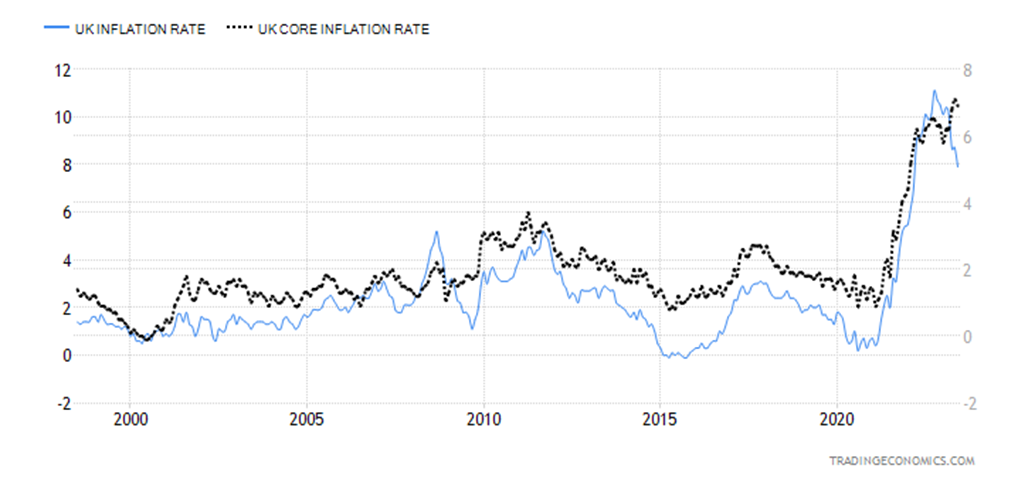
Source: www.tradingeconomics.com, www.ons.gov.uk
Chart of the Week
Gold/Silver Ratio 1970–2023
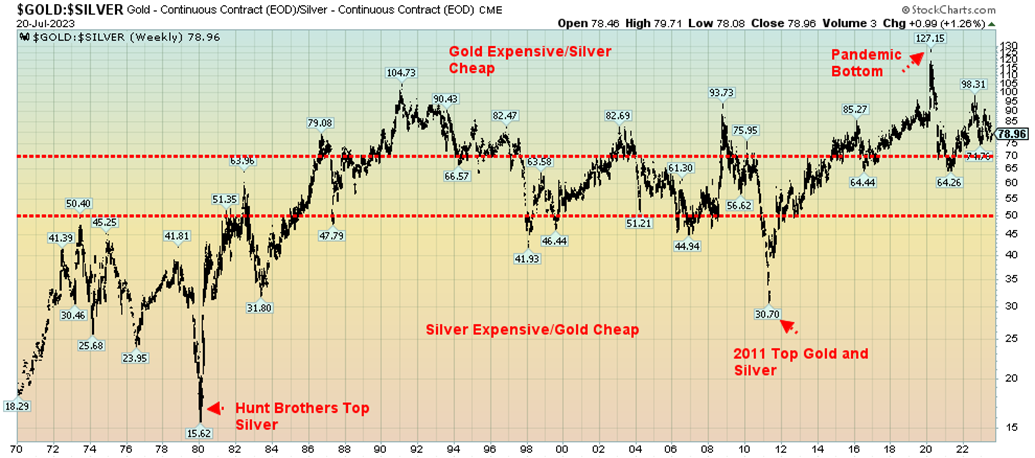
Source: www.stockcharts.com
No, that’s not a barn buster, but for silver enthusiasts it is an improvement. For the past several years, silver has underperformed gold. The ratio hit a high of 127.15 at the peak of the pandemic in March 2020. Since then, it has come down, but by many measurements it remains exceedingly high. One has to put aside the fact that in nature the ratio is 19 and historically has been considered at 15. The last time we saw that was at the historic peak in January 1980 when gold zoomed to $875 and silver hit $50 during the Hunt Brothers mania of the late 1970s. It also coincided with the commodity super cycle peak. The ratio hit a low of 15.62. Thus today’s 78.96 seems by many measurements to be ridiculous. Even at the 2011 top for gold and silver the ratio had fallen then to 30.7.
Back in ancient times (Greek/Roman) they often set a gold/silver ratio. The ratio fluctuated between 10 to 15. In Ancient Egypt it was 2.5. U.S. Congress passed the first Coinage Act in 1792 and set the ratio at 15. However, by 1834 they bumped it to 16. The price of gold at the time was fixed at $20.67. Today that price is equivalent to around $750. Inflation has eroded the value of dollar. By that measurement, someone who has held an ounce of gold since even 1971 when we went off the gold standard has done quite well.
What’s driving silver? From Trading Economics (www.tradingeconomics.com) we quote:
“Silver surged toward $25 per ounce in July, the highest in two months, amid weakness in the dollar, concerns of low supply, and stronger industrial demand. Efforts to curb carbon emissions magnified the effect of evolving solar panel technologies that need higher conduction needs to underpin sharp upgrades in forecasts of silver demand. Solar panel companies are expected to make up 14% of global silver consumption, compared to 5% in 2014, and driving an expected 4% increase in consumption this year. The figure compares to a slower 2% rise in output, flagging fresh deficit concerns and driving silver to outperform gold since the start of the month. In the meantime, regulatory changes in Mexico will make it harder for mining giants to be rewarded mineral concessions, threatening companies to reduce investments in new projects and jeopardizing output from the world’s top producer. The metal was also supported by soft inflation data in the US, paring hawkish expectations for the Fed.”
Silver guru Ted Butler wrote recently on SilverSeek (www.silverseek.com), posting an article titled “Code Red” (https://silverseek.com/article/code-red). It centers around potentially huge short positions in silver with the iShares Trust (SLV) and a rise in the commercial COT, indicating that there is growing interest in silver. Butler believes the build-up could indicate a volatile move to the upside for silver, even if it pulled back at first.
The gold/silver ratio has some work to do, even as the recent improvement in the ratio is welcomed. We need to break under 70 and under that last low seen at 64.26 to convince us we are on our way. If a bull market is getting underway for gold and silver, it is key that silver leads the way. Silver has tendency to lead both up and down. There has been considerable pick-up in silver stocks of late as well.
Having a bit of gold in one’s portfolio does act as ballast for the portfolio. But maybe some silver could help as well. Silver coins, we admit, are expensive. A check of SilverGoldBull (www.silvergoldbull.ca) indicates that a one-ounce Canadian silver maple sells for $41.17. That’s a 25.6% premium to spot silver in Canadian dollars. A one-ounce gold maple sells for $2,770, a 6.6% premium to spot gold in Canadian dollars. Silver remains in high demand and there are shortages in warehouses and production. All that should help the gold/silver ratio to improve in silver’s favour.
Silver bugs are pleased with the recent decline in the gold/silver ratio. Many have felt that the ratio has been overvalued in gold terms for years and silver is seriously undervalued. But even the recent improvement is insufficient to say that the ratio has topped.
Markets & Trends
|
|
|
|
% Gains (Losses) Trends |
|
||||
|
|
Close Dec 31/22 |
Close Jul 21, 2023 |
Week |
YTD |
Daily (Short Term) |
Weekly (Intermediate) |
Monthly (Long Term) |
|
|
Stock Market Indices |
|
|
|
|
|
|
|
|
|
S&P 500 |
3,839.50 |
4,536.34 (new highs) |
0.7% |
18.2% |
up |
up |
up |
|
|
Dow Jones Industrials |
33,147.25 |
35,227.69 (new highs) |
2.1% |
6.3% |
up |
up |
up |
|
|
Dow Jones Transport |
13,391.91 |
16,232.34 (new highs) |
2.6% |
21.2% |
up |
up |
up |
|
|
NASDAQ |
10,466.48 |
14,032.81 (new highs) |
(0.6)% |
34.1% |
up |
up |
up |
|
|
S&P/TSX Composite |
19,384.92 |
20,547.51 |
1.4% |
6.0% |
up |
up |
up |
|
|
S&P/TSX Venture (CDNX) |
570.27 |
616.66 |
(1.9)% |
8.2% |
up (weak) |
up |
down |
|
|
S&P 600 (small) |
1,157.53 |
1,256.75 |
1.6% |
8.6% |
up |
up |
up (weak) |
|
|
MSCI World |
1,977.74 |
2,179.99 (new highs) |
(0.1)% |
11.2% |
up |
up |
up (weak) |
|
|
Bitcoin |
16,531.31 |
29,876.39 |
(0.9)% |
80.7% |
up |
up |
neutral |
|
|
|
|
|
|
|
|
|
|
|
|
Gold Mining Stock Indices |
|
|
|
|
|
|
|
|
|
Gold Bugs Index (HUI) |
229.75 |
244.00 |
(1.1)% |
6.2% |
up |
up (weak) |
down (weak) |
|
|
TSX Gold Index (TGD) |
277.68 |
289.19 |
(1.0)% |
4.2% |
up (weak) |
neutral |
down (weak) |
|
|
|
|
|
|
|
|
|
|
|
|
% |
|
|
|
|
|
|
|
|
|
U.S. 10-Year Treasury Bond yield |
3.88% |
3.84% |
0.3% |
(1.0)% |
|
|
|
|
|
Cdn. 10-Year Bond CGB yield |
3.29% |
3.41% |
1.2% |
3.7% |
|
|
|
|
|
Recession Watch Spreads |
|
|
|
|
|
|
|
|
|
U.S. 2-year 10-year Treasury spread |
(0.55)% |
(1.01)% |
(7.5)% |
(83.6)% |
|
|
|
|
|
Cdn 2-year 10-year CGB spread |
(0.76)% |
(1.17)% |
9.3% |
(54.0)% |
|
|
|
|
|
|
|
|
|
|
|
|
|
|
|
Currencies |
|
|
|
|
|
|
|
|
|
US$ Index |
103.27 |
100.80 |
1.2% |
(2.4)% |
down |
down |
up (weak) |
|
|
Canadian $ |
73.92 |
75.79 |
flat |
2.5% |
up |
up |
down (weak) |
|
|
Euro |
107.04 |
111.27 |
(0.9)% |
4.0% |
up |
up |
neutral |
|
|
Swiss Franc |
108.15 |
115.46 |
(0.4)% |
6.8% |
up |
up |
up |
|
|
British Pound |
120.96 |
128.60 |
(1.8)% |
6.3% |
up |
up |
neutral |
|
|
Japanese Yen |
76.27 |
70.55 |
(2.0)% |
(7.5)% |
neutral |
down |
down |
|
|
|
|
|
|
|
|
|
|
|
|
|
|
|
|
|
|
|
|
|
|
Precious Metals |
|
|
|
|
|
|
|
|
|
Gold |
1,826.20 |
1,966.60 |
0.1% |
7.7% |
up (weak) |
up |
up |
|
|
Silver |
24.04 |
24.85 |
(1.4)% |
3.4% |
up |
up |
up (weak) |
|
|
Platinum |
1,082.90 |
972.20 |
(1.2)% |
(10.2)% |
neutral |
down (weak) |
down (weak) |
|
|
|
|
|
|
|
|
|
|
|
|
Base Metals |
|
|
|
|
|
|
|
|
|
Palladium |
1,798.00 |
1,286.50 |
1.6% |
(28.5)% |
down (weak) |
down |
down |
|
|
Copper |
3.81 |
3.82 |
(2.8)% |
0.3% |
up |
neutral |
neutral |
|
|
|
|
|
|
|
|
|
|
|
|
Energy |
|
|
|
|
|
|
|
|
|
WTI Oil |
80.26 |
77.07 |
2.2% |
(4.0)% |
up |
neutral |
neutral |
|
|
Nat Gas |
4.48 |
2.71 |
6.7% |
(39.5)% |
up |
down (weak) |
down |
|
Source: www.stockcharts.com
New highs/lows refer to new 52-week highs/lows and, in some cases, all-time highs.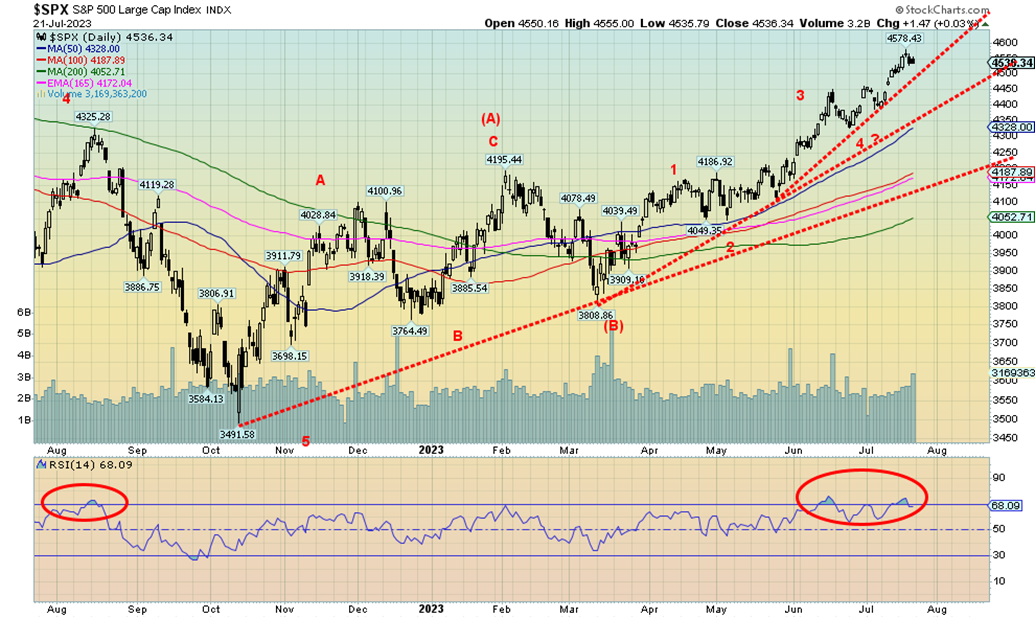
Source: www.stockcharts.com
Once again, markets put in 52-week highs. However, it wasn’t unanimous. The S&P 500 (SPX) made new highs, gaining 0.7% on the week. The Dow Jones indices also made new highs with the Industrials (DJI) up 2.1% and the Transportations (DJT) up 2.6%. As they say, the indices are confirming each other and that in turn confirms the bull market. The NASDAQ also made new 52-week highs but then closed down 0.6%. We discuss that further under our NASDAQ commentary. The NY FANG Index followed the NASDAQ lower, also making new highs, but then it lost 3.3%. Is the bloom coming off the big AI stocks that have led this market up? The smaller indices haven’t yet made new highs. The S&P 400 (Mid) gained 1.2% and the S&P 600 (Small) was up 1.6%. Over at the Russell indices, the Russell 2000 (Small) did not see new highs but it did gain 1.5%. The Russell 1000 was up 0.8% and new highs, while the Russell 3000 gained 0.7% also to new highs. Remember these are all 52-week highs, not all-time highs that were seen back in November 2021 to January 2022.
In Canada, the TSX Composite gained 1.4% but the TSX Venture Exchange (CDNX) lost 1.9%. Overseas in the EU, the London FTSE gained 3.1%, the EuroNext was up 0.5%, the Paris CAC 40 gained 0.8%, and the German DAX was up 0.5%. In Asia, China’s Shanghai Index (SSEC) fell 2.2%, the Tokyo Nikkei Dow (TKN) lost 0.3%, while Hong Kong’s Hang Seng (HSI) lost 1.7%. The MSCI World Index (less the U.S.) made new 52-week highs but fell 0.1% on the week. Bitcoin stumbled, losing 0.9% on the week and closing under $30,000.
The SPX dailies have numerous negative divergences, including RSI, MACD, and CCI, but the weeklies and monthlies remain up. It’s only recently that the monthly MACD crossed to the upside. The rally remains intact. And we continue to believe that this is a B wave following the A wave decline that occurred from January to October 2022. Once this wave tops, we should begin the more dangerous C wave to the downside. A top could occur anywhere from now to October. Bullish percent indices are currently at levels often associated with tops. Except we can’t determine yet whether this is another temporary top or a major top. Only a breakdown under the last weekly low could confirm a major top. For the SPX, that’s a breakdown under 3,800. Under 4,300 would confirm at least a temporary top. This bull is intact and that has many pundits declaring we are on a new great bull market.
That the market is overextended is not in question. At least a temporary top and pullback are needed to work off overbought levels. Our target for the SPX remains at 4,800, based on what appeared as a head and shoulders bottom formed through the October 2022 low from July to December. At this point we can only assume that this is just another consolidation before moving to new highs. Support is down to 4,300, then down to 4,000. Even a 5% pullback (not unusual) would only take us back to about 4,300.
Source: www.stockcharts.com
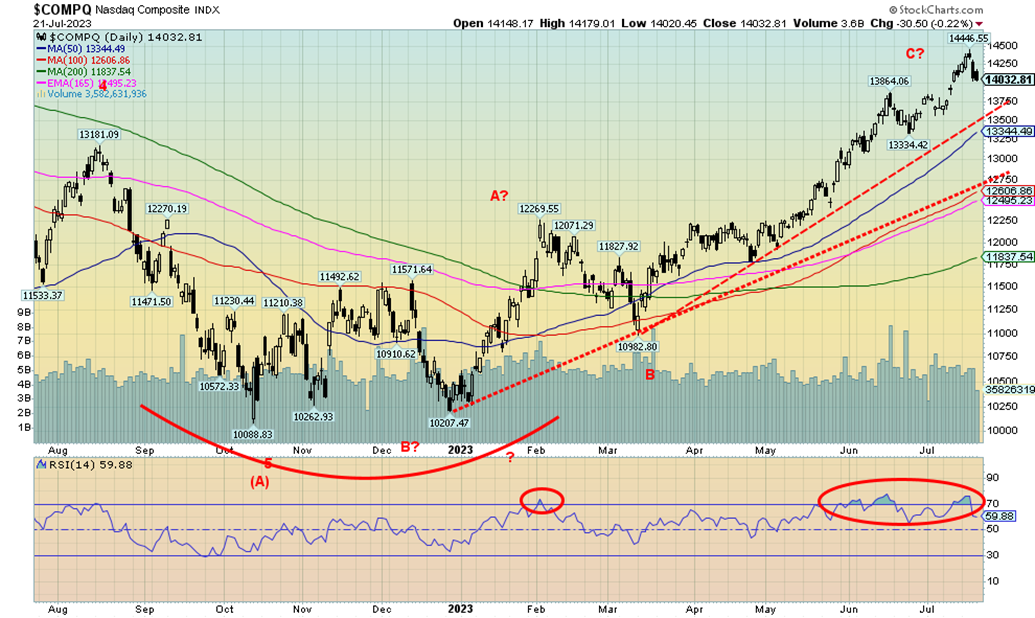
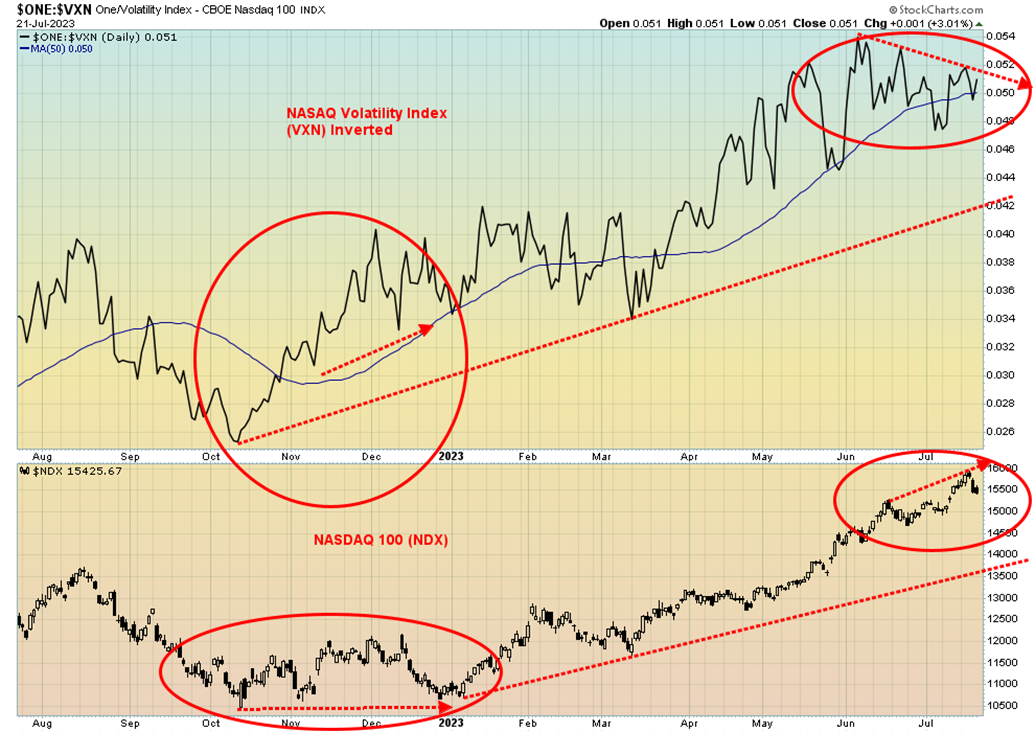
Is the NASDAQ topping? That question is valid, given that this past week the NASDAQ made fresh 52-week highs, then reversed and closed lower. The loss was only 0.6%, but it registered the reversal week that sometimes (not always) registers a top in the market. And it could merely be a temporary top. We’d have to break that last low at 13,334 to confirm a top. But we’d have to break down under 11,800 to confirm a major top. Still, at 18.5% over the 200-day MA, that is quite a spread. Back in November 2021 at the top for the NASDAQ, the spread was only 12.5%. This is worse. It was a week of reversals for a number of the FAANG stocks that have led the market higher. Making fresh 52-week highs and then reversing and closing lower were Meta, down 4.7% on the week, Netflix, off 3.3%, Microsoft, down 0.4%, and Tesla, down 7.6%. On the week, it was not pleasant for the FAANG stocks. The best performer was Apple, gaining 0.7% (and they are already the largest company in the world). The NY FANG Index also made new 52-week highs, then reversed and lost 3.3%. But, as we note, we are not at the point of confirming that a major top is in, let alone even a temporary top. We have negative divergences in indicators including the RSI, MACD, and CCI and we have a sell signal on the daily MACD but not on the weekly MACD. The monthly MACD for the NASDAQ only recently gave a buy signal. So mixed signals. Resolution should come over the next few weeks.
Source: www.stockcharts.com
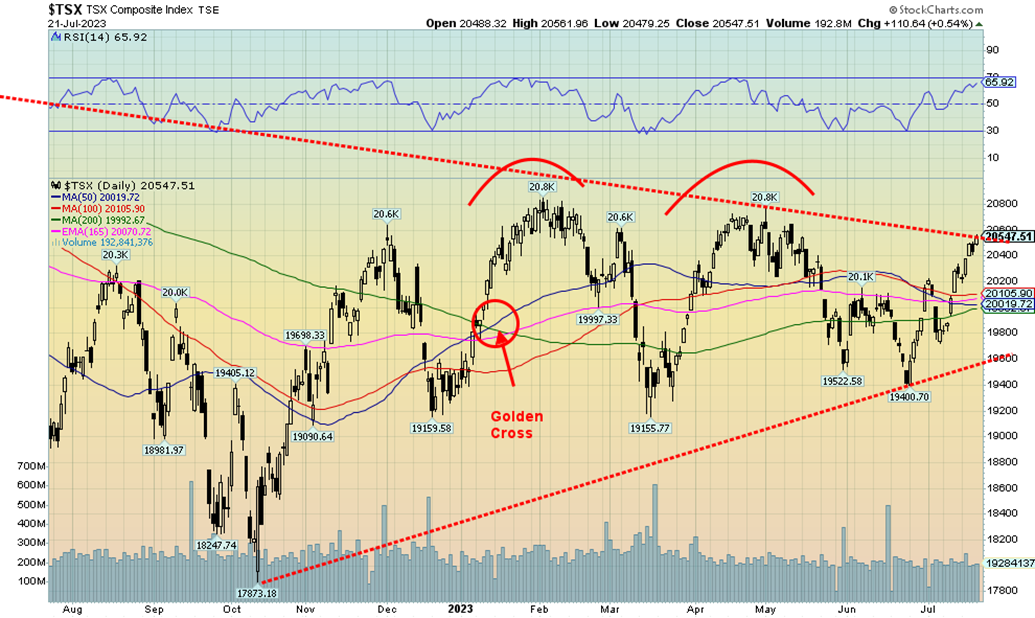
The TSX continues to be the weak sister of North American major indices. We believe that’s because of the dominance of the materials sector (includes golds, metals, energy, agriculture, etc.). This past week the TSX Composite gained 1.4% and is now testing the downtrend line from the top, even as it remains below the highs of January and April 2023. In the U.S., a number of the major indices have been making fresh 52-week highs. Not the TSX. The junior TSX Venture Exchange (CDNX) fell this past week, losing 1.9%. No joy there. Of the 14 sub-indices three fell. Leading the way was Metals & Mining (TGM), down 1.2%, while Golds (TGD) lost 1.0%. The other loser was Information Technology (TKK). It did see fresh 52-week highs, but then reversed and closed lower, losing 1.4%. Still, TKK remains up 40.2% on the year, the best-performing sector. But has it topped, given the reversal week? The leader on the week was Health Care (THC), up 4.3%, but then the sector is small. Other decent gains were seen by Energy (TEN), up 3.0%, while Financials (TFS) gained 2.5%. TFS and TEN are the two largest components of the TSX. Also making new 52-week highs was Consumer Discretionary (TCD), up 1.3%. As we note, the TSX appears to be on the verge of leaping its downtrend line. On the other hand, it could prove to yet another failure. A move back under 20,200 would suggest that top may be in. Only a good move to new highs and over 20,800 could convince that we are headed higher.
Source: www.stockcharts.com
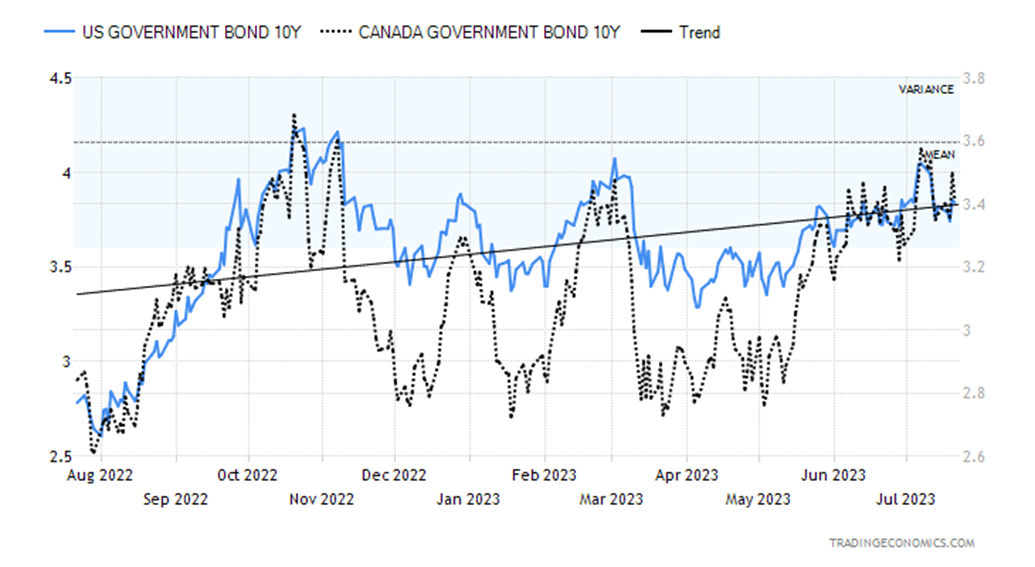
U.S. 10-year Treasury Bond/Canadian 10-year Government Bond (CGB)
Source: www.tradingeconomics.com, www.home.treasury.gov, www.bankofcanada.ca
The U.S. 10-year rose to 3.84% this past week from 3.83%, while the Canadian 10-year Government of Canada bond (CGB) also jumped to 3.41% from 3.37% the week before. The 2-year U.S. treasury note also rose to 4.85% from 4.75%, thus widening the 2–10 spread to 101 bp. In Canada, it was not the same as the 2-year Government of Canada bond fell to 4.58% from 4.66%; this is on the expectation that the BofC is finished hiking rates for the time being. The 2–10 spread was 117 bp, down from 129 bp the previous week. As we have often noted, a recession doesn’t usually occur until 6 to 12 months after the 2–10 spread bottoms. There is no sign yet that the 2–10 spread has bottomed.
All the talk is centered around how shallow any recession will be or that there may be no recession at all, despite weakness in Germany and the U.K. Southern Europe, like the U.S. South, is sweltering under record heat waves. These heat waves, droughts, and flooding have a huge economic cost. As well, there are the culture wars between those who believe man-made climate change exists and those who are climate change deniers.
Better than expected economic numbers contribute to thoughts that the Fed might not pause after this coming week’s FOMC. The NY Empire State Index came in at 1.1 vs. an expectation of negative 4.3. However, retail sales for June were weaker at +0.2% vs. an expectation of +0.3%. Industrial production for June was negative 0.5% when they expected flat; housing starts fell 0.8%, although that was slightly better than the expected falling of 10.2%; the Philly Fed was negative 13.5, below the consensus of negative 10.0; existing home sales fell 3.3% vs. an expected drop of 1.2%; but weekly jobless claims came in below expectations at 228,000 when the expected number was 242,000. The job market remains strong.
PMI numbers are out on Monday, while durable goods and the Q2 advance GDP are out on Thursday. The last reading was +2%, but it’s expected it will fall to 1.7%. However, the really big event remains the FOMC on July 26, along with speeches, of course, from Fed Chair Jerome Powell.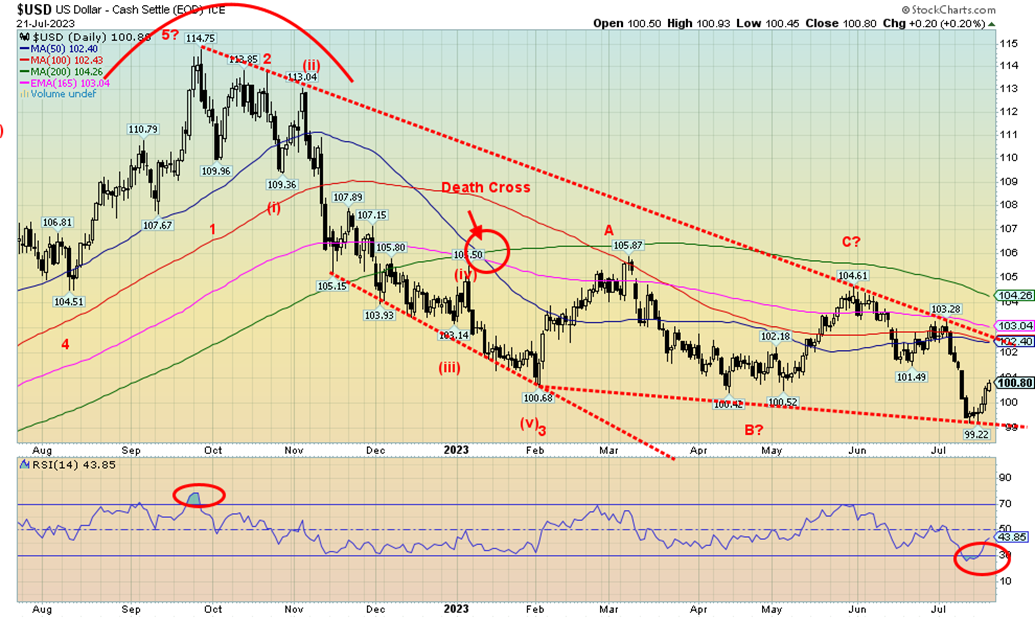
Source: www.stockcharts.com
The US$ Index (USDX) rallied this past week on thoughts of the Fed rate hike next week, along with talk that they still not be finished. As well, the breakdown of the Russian/Ukraine wheat deal is inflationary, which sent funds to U.S. dollars in safe haven buying. On the week, the USDX rose 1.2%. Hardest hit was the Japanese yen as it fell 2.0%. The euro was off 0.9%, the Swiss franc fell 0.4%, while the pound sterling dropped 1.8% as the U.K. economy is weakening and may soon join Germany in a recession. By comparison, the Canadian dollar was a star as it was mostly flat on the week. At this point, we have to treat the break under our long-held support of 100 as a false breakdown. We got as low as 99.22 and at that point the RSI was trading oversold under 30. At this stage, we are viewing this rebound as a bounce within the context of a new wave to the downside for USDX. Except now we need to break under 99 to confirm the breakdown and a possible top. Resistance for USDX is up to 102.40. However, we note resistance up to 101.50. The “death cross” that occurred in January 2023 has never been broken, so the downtrend continues despite the rebound. A firm breakout, however, over 102.50 could confirm that a low is in. After that, resistance is up to 104.25.
Source: www.stockcharts.com
Despite the higher US$ Index this past week, along with talk that the Fed might not be finished with rate hikes following the FOMC meeting this coming week, gold eked out a small 0.1% gain. Silver didn’t fare as well, falling 1.4%, but then silver has gone up faster so its pullback was more pronounced. Elsewhere, platinum fell 1.2%, continuing its year-long woes, while the near precious metals saw palladium gain 1.6% and copper lose 2.8% on recession fears. The gold stocks, after a strong up week the week before, fell back with the Gold Bugs Index (HUI) off 1.1% and the TSX Gold Index (TGD) down 1.0%. That’s not a lot, considering they rose over 8% the previous week.
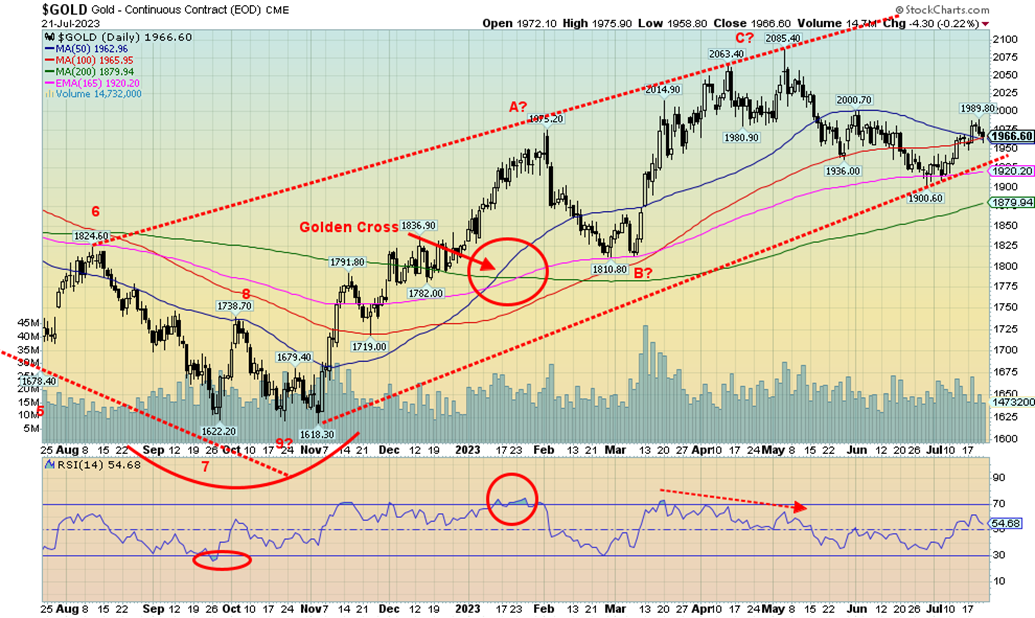
Gold is nowhere near overbought so we believe it has room to run higher. This pullback may also be helping to form a possible head and shoulders bottom pattern for gold. The left shoulder formed in May with that low at $1,936, the head formed at the $1,900 low in June, and now we are forming the right shoulder which should remain above $1,936 if the pattern is correct. We have noted that $1,950 is a support zone, although that can range down to $1,940. The neckline could then be formed around $1,990 and project up to potential targets at $2,090. The all-time high is at $2,089. The reality is, however, that we need a firm breakout over $2,100 to suggest to us we are embarking on a strong wave to the upside. Otherwise, this could turn out to be nothing more than a corrective wave with another down wave to follow.
Once we determine our low for this cycle, we should embark on a strong wave to the upside. The trouble is confirming that low has not yet occurred. The low for the cycle thus far was seen last November 2022 at $1,618. We remain skeptical as to whether our cycle low is in and, following a rally now, we could see another pullback into December 2023 to form our major cycle low. All this to be determined.
We have not received our COT numbers through (www.cotpricecharts.com). They normally update every week but, so far, they haven’t updated since July 3. We are not sure why and have written. The CFTC report we find difficult to read, but the report does appear to indicate a rise in the short position for commercials. This is no surprise as the short position tends to rise as gold and silver rally.
Gold is in the throes of its seasonal summer rally. However, if things hold true to form, we should top by September before beginning another swing to the downside.
Source: www.stockcharts.com
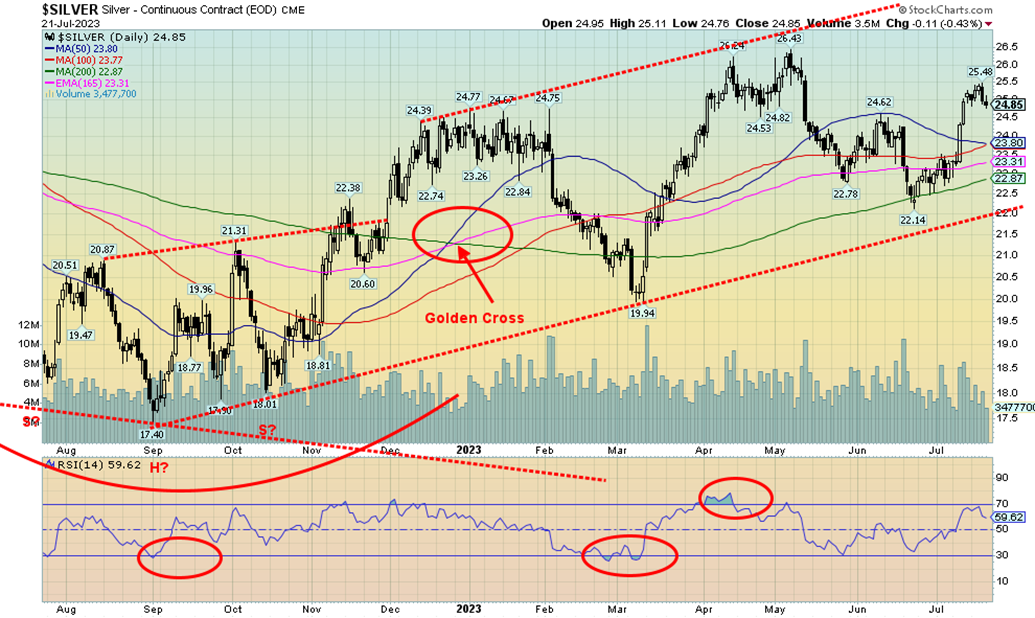
Silver prices responded to the stronger US$ Index this past week, like gold, and fell 1.4%. That still leaves silver up over 12% from that June low. The 50-day MA is starting to flatten out, and hopefully doesn’t cross under the 100-day MA. We view this pullback as a potential flag or pennant correction that, when finished, should send silver to highs above $25.50. A move above $25.50 would be quite positive as it could suggest new highs above the April high of $26.43. Silver has good support down to that converging 50/100-day MA near $23.80. We’d be surprised if we got that low. At minimum, there should be one more upside run to complete this wave to the upside. Our expectations, as noted with gold, are riding on the FOMC this coming week. If the Fed suggests we might see a pause, that could ignite silver. We’ve also noted the shorts in silver (Chart of the Week) and that should also help buoy silver prices. The first sign of a deeper pullback could occur if silver traded back under $24.60. Volume has been fading in the past week. As we noted with gold, we have not received our COT numbers. Nonetheless, a breakout over $25.50 could tell us we could see new highs on this move to the upside.
Source: www.stockcharts.com
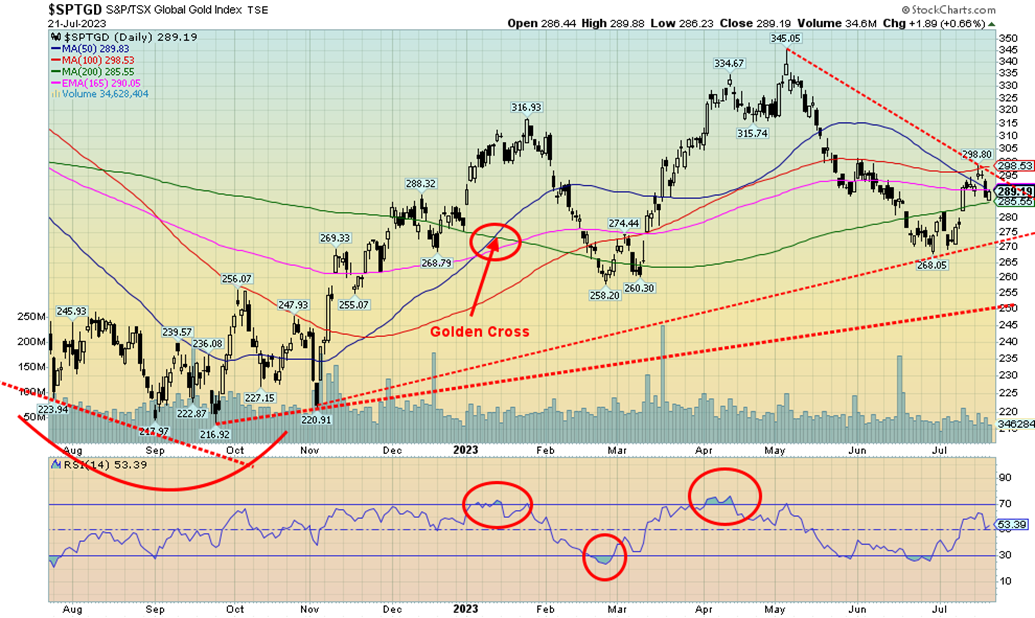
The previous week saw a nice jump for the gold stocks. Not so much this past week as the gold stocks responded to flat to weaker gold/silver prices by pulling back. The TSX Gold Index (TGD) fell about 1.0% while the Gold Bugs Index (HUI) was off 1.1%. Both remain up on the year: the TGD +4.2% and the HUI +6.2%. As the chart shows, the TGD ran into resistance at the 100-day MA just under 300. The 50-day MA has been falling and has now crossed the 100-day but remains above the 200-day, currently at 285. A break under the 200-day would give us the classic “death cross” sell signal. We had oversold conditions at the recent low at 268 so the rebound has been welcomed. The question now is, will the TGD and HUI break out? That depends a lot on whether gold and silver break out. The TGD needs to clear 300 and preferably over 310 to comfortably claim the low is in. In theory at least, we appear to be setting up a small head and shoulders bottom. The left shoulder is at that drop into May that was followed by a short-term rebound. We then fell into what might be the head with the low at 268. The right shoulder is currently being formed. Hence, the neckline at the 300 level although, as we note, a break over 310 is preferred to confirm. If the head and shoulders pattern is correct, it has measuring targets up to about 335. That would put the TGD close to that recent high seen in April at 345. The pattern appears small, but only a good breakout could confirm that the pattern exists. A break back under 285 would be negative and a break under 275 would suggest new lows ahead. We are in a seasonal positive period for gold and gold stocks, so our expectations are for a breakout.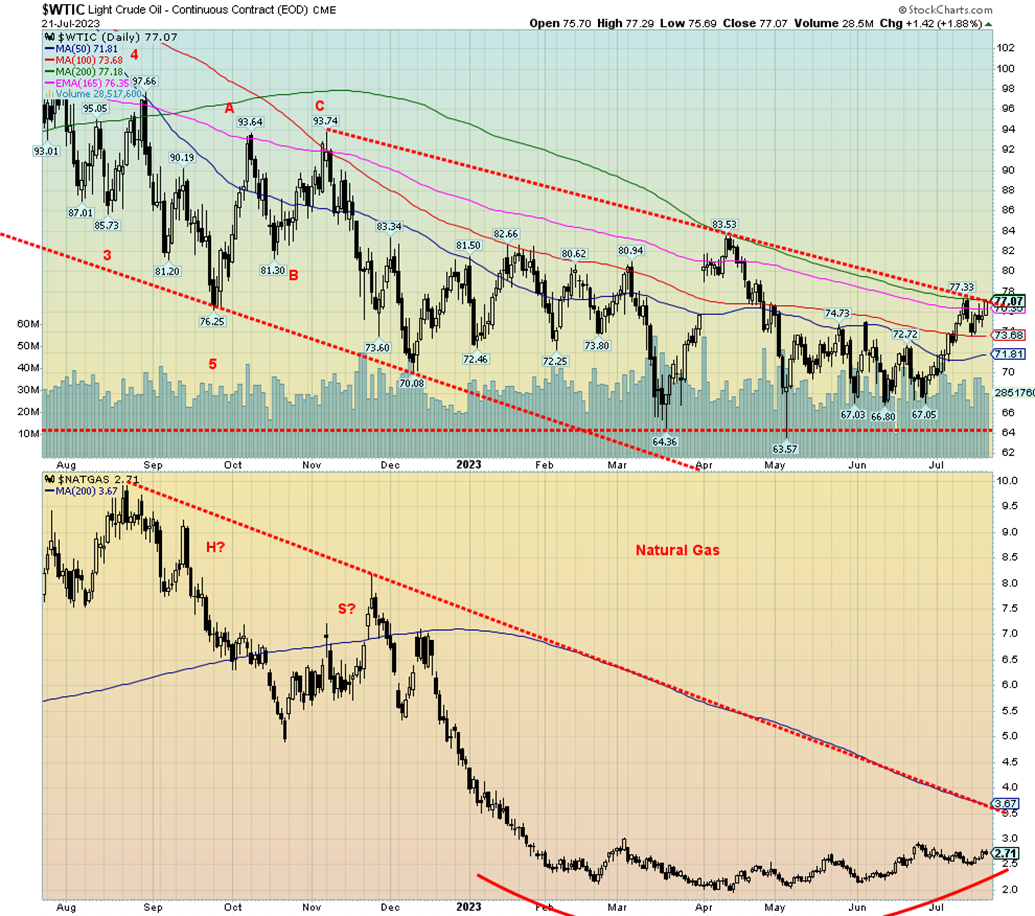
Source: www.stockcharts.com
WTI oil prices now appear to be on the cusp of a major breakout. This is not surprising as we have noted the potential for it for the past number of weeks. There has been some replenishment of strategic oil reserves in the U.S. and that extra demand has helped prices. The collapse of the Russian/Ukraine wheat deal is also helping to put upward pressure on oil prices. Oddly enough, this past we saw WTI oil rise but Brent crude fall. That doesn’t happen often. WTI was up 2.2% but Brent fell 2.3% back under $80.
Not so natural gas (NG) prices. Henry Hub rose 6.7% while the Dutch Hub rose 8.5%. It seems the heat waves, along with low wind striking across the Southern U.S. and Southern Europe does have an impact. Increased demand. Air conditioning can be expensive, assuming you can get it, and many can’t. All this is despite EU stockpiles being around 82.5% full. The expectation is that, by the fall, it will be 90% as more supply comes on stream from Norway.
The energy stocks liked what they saw as the ARCA Oil & Gas Index (XOI) rose 4.7% this past week while the TSX Energy Index (TEN) jumped 3.0%.
A breakout for WTI would occur over $78 while NG still needs to break out over $3 and $3.50 to convince us that we have truly bottomed. A summer rise for energy prices does happen even though it is not the season, which technically doesn’t get underway until December. A rally now into August/September could still see a pullback into October/November.
GLOSSARY
Trends
Daily – Short-term trend (For swing traders)
Weekly – Intermediate-term trend (For long-term trend followers)
Monthly – Long-term secular trend (For long-term trend followers)
Up – The trend is up.
Down – The trend is down
Neutral – Indicators are mostly neutral. A trend change might be in the offing.
Weak – The trend is still up or down but it is weakening. It is also a sign that the trend might change.
Topping – Indicators are suggesting that while the trend remains up there are considerable signs that suggest that the market is topping.
Bottoming – Indicators are suggesting that while the trend is down there are considerable signs that suggest that the market is bottoming.
Disclaimer
David Chapman is not a registered advisory service and is not an exempt market dealer (EMD) nor a licensed financial advisor. He does not and cannot give individualised market advice. David Chapman has worked in the financial industry for over 40 years including large financial corporations, banks, and investment dealers. The information in this newsletter is intended only for informational and educational purposes. It should not be construed as an offer, a solicitation of an offer or sale of any security. Every effort is made to provide accurate and complete information. However, we cannot guarantee that there will be no errors. We make no claims, promises or guarantees about the accuracy, completeness, or adequacy of the contents of this commentary and expressly disclaim liability for errors and omissions in the contents of this commentary. David Chapman will always use his best efforts to ensure the accuracy and timeliness of all information. The reader assumes all risk when trading in securities and David Chapman advises consulting a licensed professional financial advisor or portfolio manager such as Enriched Investing Incorporated before proceeding with any trade or idea presented in this newsletter. David Chapman may own shares in companies mentioned in this newsletter. Before making an investment, prospective investors should review each security’s offering documents which summarize the objectives, fees, expenses and associated risks. David Chapman shares his ideas and opinions for informational and educational purposes only and expects the reader to perform due diligence before considering a position in any security. That includes consulting with your own licensed professional financial advisor such as Enriched Investing Incorporated. Performance is not guaranteed, values change frequently, and past performance may not be repeated.
About the author


Website: https://www.enrichedinvesting.com
Disclaimer: David Chapman is not a registered advisory service and is not an exempt market dealer (EMD) nor a licensed financial advisor. We do not and cannot give individualised market advice. David Chapman has worked in the financial industry for over 40 years including large financial corporations, banks, and investment dealers. The information in this newsletter is intended only for informational and educational purposes. It should not be considered a solicitation of an offer or sale of any security. The reader assumes all risk when trading in securities and David Chapman advises consulting a licensed professional financial advisor before proceeding with any trade or idea presented in this newsletter. David Chapman may own shares in companies mentioned in this newsletter. We share our ideas and opinions for informational and educational purposes only and expect the reader to perform due diligence before considering a position in any security. That includes consulting with your own licensed professional financial advisor.