
It's the scary season. We are not sure what is going to happen but something is going to happen. Could we be facing a black swan event? An event out of the blue even some that might be considered might happen but nonetheless is a surprise that it actually happened. We identify some potential black swans ranging from wars to severe storms, to the return of inflation, to a bond market collapse.
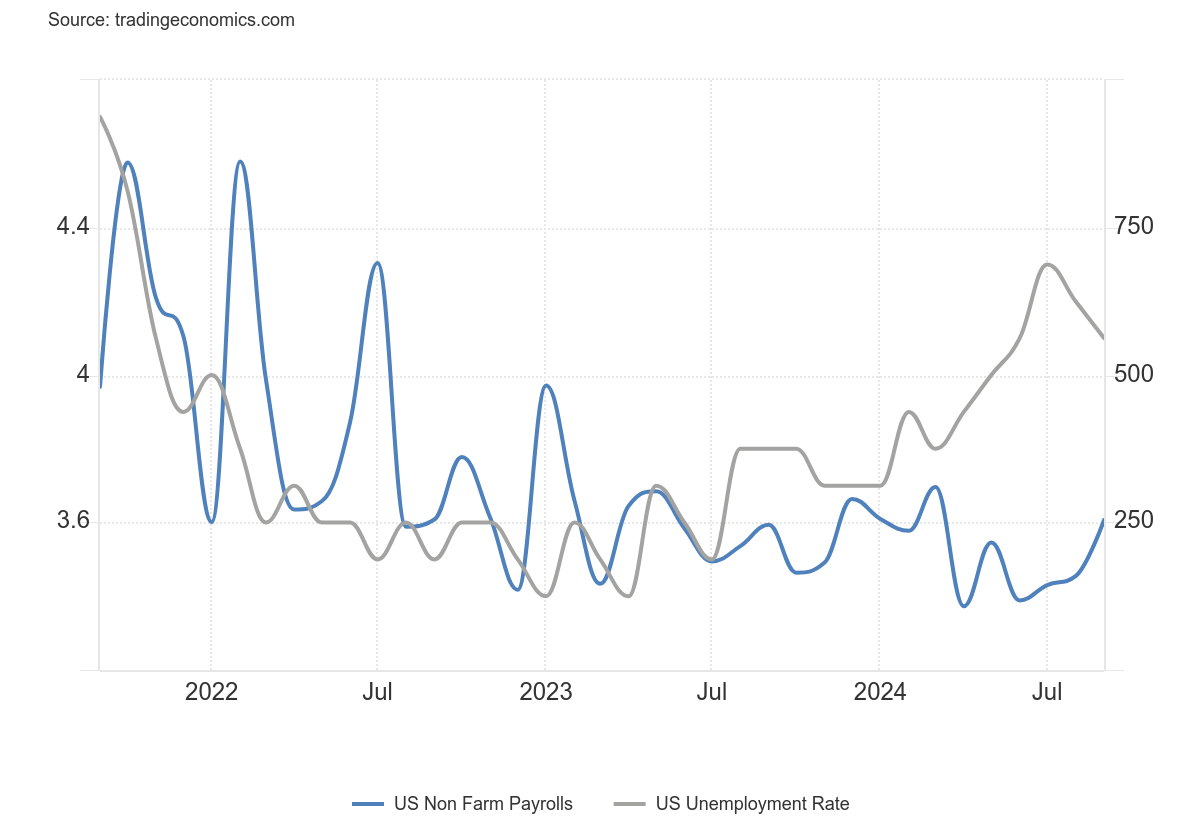
The job numbers for September came out and they surprised everyone. The job numbers are the subject of the chart of the week. Stocks generally responded favourably as did the U.S. dollar. But gold faltered and bonds sold off raising interest rates.
On the week oil soared because of the threat of the expansion of the Mid-East wars to include Iran. A likely beneficiary of this oil move, leading energy infrastructure and waste management company, Secure Energy Services Inc., reported increased net income per share and greater funds flow from operations, reduced its debt, declared a dividend, and is held in the Enriched Capital Conservative Growth Strategy.* The stock market was relatively flat save for the energy stocks that had a solid week. Gold was flat too but silver jumped and the gold stocks faltered. All remain up on the year by around 30%. But the surprisingly good job numbers put a dent in thoughts that the Fed might cut 50 bp at its November meeting. 25 bp is now the consensus.
As usual, we have our weekly commentary on various indices, gold, etc. We also include a few bonus charts of interest.
This past week - CPI, PPI, and Canada's job numbers.
Have a great week!
DC
* Reference to the Enriched Capital Conservative Growth Strategy and its investments, celebrating a 6-year history of strong growth, is added by Margaret Samuel, President, CEO and Portfolio Manager of Enriched Investing Incorporated, who can be reached at 416-203-3028 or msamuel@enrichedinvesting.com
“The knowledge of past times…is both an ornament and nutriment to the human mind.”
—Leonardo da Vinci, Italian renaissance polymath, painter, draughtsman, engineer, scientist, theorist, sculptor, architect, made drawings on anatomy, astronomy, cartography, paleontology; 1452–1519
“Short-term volatility is greatest at turning points and diminishes as a trend becomes established.”
—George Soros, Hungarian-American businessman, investor, political activist, philanthropist, author, philosopher, founder of Soros Fund Management which became the Quantum Fund, known as “the man who broke the Bank of England”; b. 1930
“First-rate people hire first-rate people; second-rate people hire third-rate people.”
—Leo Rosten, American writer and humourist, known in the fields of script-writing, story writing, journalism, and Yiddish lexicography, worked in Franklin D. Roosevelt administration during WW2, screenwriter, wrote The Dark Corner (1946), amongst others; 1908–1997
The black swan theory, or theory of black swan events, is a metaphor that describes an event that comes as a surprise, has a major effect, and is often inappropriately rationalized after the fact with the benefit of hindsight.
While Hurricane Helene was not a black swan event, the destruction of towns like Asheville, North Carolina might be considered to be as such. Helene was expected. The destruction of Asheville and other towns, in the manner of how they were destroyed, was not given many were upwards of 400 miles from the coast. Some more recent examples of black swan events might be September 11, 2001 (9/11) and the housing crash of 2007 that brought on the financial crisis of 2008 and the Great Recession. Some consider the 2020 COVID pandemic to be a black swan. Except a pandemic had been predicted for some time and regular pandemics stretch back centuries. There have been countless pandemics in this century alone, even as most go largely unnoticed. Going back a lot further, one might consider the asteroid that struck Earth some 66 million years ago and ended the age of the dinosaurs to be a black swan event.
Could we be facing a black swan event? A black swan event is not predictable, even as many will state afterward it should have been predictable. Or the event may be considered possible but unlikely. There were a few who did predict the housing crash of 2007, notably Michael Burry who was highlighted in Michael Lewis’s book The Big Short, and later the film of the same name.
The question, of course, is: where could a black swan take place that could cause the stock market to crash or a major financial crisis break out? There are a few possible scenarios.
- Oil prices. If the Straits of Hormuz were to be blocked, oil prices could soar, sparking a recession. While the potential is known, it would still come as a shock to the system. With the rising potential for the outbreak of war with Iran and the potential involvement of the U.S., it raises the stakes. Involvement by the U.S. could bring in other players in defense of Iran; i.e. Russia or China as China gets oil from the region, including Iran, by methods to get around U.S. sanctions. The Straits of Hormuz are the most important oil chokepoint in the world as upwards of 30% of global oil goes through the straits. 70% of the oil is destined for Asian markets. In the past, sharply rising oil prices have sparked recessions including 1973–1975, 1980–1982, and 1990. While not the prime cause, it is noteworthy that oil prices hit a record high in 2008 before the start of the global financial crisis. Exacerbating oil supply problems is that, while the U.S. has become the world’s largest producer, its refining capacity is tight. They could not make up the difference if the Straits of Hormuz were blocked. Already, oil prices are jumping on the threat of an outbreak of war between Iran and Israel.
- Climate volatility. Hurricane Helene has highlighted the devastation that super storms can cause. Yet the prediction is that we are potentially going to see more of these super storms including hurricanes and floods. We are also seeing a big increase in droughts. These could create supply disruptions that lead to increased inflation, particularly for food. Increased heat waves, wildfires, tornadoes, and more have a huge economic cost. Many insurance companies are reeling because of payouts that are putting them on the brink of bankruptcy. As well, insurance premiums go up, sparking affordability issues. Lack of insurance puts many in danger of losing everything.
- Recession in China. China is the world’s second largest economy. It is the world’s largest exporter of goods. And it is a saddled with a massive real estate crisis and teetering corporate debt. While the Chinese government and PBOC have taken steps to try and ease the crisis, they can only do so much when much of the debt that is teetering is owned by small business and consumers (homeowners). They can only do much with most of the relief aimed at the large corporations and financial institutions, not the small business and consumers who really need it. Like the U.S., a severe recession in China would have global implications.
- Outbreak of war in Asia. The two hottest spots are China’s claim to Taiwan and North and South Korea. China has raised its military presence considerably in the South China Sea. They have had incidents with Vietnam, the Philippines, and the U.S. There have been numerous threats about invading Taiwan. If that actually happened, it would bring in the U.S. and would be a major shock to the global economy. North Korea has consistently threatened to invade South Korea to re-unite the two Koreas. Noteworthy are that treaty obligations with South Korea would bring in the U.S., which also has troops stationed there. There have also been ongoing but low-key clashes between two nuclear powers Pakistan and India. A major clash, however, would be a global shock.
- An expansion of the Russia/Ukraine war. The West appears to be giving a green light to Ukraine to use Western-supplied weapons to strike deep into Russia. Russia has raised this as a red flag that they are really at war with the U.S. and NATO. Russian nuclear forces are on high alert. Russian nukes have been placed in Belarus. Russia and the U.S. have rattled nuclear sabres at each other. Could brinkmanship put us on the edge of World War III with nuclear weapons? But could an attack on Russia come from other sources? The word currently is that Israel has bombed a Russian airbase in Syria aimed at a weapons depot with arms for Lebanon from Iran.
- Deglobalization. The world has been steadily deglobalizing, primarily due to the ongoing conflicts between the West, led by the U.S. and Western Europe, and the East, led by China and Russia. Sanctions, tariffs, and more are leading the world to a period of deglobalization after years of building up the global economy that has shown its benefits. Instead, we are now going in the opposite direction and, like the 1930s, it could lead to global depression.
- A sudden return of inflation. This is not exactly surprising as we’ve seen this story before. The 1970s saw two bouts of inflation. The first one was related to the Arab oil embargo of 1973. Following that, the authorities were able to reduce annual inflation from a peak of 12.2% in November 1974 to 5.0% by December 1976. But then inflation started to rise again, peaking with the Iranian hostage crisis that sent oil prices soaring once again to higher levels than before. Inflation peaked at 14.6% in March 1980. Fed chair Paul Volcker hiked interest rates to unheard-of levels in order to bring it down, sparking the steep recessions of 1980–1982. With threats from potential expansion of the Middle East wars or massive storms to spark supply disruptions, inflation could once again rise, bringing on a period of stagflation and economic stagnation.
- A U.S. bond market collapse. The U.S. debt has been growing, currently sitting at $35.6 trillion, and is projected to rise to over $47 trillion by 2028. The U.S. debt represents some 11% of total global debt. The challenge is how to finance it. Foreign buyers have been balking, as we see China and now even Japan cutting back on their purchases. Others are forced to pick up the slack. Intragovernmental purchases are rising (i.e. Social Security, Medicare) and they can only absorb so much. But the good news is they hold it to maturity. Rising supply and falling demand is not a picture for a healthy bond market. It could then spark a backup in interest rates that in turn spark a sell-off of the U.S. dollar and inevitably lead to a bond crisis that we’ve seen before in 1994 and 2000 and even in the late 1970s. As well, high interest rates have sent the amount of interest paid by the U.S. on its debt to over $1 trillion, making it the biggest U.S. government outlay, behind Social Security and Medicare and slightly ahead of what the U.S. spends on defense/war. With the government debt to GDP ratio at 124.3% and the budget deficit at almost 25% of GDP, the projectory is unsustainable. Something has to give.
There may be others we have overlooked. But these are the ones with the potential to spark the biggest surprise. We note a couple of black swan events below of the past 100 years and their impact on markets.
Black Swan Surprise #1
Outbreak of War World War I, August 1914
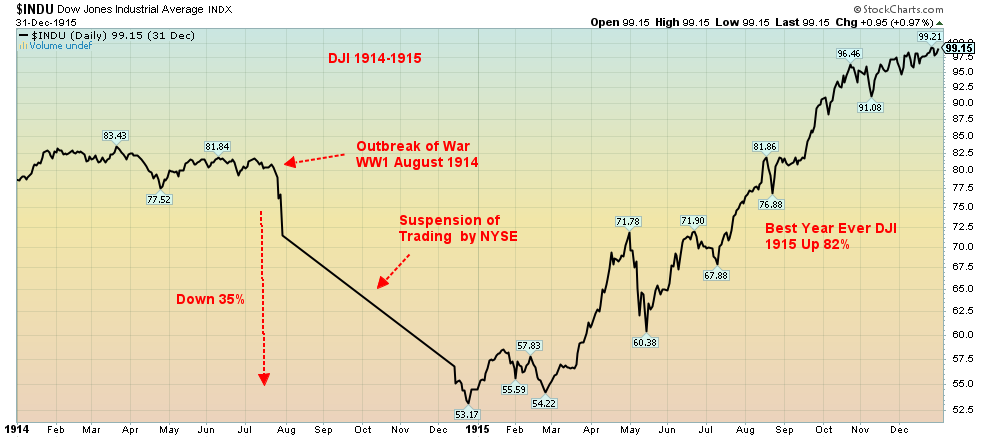
Source: www.stockcharts.com
In 1914, when war broke out in Europe, there was a great fear that European investors would start selling stocks in the U.S. to raise money to be repatriated. The NYSE Stock Exchange justified this as reason to suspend trading. The NYSE remained shut for the next five months and when it opened, the DJI had fallen 35% from an earlier peak in June 1914. The market then recovered and, with the U.S. factories working overtime to supply arms, the DJI soared in 1915, producing the best year ever for the DJI.
Our second chart on the next page shows the stock market in 2001–2002. The black swan event was the bombings of the World Trade Center on September 11, 2001 (9/11). The NYSE closed for four days. Over the next few months until later in September, the DJI fell 18% but was actually down some 30% from its high in January 2000. The stock market didn’t bottom until October 2002, sparked by the collapse of the high-tech/dot.com market.
No, it doesn’t always have to be war that sparks a black swan event. The San Francisco earthquake of 1906 initially didn’t seem to have an economic impact. However, it shut down the port of San Francisco, a key conduit in the shipping of goods. It eventually sparked a severe recession and a stock market collapse that saw the DJI fall some 48%. The current port strike appears to be averted, but the potential for supply disruptions, inflation, and economic turmoil remains even if they do settle. Black swans happen. The question is, are we prepared in the event of one? Evidence suggests we are not.
Black Swan Surprise #2
September 11, 2001 (9/11)
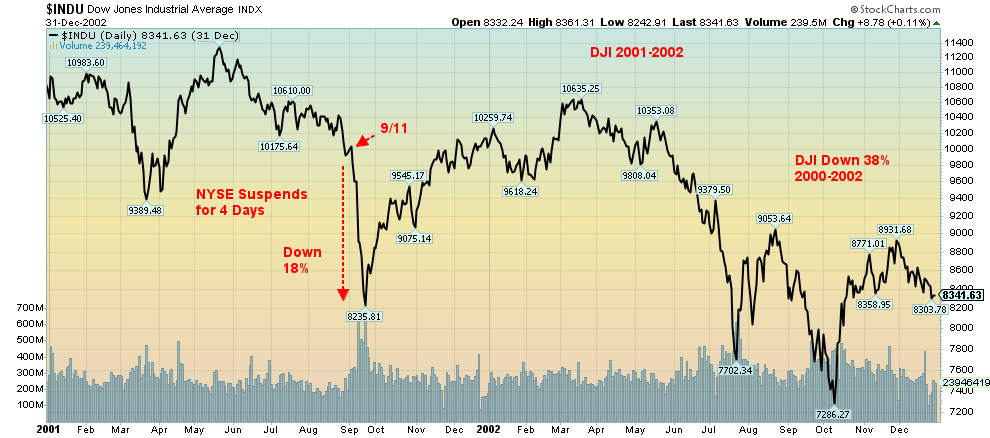
Source: www.stockcharts.com
Chart of the week
U.S. Employed Persons vs. Unemployed Persons 2019–2024
Source: www.tradingeconomics.com, www.bls.gov
Wow! “Well, blow me down.” (Thanks, Popeye). Quelle surprise! The U.S. nonfarm payrolls for September came in far better than expected with 254,000 jobs. Last month it was a revised gain of only 159,000. The market had expected only a gain of 140,000 to 150,000. It was the strongest growth in six months and above the average of the last year of 203,000. Okay, before we get too excited, it appears that the bulk of the jobs were in food services, bars, health care, and government. As someone asked, where are the big jobs in finance, engineering, and high tech? Employment fell in manufacturing, which is really no surprise as we’ve noted that the U.S. manufacturing sector is in a recession. The unemployment rate (U3) fell to 4.1% vs. 4.2% while the U6 unemployment rate (total unemployed, plus all persons marginally attached to the labour force, plus total employed part-time for economic reasons) fell to 7.7% from 7.9%. We did receive Shadow Stats’ (www.shadowstats.com) unemployment rate. The Shadow Stats rate is U6 plus the discouraged workers defined out of the labour force in a 1994 revision. They currently show in the “not in the labour force” category. The Shadow Stats number was 26.7% and it has been rising steadily all year.
With a far better than expected jobs report, will the Fed still cut 25 bp at its next meeting on November 6–7? Some (a minority) are still expecting 50 bp because the inflation rate is down and the Fed now wants to encourage employment, given that inflation has dropped. But let’s not forget the nonfarm payrolls is the establishment survey and is subject to numerous revisions going forward. That can occur over the next two months or even longer for the final revisions. It’s best to also look at the household survey, which contacts individuals and can soon determine whether one has one job or two. The establishment survey doesn’t distinguish.
The population level, meaning all those 16 years and older except those in prison or the armed forces, rose 224,000 last month, but the civilian labour force only rose 150,000. The employment level was up 400,000 while full-time jobs increased 414,000 and part-time jobs fell 95,000. The employment population ratio rose to 60.2 from 60.0, implying more people as a ratio of the population are working. The not in the labour force number rose 419, indicating new entrants into the labour force but who are still not counted in the overall labour force. A big chunk of those not in the labour force are retirees (59.9 million) and the disabled (8.4 million). Full-time students might be employed in part-time jobs.
Strangely enough, the average number of weeks unemployed actually rose from 21 weeks to 22.6 weeks. Those unemployed 27 weeks or longer jumped 55. Average hourly earnings rose 4% year over year (y-o-y) when they only expected a gain of 3.7% and last month it was up 3.9%. Surprisingly, temp jobs declined while the average workweek slowed to 34.2%. Inflation expectations ticked higher. The average work week declined to 34.2 hours from 34.5 hours.
The stock market rose, the US$ Index rose, bond yields rose, and gold faltered but came back. Oil is up but it’s responding to events in the Middle East. We await clues from the Fed as to what they might do at the November meeting. We believe a cut is still on but, given the stronger labour market, maybe only 25 bp. The Goldilocks economy?
U.S. NonFarm Payrolls vs. Unemployment Rate 2021–2024
Source: www.tradingeconomics.com, www.bls.gov
Markets & Trends
|
|
|
|
% Gains (Losses) Trends |
|
||||
|
|
Close Dec 31/23 |
Close Oct 4, 2024 |
Week |
YTD |
Daily (Short Term) |
Weekly (Intermediate) |
Monthly (Long Term) |
|
|
Stock Market Indices |
|
|
|
|
|
|
|
|
|
S&P 500 |
4,769.83 |
5,751.07 |
0.2% |
20.6% |
up |
up |
up |
|
|
Dow Jones Industrials |
37,689.54 |
42,352.75 |
0.1% |
12.4% |
up |
up |
up |
|
|
Dow Jones Transport |
15,898.85 |
15,814.11 |
(2.3)% |
(0.5)% |
neutral |
up |
up |
|
|
NASDAQ |
15,011.35 |
18,137.85 |
0.1% |
20.8% |
up |
up |
up |
|
|
S&P/TSX Composite |
20,958.54 |
24,162.83 (new highs)* |
0.9% |
15.3% |
up |
up |
up |
|
|
S&P/TSX Venture (CDNX) |
552.90 |
595.26 |
2.1% |
7.7% |
up |
up |
down (weak) |
|
|
S&P 600 (small) |
1,318.26 |
1,407.46 |
(0.8)% |
6.7% |
up |
up |
up |
|
|
MSCI World |
2,260.96 |
2,442.75 |
(3.6)% |
8.0% |
up (weak) |
up |
up |
|
|
Bitcoin |
41,987.29 |
62,338.09 |
(5.3)% |
48.5% |
up (weak) |
up |
up |
|
|
|
|
|
|
|
|
|
|
|
|
Gold Mining Stock Indices |
|
|
|
|
|
|
|
|
|
Gold Bugs Index (HUI) |
243.31 |
316.24 |
(3.1)% |
30.0% |
up |
up |
up |
|
|
TSX Gold Index (TGD) |
284.56 |
366.95 |
(2.0)% |
29.0% |
up |
up |
up |
|
|
|
|
|
|
|
|
|
|
|
|
% |
|
|
|
|
|
|
|
|
|
U.S. 10-Year Treasury Bond yield |
3.87% |
3.98% |
5.9% |
2.8% |
|
|
|
|
|
Cdn. 10-Year Bond CGB yield |
3.11% |
3.22% |
8.1% |
3.5% |
|
|
|
|
|
Recession Watch Spreads |
|
|
|
|
|
|
|
|
|
U.S. 2-year 10-year Treasury spread |
(0.38)% |
0.04% |
(75.0)% |
110.0% |
|
|
|
|
|
Cdn 2-year 10-year CGB spread |
(0.78)% |
(0.4)% |
(140.0)% |
94.9% |
|
|
|
|
|
|
|
|
|
|
|
|
|
|
|
Currencies |
|
|
|
|
|
|
|
|
|
US$ Index |
101.03 |
102.49 |
2.4% |
1.5% |
up |
down |
neutral |
|
|
Canadian $ |
75.60 |
73.66 |
(0.5)% |
(2.6)% |
neutral |
up (weak) |
down |
|
|
Euro |
110.36 |
109.76 |
(1.7)% |
(0.5)% |
down |
up |
up (weak) |
|
|
Swiss Franc |
118.84 |
116.50 |
(2.1)% |
(2.0)% |
down |
up |
up |
|
|
British Pound |
127.31 |
131.27 |
(1.9)% |
3.9% |
neutral |
up |
up |
|
|
Japanese Yen |
70.91 |
67.22 |
(4.5)% |
(5.2)% |
down |
up |
down (weak) |
|
|
|
|
|
|
|
|
|
|
|
|
|
|
|
|
|
|
|
|
|
|
Precious Metals |
|
|
|
|
|
|
|
|
|
Gold |
2,071.80 |
2,667.80 |
flat |
28.9% |
up |
up |
up |
|
|
Silver |
24.09 |
32.39 |
1.8% |
34.5% |
up |
up |
up |
|
|
Platinum |
1,023.20 |
1,001.70 |
(2.0)% |
(2.1)% |
up |
up |
neutral |
|
|
|
|
|
|
|
|
|
|
|
|
Base Metals |
|
|
|
|
|
|
|
|
|
Palladium |
1,140.20 |
998.50 |
(2.4)% |
(12.4)% |
up (weak) |
up |
down |
|
|
Copper |
3.89 |
4.57 |
(0.7)% |
17.5% |
up |
up |
up |
|
|
|
|
|
|
|
|
|
|
|
|
Energy |
|
|
|
|
|
|
|
|
|
WTI Oil |
71.70 |
74.38 |
9.1% |
3.6% |
up |
down |
down |
|
|
Nat Gas |
2.56 |
2.85 |
(1.7)% |
11.3% |
up |
up |
down |
|
Source: www.stockcharts.com
Note: For an explanation of the trends, see the glossary at the end of this article.
New highs/lows refer to new 52-week highs/lows and, in some cases, all-time highs.
- * New All-Time Highs
Source: www.stockcharts.com
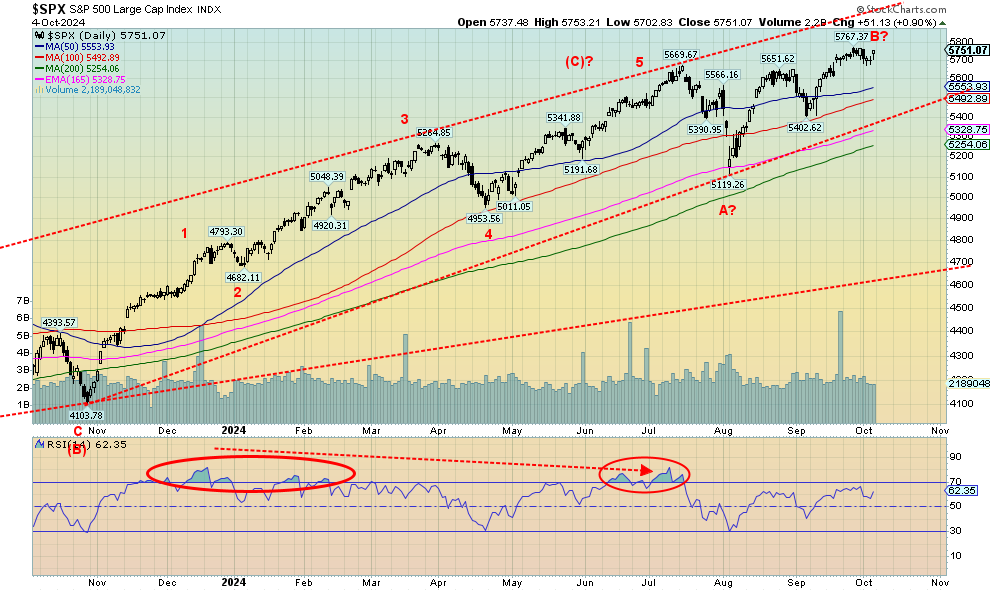
Thanks to the threat of war in the Middle East, stock markets initially were stumbling. Then came the jobs report and markets rebounded. By the end of the week, the S&P 500 (SPX) rose a small 0.2%. The Dow Jones Industrials (DJI) was up an even smaller 0.1%. The Dow Jones Transportations (DJT) didn’t make it and fell 2.3%. The NASDAQ rose a paltry 0.1%. The S&P 400 (MID) was flat while the S&P 600 (Small) fell 0.8%. While markets finished on a positive note, they still look like they want to roll over as indicators are turning down. The MACD indicator for the SPX is on the cusp of a sell signal with negative divergences. Bitcoin fell 5.3%, once again stopping near $65,000/$66,000.
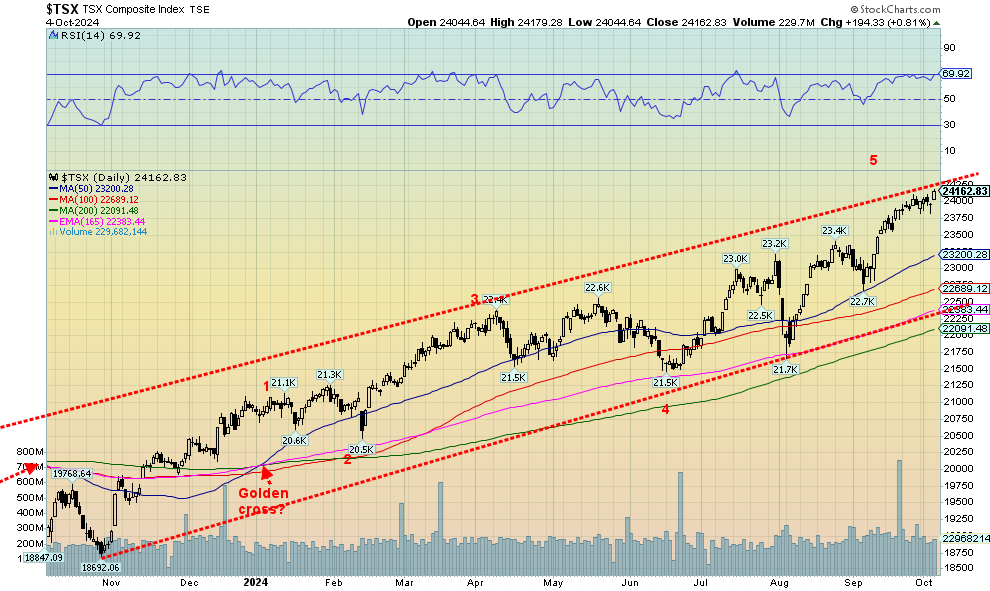
In Canada, the TSX Composite was the only big winner, gaining 0.9% to new all-time highs (barely), thanks largely to Energy (TEN). The TSX Venture Exchange (CDNX) is showing some life, up 2.1%. In the EU, the London FTSE lost 0.5%, the EuroNext was down 1.5%, the Paris CAC 40 was off 3.2%, and the German DAX fell 1.8%. Asia was a winner, mostly as China’s Shanghai Index (SSEC) soared 8.1% on a holiday-shortened week. The Tokyo Nikkei Dow (TKN) was the outlier, losing 3.0%, but Hong Kong’s Hang Seng (HSI) jumped 8.3%. China and Hong Kong were (overly) encouraged by the Chinese government’s and PBOCs stimulus package. The MSCI World Index fell 3.6%.
The background is not encouraging with the threats of an expanding Middle East war, economic fallout from Hurricane Helene and threats of more hurricanes on their way, and the divisive election that threatens to become violent and disputed. This is October, the month known as the bear killer, but it is also the month known for crashes, notably 1929, 1987, the drops of 1978 and 1979, and the meltdowns in 1989 and especially 2008. But as noted, October is a bear killer with 13 significant bottoms made in the month, including 2002, 2011, and 2022. Overall, October is the seventh worst month of the year for the SPX and DJI. Significantly, the market topped on October 11, 2007. It was high for the next six years, only to be finally taken out in 2013. It was the top of the housing/sub-prime loan market.
Many believe we are in a bubble, and certainly, by most valuations, the market is overvalued. Given the background of wars and deep political divisions, could another high be on its way? 5,400 remains the line in the sand. If that goes, we should move even lower. Under 5,100 we could crash. Safety is paramount in this environment.
Source: www.stockcharts.com
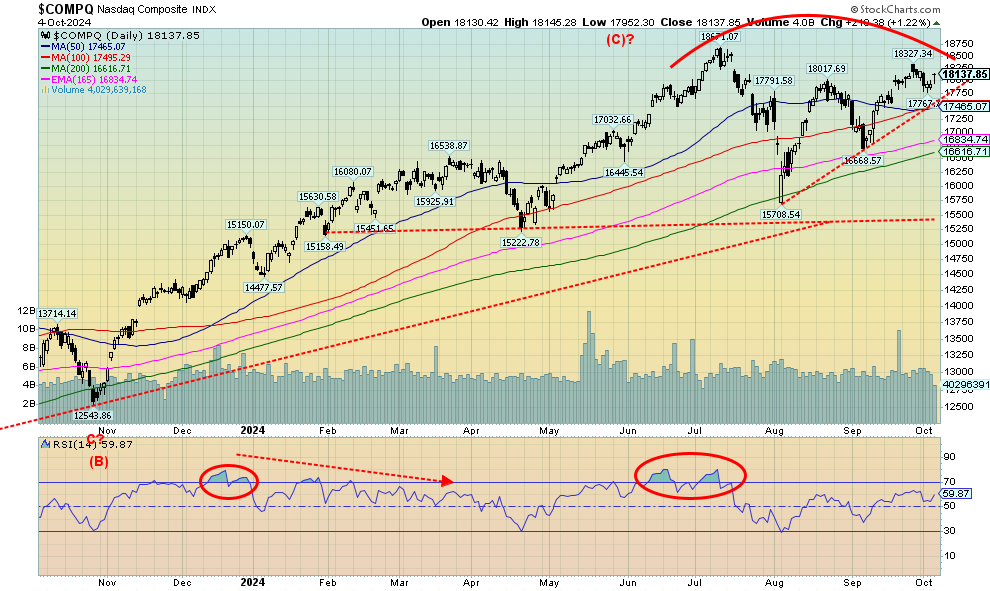
The NASDAQ continues to give us the impression that it is rolling over. A swift 16% drop from that top in July followed by a rebound in an ABC corrective fashion suggests to us that wave 1 down bottomed at 15,708 and wave 2 up may have topped at 18,327 a week or so ago. On the week, the NASDAQ was up only 0.1%. The NY FANG Index, which makes up a significant part of the NASDAQ, gained 1.6% as the FAANGs and MAG7 tried to recover. Meta gained 4.9% and did make new all-time highs. But Meta was the only one. Big winners were the Chinese tech stocks Baidu and Alibaba, up 5.0% and 6.7% respectively this past week as Chinese equities soared. A drop now under 17,465 could signal further losses ahead. Major support is seen at the 200-day MA near 16,615. Under 15,500 a more serious drop gets underway. New highs above 18,325 would keep this rally alive and possibly signal new all-time highs.
Source: www.stockcharts.com
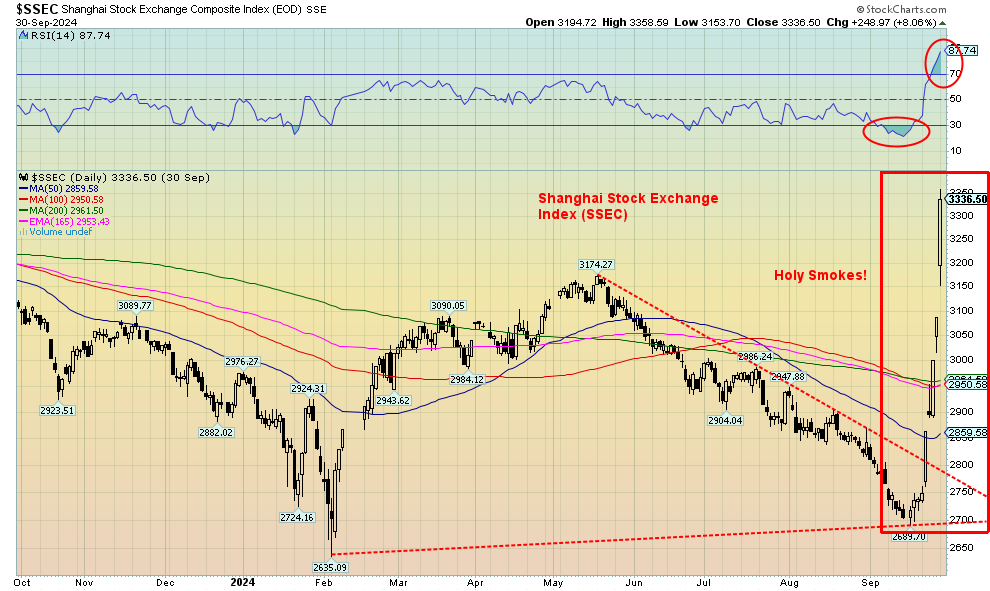
Is this a stock market or a moonshot? No, it’s the Shanghai Stock Exchange (SSEC), following the announcement from China’s government and PBOC that the economy is to be saved at all costs. We wonder how many short sellers were forced to cover their positions before their brains were handed to them. That’s 24% in mostly five days. Tumbling real estate, moribund consumers, bankrupt banks, and thousands of small businesses facing bankruptcy prompt this kind of response. The question is, will it work? Moves like this from extremely oversold to extremely overbought in a few days are normally not sustainable. The market was also cut short with holidays this past week. It almost looks like a breakaway gap followed by running gaps. If that is correct, this move may only be half over. We await the return from the holidays this coming week. Incidentally, China gets a significant amount of oil from Iran through methods designed to beat U.S. sanctions. But if Israel bombs the Iranian oil fields as they have threatened to do, then what?
Source: www.stockcharts.com
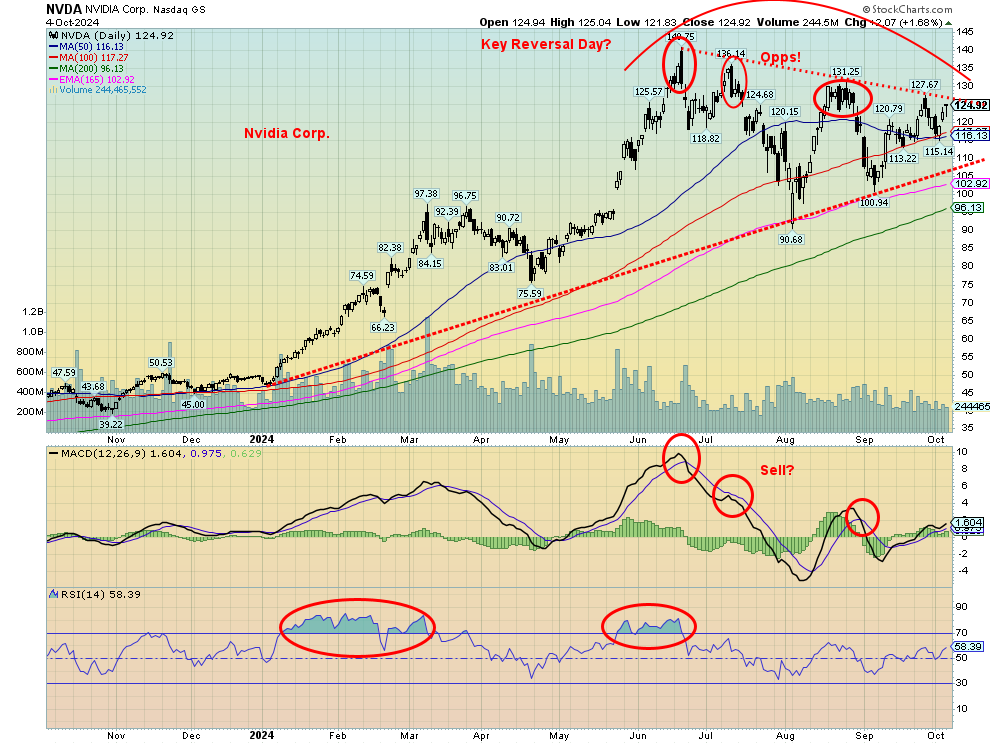
Is Nvidia the canary in the coal mine? Nvidia is still up an incredible 152% in 2024, despite the recent pullback. But that high was made back in June. It started out as a key reversal day (higher high making all-time high, lower low, lower close than previous day) and it was soon followed by a fairly swift 35% decline. It even included another reversal day in July. Since then, Nvidia appears to be forming a large symmetrical triangle. Symmetrical triangles can be consolidation patterns or topping patterns. The nature of all this suggests to us a topping pattern, not a consolidation, given the huge gain in 2024. It’s hard to believe, but you could have purchased Nvidia in 2008 for as low as $0.13—yes, 13 cents. 10,000 shares then would have been worth $1.4 million at that June top. But we’ve learned that insider selling has totaled some $1.8 billion in 2024. Maybe they had some of that 13-cent stock.
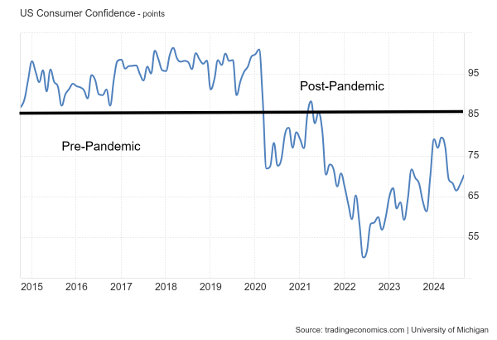
U.S. Michigan Consumer Sentiment Index 2014-2024
Source: www.tradingeconomics.com, www.umich.edu
The stark difference between the University of Michigan Sentiment Index pre-pandemic and post-pandemic is become stark. Prior the indicator was consistently above 85. Post it has been consistently below 85 and much of it under 70/75. Are Americans that pessimistic about the future? Even the current levels are more what we saw back during the dark days of 1980-1982 recession and the 2007-2009 Great Recession. This view is one reason one wonders how the U.S. economy keeps ticking the best in the G7 yet they are for the most part somewhat pessimistic.
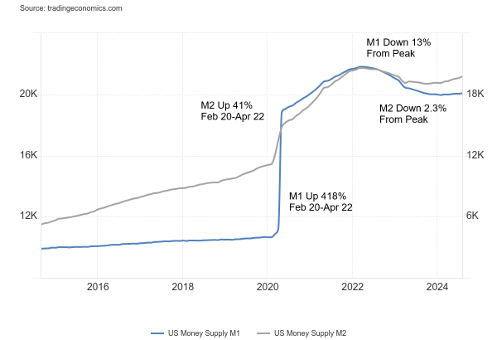
U.S. Money Supply M1, M2 2014-2024 ($billions)
Source: www.tradingeconomics.com, www.federalreserve.gov
After surging post pandemic money supply as represented here by M1 (currency, demand deposits) and M2 (M1 plus current accounts, savings accounts, money market funds, retail mutual funds, time deposits) both M1 and M2 have come down from their highs seen in April 2022. M1 has fallen 13% while M2 has fallen 2.3%. But what is interesting is that while M1 can be volatile M2 is usually pretty steady rarely falling much from its peak. As was pointed out in an article from the Motley Fool www.fool.com M2 has really only fallen 2% or more from its peak once before. During the Great Depression. Actually, the current decline was not the peak decline as at the low in January 2024 M2 was down over 4% from its peak. Does it mean anything? Hard to say but should be noted. Since the last low in October 2022 the S&P 500 is up about 65%, the Dow Jones Industrials (DJI) is up almost 48% while the NASDAQ is up about 80%. Yet money supply is down during this period. But government debt is up roughly 13% and both consumer and corporate debt are also up. Meanwhile savings are falling. So the question begs – why is the stock market up so much with P/Es and other indicators at overvalued levels?
Source: www.stockcharts.com
Nothing seems to stop the TSX. This past week the TSX was only major North American index to make new all-time highs. The TSX was up 0.9% on the week. It was, however, largely thanks to the Energy sub-index (TEN), which gained 8.5% on the week, the best all the sub-indices. Financials (TFS) are the largest weighting with 32% of the index, but that is followed by Energy at 17.5%. Financials gained a small 0.3% this past week, so their large weighting didn’t hurt. Only three sub-indices were up this week, with the other one being Information Technology (TKK), up 1.7%. TKK makes up 8.6% of the index. Leading the way down were Real Estate (TRE) and Income Trusts (TCM), both off 2.4%. Both are quite interest-sensitive to the backup in rates this past week. Telecommunications (TTS) lost 2.2% and Golds (TGD) fell 2.1%. The TSX is once again touching up against that upper trend line so another pull-back could be in store. A real breakdown doesn’t get underway until we are under 22,700, but a drop now under 23,750 could signal further losses. While Energy might be the leader if the TSX is to fall, it most likely will be led by the Financials.
U.S. 10-year Treasury Note, Canada 10-year Bond CGB
Source: www.tradingeconomics.com, www.home.treasury.gov, www.bankofcanada.ca
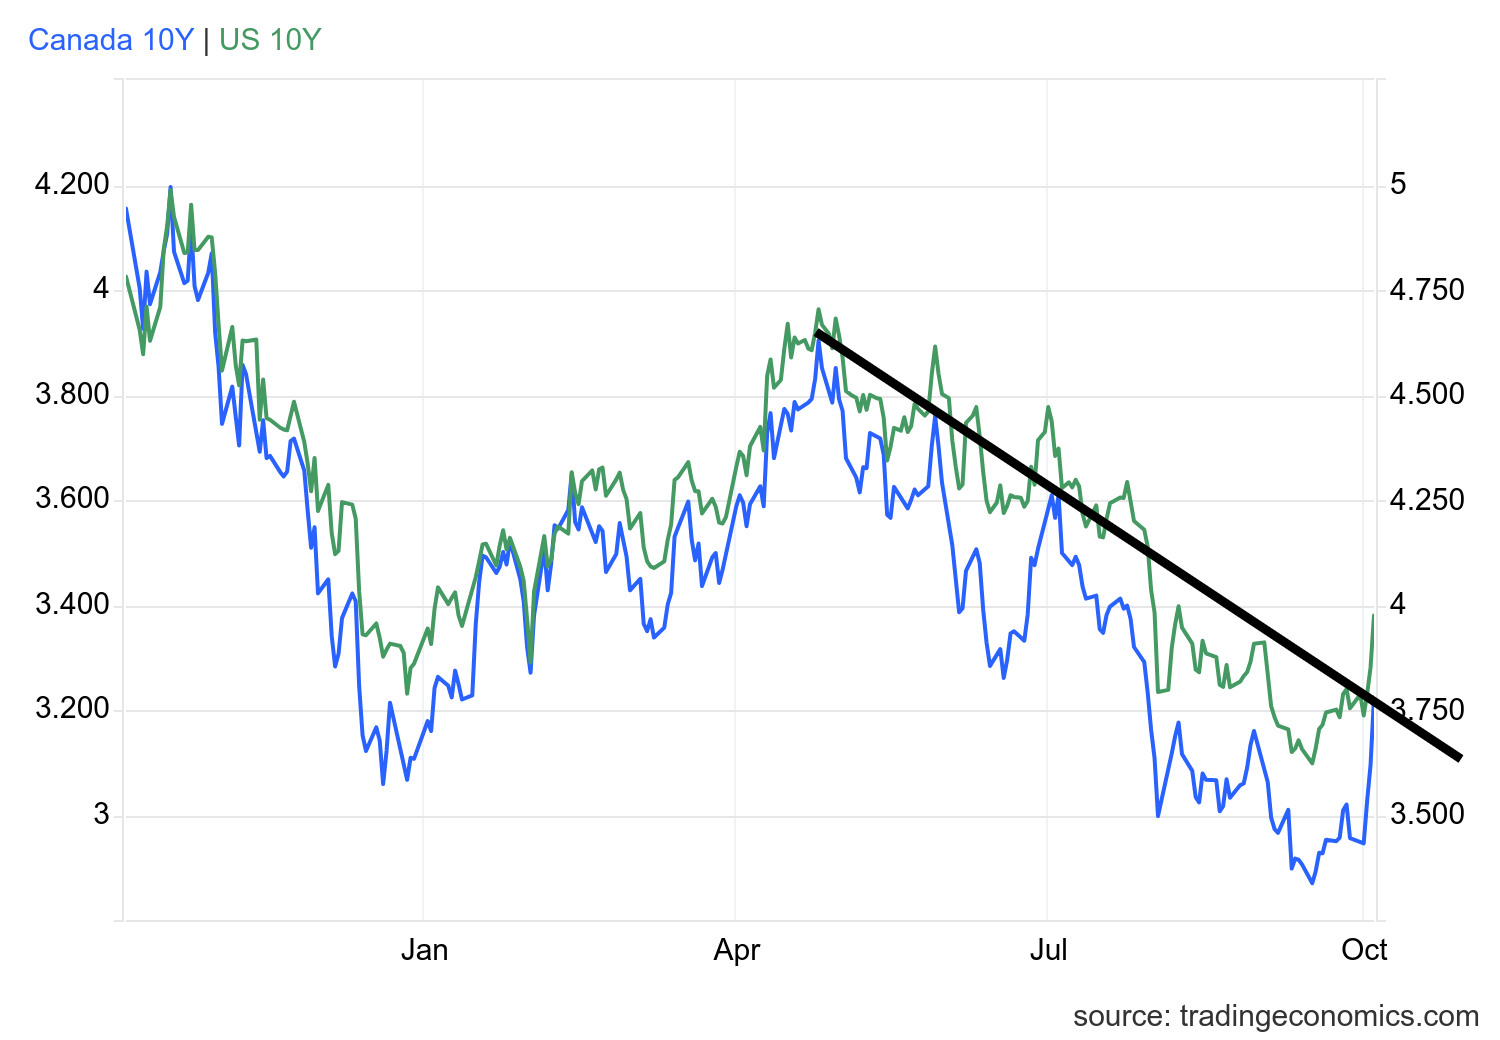
Nothing like a hot job number to bring back the bond bears. The hot job numbers on Friday also lessened thoughts of a 50 bp cut in November. That is now down to only a 9% chance. 25 bp remains the consensus. Not only were the job numbers hot, ISM Manufacturing numbers came in better than expected as well. Weekly claims remain suppressed. The recent Michigan Sentiment Index perked up a little. But we note the Michigan Sentiment Index remains well below levels in 2019 before the COVID pandemic. We also appear to have broken that downtrend line for a high in April.
The U.S. 10-year treasury note rose to 3.98% from 3.76% a big 5.9% jump. Canada rose to as the 10-year government of Canada bond (CGB) was up to 3.22% from 2.98%. The recession spreads also rose as the U.S. 2–10 fell to +4 bp from +16 bp while the Canadian 2–10 spread fell to negative 4 bp from 1 bp. Odds of a recession haven’t ended, but the prevailing sentiment is for a soft landing only. The job numbers are encouraging and the U.S. economy has been the strongest in the G7. But the longest run we’ve ever seen of the inverted yield curve continues to suggest to us it won’t be a soft landing but a hard landing instead. The last time we saw such an extended period of an inverted yield curve was in the late 1970s, before the hard landing of the 1980–1982 recession that was the steepest recession since the Great Depression at the time. Remember these job numbers are subject to revisions, some of which don’t come out until much later. Remember that 800,000 + downward revision recently? That’s what can happen.
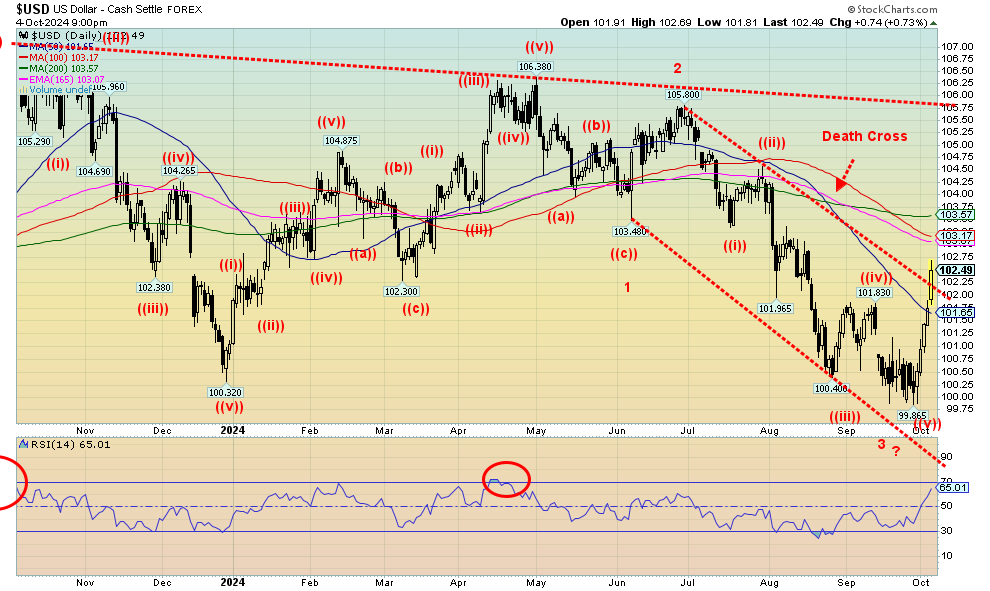
Source: www.stockcharts.com
The US$ Index jumped 2.4% this past week, one of its best performances in a week as it took us back to levels last seen in August. The other currencies bore the brunt of the US$ Index success. The index rose because of the strong U.S. job numbers reported Friday, plus the drop in the unemployment rate. All this lessens thoughts that the Fed might cut 50 bp at its November meeting. The US$ Index was also meeting some safe haven demand due to the potential expansion of the Middle East war. The euro fell 1.7%, Swiss franc was down 2.1%, pound sterling was off 1.9%, while the Japanese yen took the brunt, falling 4.5%. The Canadian dollar (Cdn$) was the best, down only 0.5%. Rising oil prices helped the Cdn$.
We now appear to have broken that downtrend line and may have completed a third wave down. If so, this is a fourth wave and it appears to be a potentially swift one. These type of rises normally don’t last. But we can’t rule out a rise to resistance near 103.50 before this turns around. We would not want to see 104.50 taken out as that would signal the end of the mini-bear for the US$ Index. Support is down to 101.50, but under that level we could retest the lows near 99.85.
Source: www.stockcharts.com
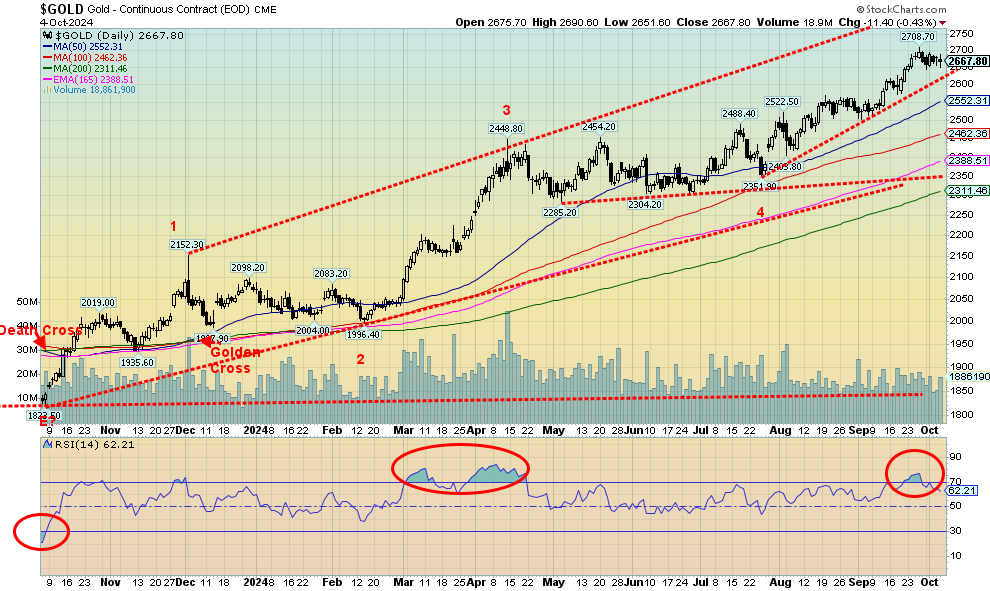
Gold was flat on the week—okay, off 0.01%. Given that the US$ Index jumped higher and bond yields rose, that gold remained flat was a positive sign. Gold is a safe haven and the beating of war drums in the Middle East has not gone away. Nor has the monstrous debt in the U.S. and the world. Nor have deep political divisions in the U.S. and an overvalued stock market that many claim is in a bubble. Silver didn’t stay flat as it rose 1.8%. Platinum can’t seem to get out of the way of itself and fell 2.0%. Of the near precious metals, palladium lost 2.4% and copper was off 0.7%. The gold stocks had a down week with the Gold Bugs Index (HUI) down 3.1% and the TSX Gold Index (TGD) off 2.0%. But, as we note later, we did see some life in a number of junior mining stocks. That sector has been moribund, even as the larger cap gold stocks have enjoyed a banner year.
Gold also reacted negatively on Friday following the job numbers, as the strong report seemed to nix thoughts of a 50 bp cut. A 25 bp cut remains a possibility. Gold has been knocking on $2,700 and it has not been unusual to see pauses at these even levels. We saw it at $2,500 and $2,600 before we pushed higher. The trend remains up. Gold has gained 28.8% thus far in 2024, making it already one of the best years ever.
Gold did get a bit overbought at $2,700 as the RSI went over 70 but has since pulled back to 62. We note the 50 RSI level has acted as reasonable support over the past six months. A drop under $2,650 would be short-term negative and under $2,600 we could fall further to $2,550. But with numerous pullbacks along the way, the advance appears strong as pullbacks remain shallow. The only caveat for gold continuing to rally is now is that October is not normally a good month for gold. In the past we’ve seen selloffs start in October and the low doesn’t come until December. 2015 is still remembered as was 2016. But with the current background of war, divisions, debt, etc., gold should really only have one way to go and that is up. Even if we pause first.
Source: www.stockcharts.com
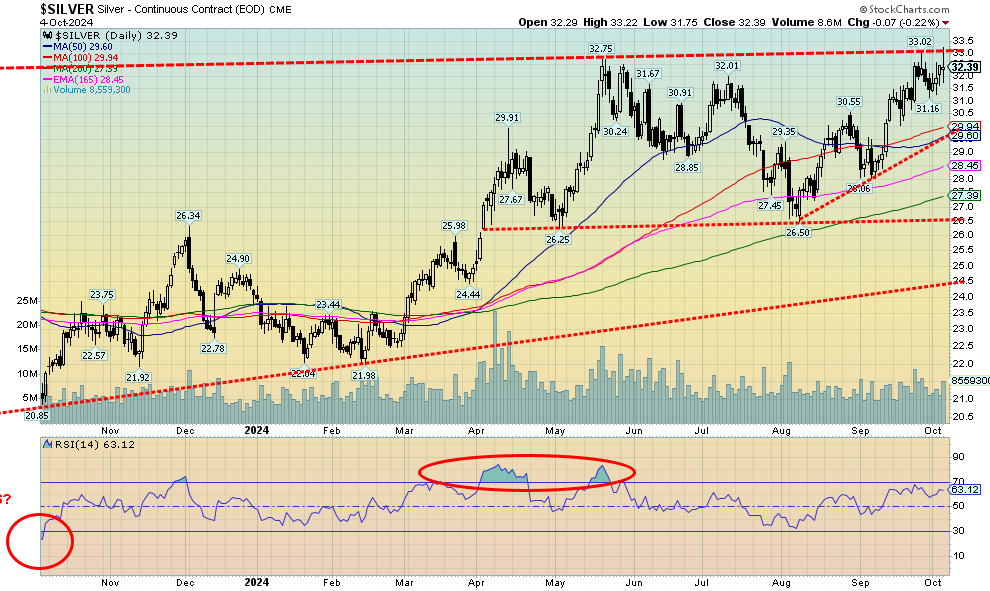
Silver appears to have made a slight new high on Friday’s volatile day. It finished the day off small but did manage to end the week up 1.8%, outpacing gold. That said, we continue to bang up against that resistance zone at $33, hitting a high of $33.22 but closing at $32.39. It highlights the $33 resistance zone which has held us back now since May. Still, silver is up 34.5% on the year, making it one of its best years ever. We read that, according to Bloomberg, silver needs a $2.1 trillion investment by 2050 to meet rising demand for net-zero demand. There was also a mega-merger this past week of Silvercrest Metals (SIL/TO) and Coeur Mining (CDE/NYSE). But the merger is being met with a lukewarm reception as CDE fell after, down 9.5% on Friday, while SIL rose 9.7% the same day. Could other suitors for SIL emerge?
Silver needs to break through $33 to suggest to us that we are on our way to long-held targets up at $38–$40. Higher targets are also noticeable, but let’s get the first one. Silver’s RSI is only 63 so it is not yet overbought and has room to move higher. Long-term support is down at $29, but under that level long-term support comes in around $26.50. We remain bullish on silver and expect at some point to see new all-time highs above $50. First, let’s get through $33 and keep pullbacks shallow.
Source: www.stockcharts.com
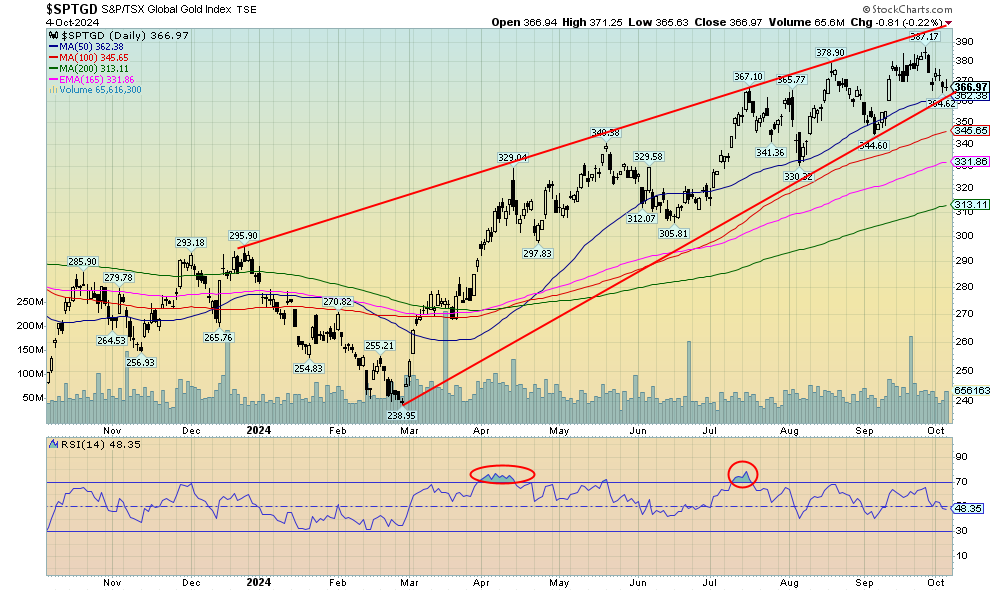
Despite silver being up and gold flat on the week, the gold stocks waffled and finished the week down. The TSX Gold Index (TGD) fell 2.0% while the Gold Bugs Index (HUI) was off 3.1%. On the good news side, we did see positive movement in some junior gold mining stocks this past week. In the TSX Venture Exchange (CDNX), which is over 50% junior mining stocks, many of the gold companies rose 2.1% this past week, one of the better performers for indices. While we remain bullish on the gold stocks into 2025, we continue to wonder if a short-term correction is in the offing. Can’t say we liked the pullback this week, especially with silver putting in a decent week to the upside. As well, that pattern still has the look of an ascending wedge triangle (bearish), which is getting narrower as we move higher. Right now, a break of 360 would do the trick, but we need to break under 345 to put more downward pressure on the sector. We would not want to see 305 or 295 taken out on the downside as that could signal a more serious decline. We never really became overbought on this up so we may still recover yet. The background remains bullish for both gold and silver and that in turn helps the stocks. Both indices are up 29%/30% this year.
Source: www.stockcharts.com
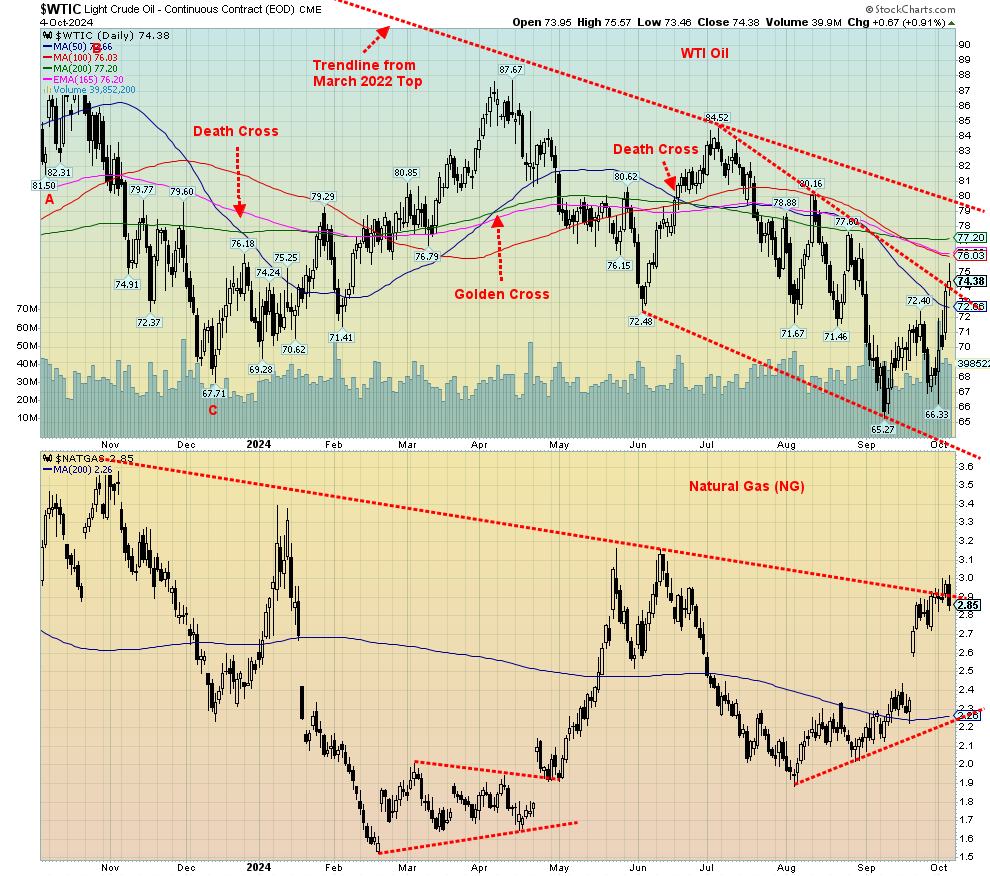
Nothing like a little war in the Middle East that could involve Iran to get oil prices jumping. The trouble with this is that, despite threats to blow up the Iranian oil fields or their nuclear facilities, it could also all turn to pixie dust in a heartbeat. Blow up the oil fields, and then the Straits of Hormuz get threatened. And with U.S. warships hanging nearby, the whole thing could turn into a major conflict. Or nothing could happen and oil’s gains would quickly evaporate. As we noted, it is one of our black swan scenarios. But as we have noted, this is a could happen, not a will happen.
But one step at a time. Yes, we’re up as WTI oil jumped 9.1% this past week and Brent crude is up 8.6%. Natural gas (NG) didn’t quite join the party due to injections and fell 1.7%. NG is driven by hurricanes in the Gulf but facilities didn’t suffer much from Helene. The EU Dutch Hub NG was up 5.4% on the week on fears of gas supplies and facilities being hit in the expanding Mid-East war. As to the stocks, the ARCA Oil & Gas Index (XOI) rose 7.0% while the TSX Energy Index (TEN) jumped 8.5%. Energy stocks are quickly turning bullish once again.
Regardless of what happens now in the Middle East wars, the WTI oil looks bullish. A low followed by a higher low could be the start of an uptrend. Unless, of course, we were to collapse back down and take out $66. A break back under $67.50 would be a warning sign. We would not want to see WTI drop back under $70. But there is still work to do as the next resistance zone is up at $77 and then finally $79/$80. Once over the latter, it could be clear sailing for WTI to rise to $100.
All this is happening against the background of Libya announcing the lifting of an oil embargo. That could bring an additional 700,000 b/d of light Libyan crude to the market. We also learned that Kazakhstan has been defying OPEC limits and is producing some 170,000 b/d over its quota. Also helping out is the seemingly quick end to the U.S. port strike.
But at the end of the day, the more bearish elements for oil are being ignored as everyone is centered on how Israel is going to retaliate against Iran. No matter the how, oil prices could rise further.
Copyright David Chapman 2024
GLOSSARY
Trends
Daily – Short-term trend (For swing traders)
Weekly – Intermediate-term trend (For long-term trend followers)
Monthly – Long-term secular trend (For long-term trend followers)
Up – The trend is up.
Down – The trend is down
Neutral – Indicators are mostly neutral. A trend change might be in the offing.
Weak – The trend is still up or down but it is weakening. It is also a sign that the trend might change.
Topping – Indicators are suggesting that while the trend remains up there are considerable signs that suggest that the market is topping.
Bottoming – Indicators are suggesting that while the trend is down there are considerable signs that suggest that the market is bottoming.
Disclaimer
David Chapman is not a registered advisory service and is not an exempt market dealer (EMD) nor a licensed financial advisor. He does not and cannot give individualised market advice. David Chapman has worked in the financial industry for over 40 years including large financial corporations, banks, and investment dealers. The information in this newsletter is intended only for informational and educational purposes. It should not be construed as an offer, a solicitation of an offer or sale of any security. Every effort is made to provide accurate and complete information. However, we cannot guarantee that there will be no errors. We make no claims, promises or guarantees about the accuracy, completeness, or adequacy of the contents of this commentary and expressly disclaim liability for errors and omissions in the contents of this commentary. David Chapman will always use his best efforts to ensure the accuracy and timeliness of all information. The reader assumes all risk when trading in securities and David Chapman advises consulting a licensed professional financial advisor or portfolio manager such as Enriched Investing Incorporated before proceeding with any trade or idea presented in this newsletter. David Chapman may own shares in companies mentioned in this newsletter. Before making an investment, prospective investors should review each security’s offering documents which summarize the objectives, fees, expenses and associated risks. David Chapman shares his ideas and opinions for informational and educational purposes only and expects the reader to perform due diligence before considering a position in any security. That includes consulting with your own licensed professional financial advisor such as Enriched Investing Incorporated. Performance is not guaranteed, values change frequently, and past performance may not be repeated.
About the author


Website: https://www.enrichedinvesting.com
Disclaimer: David Chapman is not a registered advisory service and is not an exempt market dealer (EMD) nor a licensed financial advisor. We do not and cannot give individualised market advice. David Chapman has worked in the financial industry for over 40 years including large financial corporations, banks, and investment dealers. The information in this newsletter is intended only for informational and educational purposes. It should not be considered a solicitation of an offer or sale of any security. The reader assumes all risk when trading in securities and David Chapman advises consulting a licensed professional financial advisor before proceeding with any trade or idea presented in this newsletter. David Chapman may own shares in companies mentioned in this newsletter. We share our ideas and opinions for informational and educational purposes only and expect the reader to perform due diligence before considering a position in any security. That includes consulting with your own licensed professional financial advisor.