
Does everyone have their hard hats on? Nasty week. Difficult to find anything that was spared. Market short ETFs did well and put options. Does everyone feel liberated yet? Friday was the third largest point drop for the Dow Jones Industrials (DJI) ever. Note point drop, not percentage drop. That still belongs to October 19, 1987. Still an overall 10% drop for most U.S. stock indices wasn't pleasant. Canadian indices did better.
The message is does everyone feel liberated yet? Tariffs imposed by the Trump administration have upended the world signaling an end to the world as we knew it. 1930's redux? Not since Smoot-Hawley 1930. And we know how that ended. We look back at some history of tariffs including in 1828 and again during the period of the Long Depression of the 1870s to 1890s. None of them were good but the oligarchs thrived. History does not necessarily repeat but it does rhyme. Stocks well positioned for resilience in weak economic growth include value retailers such as Dollarama Inc. which reported increased sales, EBITDA, and income, announced a higher dividend, and is held in the Enriched Capital Conservative Growth Strategy.*
The U.S. March job numbers came out and they were far better than expected but then these numbers only go to about mid-March avoiding all the firings and gyrations later in the month. Next month may not be so rosy. But Canada's job numbers were not great, well below expectations. Job numbers are the subject of our chart of the week (page 10).
Nothing was spared this past week as even gold, silver, gold stocks, and even junior mining stocks were all hit. 10% drops or even more were not unusual. A few indices made 52-week lows and others are getting close. Oil and energy stocks in particular were hit hard making 52-week lows. The best performer year to date has been the precious metals gold, silver, etc. Our expectation now is that things could remain weak into May even as we expect gold itself to hold up better than most everything else.
We have been plunged into the unknown. Eventually we expect the stock markets to be down at least 50%. The NASDAQ and a few others, especially the MAG7 have entered official bear markets. Others will join soon. Crumbling geopolitics, economic uncertainty, loss of faith in government, and a potentially crumbling U.S. dollar will ensure gold remains elevated even as the gold stocks and silver join the rest. In previous bear markets, the gold market was the first to bottom and begin to rise again.
This week brings us the March CPI and PPI. Will there be any surprises?
We try to be optimistic. Prepare for the worst. Hope for the best. The sun still comes up every morning. And as always have a great week.
DC
* Reference to the Enriched Capital Conservative Growth Strategy and its investments, celebrating a 7-year history of strong growth, is added by Margaret Samuel, President, CEO, and Portfolio Manager of Enriched Investing Incorporated, who can be reached at 416-203-3028 or msamuel@enrichedinvesting.com
“Commodities such as gold and silver have a world market that transcends national borders, politics, religions, and race. A person may not like someone else’s religion, but he’ll accept his gold.”
—Robert Kiyosaki, American businessman and author known for Rich Dad, Poor Dad, a series of personal finance books, is currently being sued in a class action lawsuit concerning his company Rich Global LLC, which is in bankruptcy; b. 1947
“I never attempt to make money on the stock market. I buy on the assumption that they could close the market the next day and not reopen it for five years.”
—Warren Buffett, American investor and philanthropist, chairman and CEO of Berkshire Hathaway, estimated net worth $164.8 billion, fifth richest individual in the world; b. 1930
“I did not know that mankind was suffering for want of gold. I have seen a little of it. I know that it is very malleable, but not so malleable as wit. A grain of gold will gild a great surface, but not so much as a grain of wisdom.”
—Henry David Thoreau, American naturalist, essayist, poet, philosopher, transcendentalist, author of the book Walden and essay Civil Disobedience; 1817–1862
April 2, 2025, is “Liberation Day”, according to U.S. President Donald Trump. Some call it “Demolition Day”. With President Trump’s announcement, the conclusion is that the era of globalization is over. While numerous countries were hit, especially China and even Japan, Korea, and Taiwan, Canada was largely spared, except for what had already been announced on steel, aluminum, and autos. As long as Canada’s goods are compliant with the USMCA, they are exempt. Trump announced it as “the day that America was reborn.” The rest of the world may beg to differ. What Trump describes as reciprocal tariffs is more like the rest of the world responding reciprocally to the U.S. tariffs. Move over Smoot-Hawley. We have Trump. Welcome to the global trade war.
Looking back at history there is a sense of déjà vu. Tariffs have a long history in the U.S., dating back to the colonial period and the American Revolution. There were periods of high tariffs followed by periods of low tariffs, depending on who was in charge. During the 1820s, tariffs were pushed up. What was known as the Tariff of Abominations came into effect in 1828. There were numerous threats concerning the tariffs and the U.S. South in particular was not happy about it. They threatened to secede. In 1833, the tariffs came off. A stock market bubble took place and in 1837 the stock market crashed, taking banking institutions with it. It was followed by a depression in the 1840s known as the Hungry Forties. The stock market bottomed in 1843.
Then came another long period of tariffs, starting with the Morrill Tariff of 1861 under President Abraham Lincoln. The high tariffs at the time were meant to allow the industrialization of the U.S., mostly in the North, to help finance the U.S. Civil War. However the tariffs continued after the war, pushed by northern industrialists to protect their industries and profits.
High tariffs remained in place during the period that was known as the Gilded Age. This period was one of rapid industrialization, mass immigration, growth of urban centers, and extreme wealth alongside
inequality and poverty. While, overall, poverty dropped during the Gilded Age, it was still at roughly 44% during the late 1890s, although that was down from 62%. It was also a period of recessions and depressions. There was the period known as the Long Depression that lasted between 1873 to 1879 where overall business activity collapsed by 33.6%. It was the bursting of the post-Civil War bubble. In 1873 there was a panic when the Coinage Act suppressed the price of silver, contributing to a collapse of mining interests.
That wasn’t the end of it. Continued high tariffs contributed to steep recessions during 1882–1885, 1887–1888, and 1890–1891. Then there was the Panic of 1893 with the collapse of the Reading Railway, followed by the Panic of 1896. Strikes, the rise of populist movements, and more characterized the entire period of the Gilded Age. It was the period of the wealthy industrialists led by J.P. Morgan (banking), John D. Rockefeller (oil), Andrew Carnegie (steel), and Cornelius Vanderbilt (railways). The robber barons. Today we have Elon Musk (X, SpaceX), Jeff Bezos (Amazon), and Mark Zuckerberg (Meta). The new era of robber barons?
No matter how one looks at it, tariffs cause prices to rise and inflict pain on the areas impacted. They also spark political backlash and currency chaos. During the Gilded Age, the era was mostly ruled by Republican presidents (eight in total) and two Democrats. Actually, only one Democrat Grover Cleveland was elected twice but not consecutively. He opposed tariffs but was unsuccessful in ending them.
Canada, along with other countries, retaliated with tariffs. As a result of the tariffs, Canada made moves to strengthen ties with Britain and other countries. The U.S. thought the tariffs would so much damage to Canada economically that Canada would come crawling to merge with the U.S. Sound familiar? Tariffs hit as high as 60%. Trump is a big fan of President McKinley for his trade policies. Trump should hope he doesn’t wind up like McKinley who was assassinated in 1901.
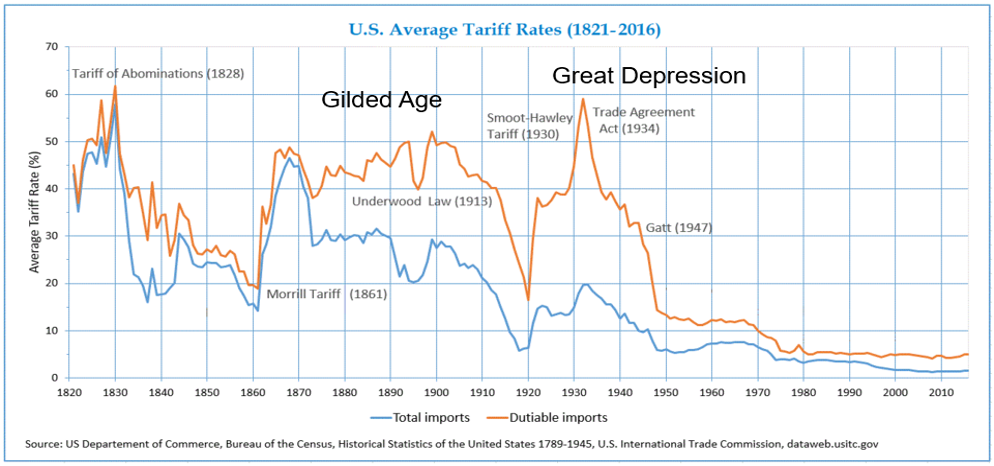
Source: www.commerce.gov, www.census.gov, www.dataweb.usitc.gov
Another way of looking at this comes courtesy of Octavio Costa of Crescat Capital (www.crescat.net). Mr. Costa notes that while these tariffs are not dissimilar to the tariffs of Smoot-Hawley, the stock market today is far more overvalued than it was in 1929–1930. 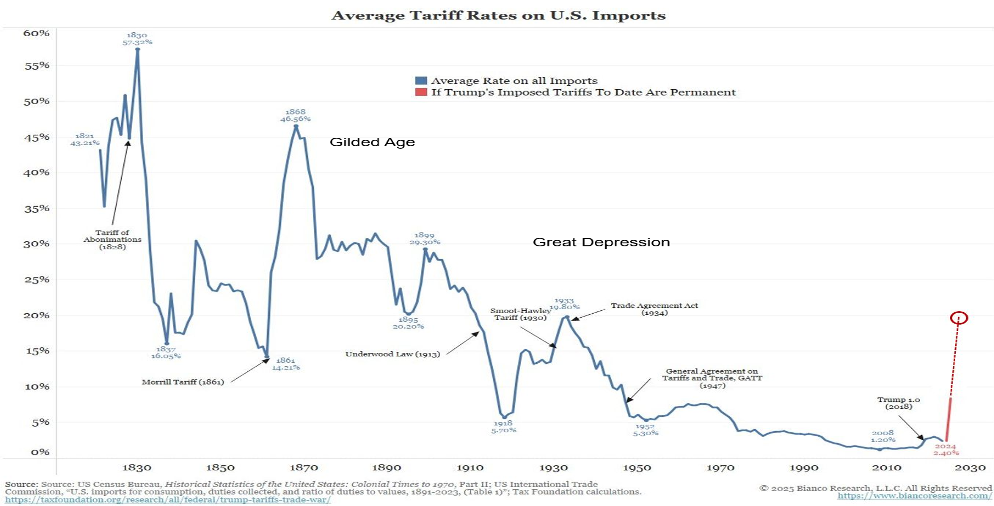
Source: www.biancoresearch.com,www.census.gov, www.taxfoundation.org/research/all/federal/trump-tariffs-trade-war, www.usitc.com, www.crescat.net
One can see from the chart the tariffs that were placed, starting in 1861 and held throughout the Gilded Age. Tariffs finally came down under President Teddy Roosevelt, but they didn’t fully end until 1913 under what was known as the Underwood Law. Note how imports collapsed through the period. But they began to rise again in the 1920s. Then came the Smoot-Hawley Act of 1930 and tariffs were back on. But, once again, the retaliation was swift and trade wars helped contribute to the Great Depression. Eventually, they came to their senses with the Trade Agreement Act of 1934, and then the General Agreement on Tariffs and Trade (GATT) in 1947. Unfortunately, today’s tariffs are just getting underway, so it may be more than a few years before we are knocked back to our senses. In the interim, a severe recession is most likely a given. It could even turn into a depression.
The following chart highlights the period of the Long Depression, the Gilded Age, and the Great Depression. Notice how, during the period of the Long Depression and the Gilded Age, the stock market effectively went nowhere, even though there were two periods of sharp downturns. The Great Depression had its major collapse in 1929–1932, followed by a secondary collapse in 1937–1939 before the outbreak of World War II. Depression and war go hand in hand. The Gilded Age ended with the Spanish-American War of 1898 as well as the Boer War of 1899–1902, followed by the U.S. Philippines War of 1899–1902. There was also the Boxer Rebellion of 1899–1901 that involved not just China but eight imperial nations, including the U.S., Britain, Germany, and Russia as the colonialists tried to carve up China. These wars were small and regional when compared to not only World War II but also World War I.
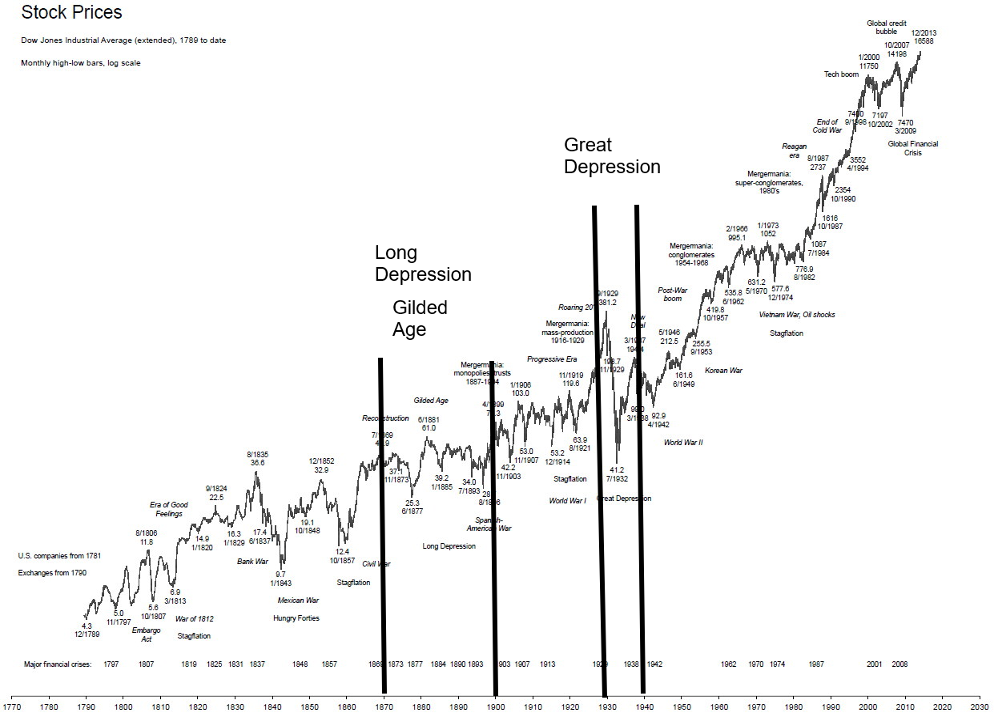
Source: www.goldchartsrus.com
We conclude with a chart of the Dow Jones Industrials (DJI) for 1928–1939. This period includes the Crash of 1929, the Smoot-Hawley Act of 1930, and the Gold Reserve Act of 1934. The 1930s was also a period of sovereign debt crises and defaults. Many countries were over-indebted. As a result, they were hit by the economic shock of the tariffs. The world was still on a gold standard which meant currencies were fixed. This meant they had to deflate their economies, which in turn made it harder to service their debt. With countries at each other’s throats, it was hard to get any coordinated response to the imposition of tariffs. Defaults were rampant, as Germany and others defaulted on their debt. Even in Canada the province of Alberta defaulted, sparking the Government of Canada to bail them out. Newfoundland also needed a bailout, even though it was not yet a province of Canada. There were banking panics, not just in the U.S. but also across Europe. Political instability rose, leading to the rise of the Nazis in Germany in 1933.
Dow Jones Industrials (DJI) 1928–1939
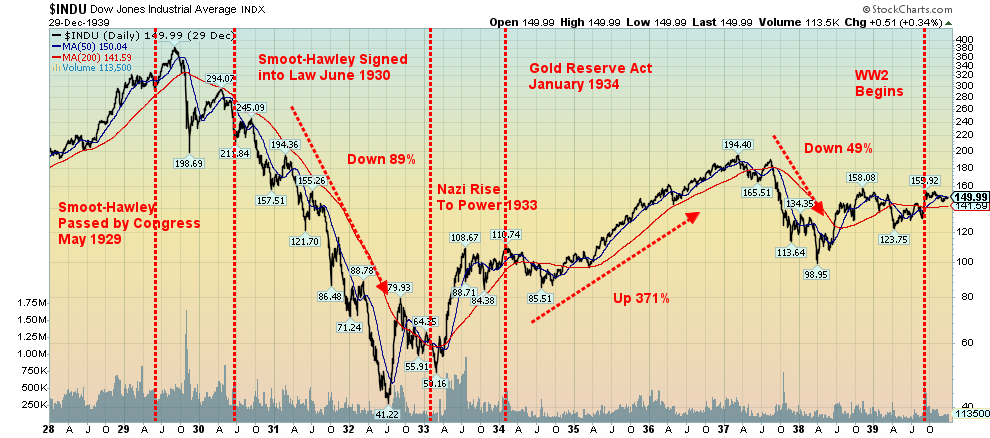
Source: www.stockcharts.com
As the crisis deepened, Canada and Britain suspended the Gold Standard in 1931. Because of the turmoil, there was a huge movement of funds from Europe to the U.S., sparking a sharp rise in the value of the U.S. dollar. That ended with the devaluation of the U.S. dollar by the Gold Reserve Act of 1934 which raised the gold price from $20.67/ounce to $35 per ounce. The U.S. dollar fell.
We are entering a period of unknowns. “History doesn’t repeat itself, but it often rhymes.” (Mark Twain). Unemployment will rise. Defaults will rise. There is the potential for a sovereign debt crisis in an over-indebted world. Political instability will rise with the potential to look to fascist governments as the solution. A steep recession is a certainty. A depression is possible. The global world order is fraying and on the verge of collapse. Global war is inevitable.
We conclude with a chart showing how trade policy concerns have soared. Global cooperation appears to be a bygone word. It’s now every country for itself.
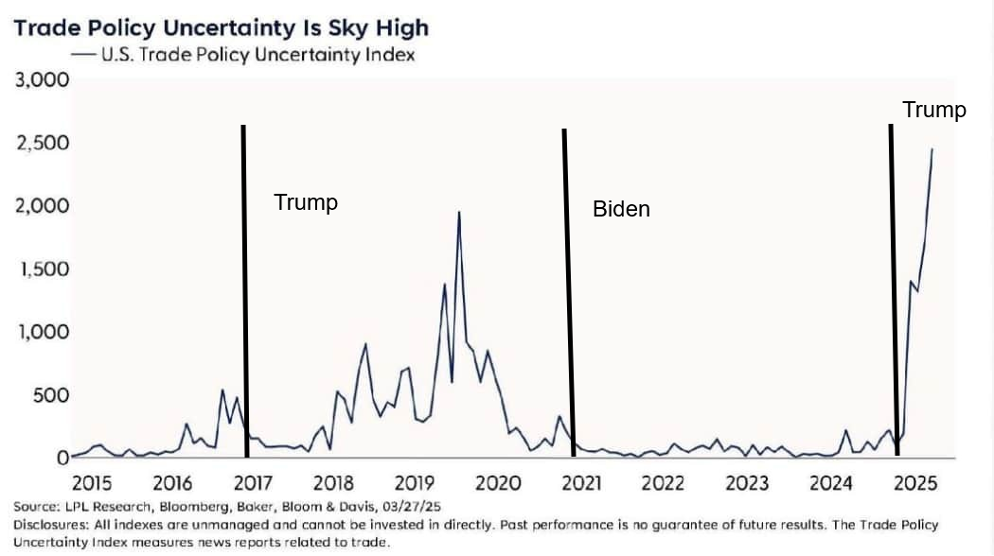
Source: www.marketwatch.com, www.bloomberg.com, www.lpl.com, www.nber.org
Chart of the Week
US Job Numbers
Employment Rate vs. Unemployment Rate 2015–2025
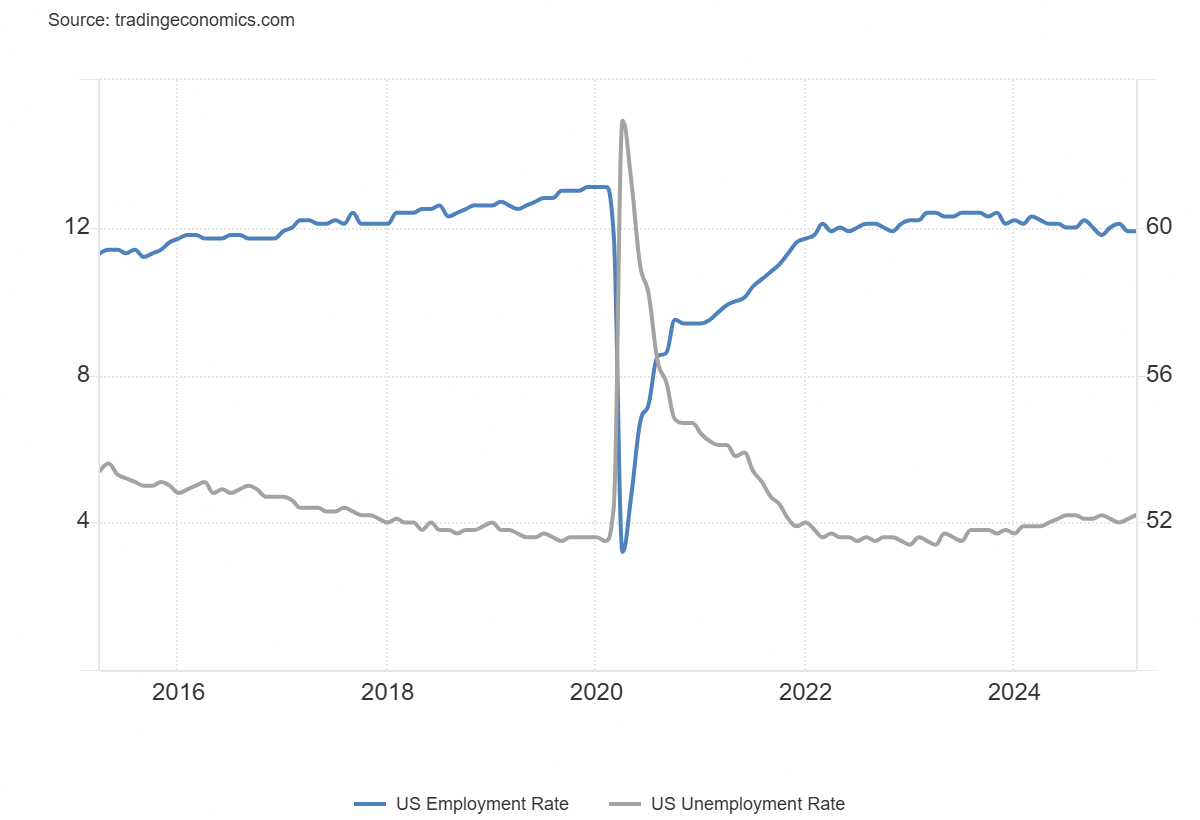
Source: www.tradingeconomics.com, www.bls.gov
We’ve learned over the years that when it comes to the monthly job numbers, expect the unexpected. So once again we should not have been surprised that March’s nonfarm payrolls were once again a complete surprise. The expectation for nonfarm payrolls was for jobs to increase by 80,000 to 135,000. Instead, we got 228,000. The simple response is WTF. But, but tariffs! Yes, we’ve got tariffs, but these numbers were all compiled before the tariffs were imposed. Hence the big surprise. Possibly things will become clearer at the May release. For the record, the previous two months were revised downward by 48,000.
One thing that does stand out in looking at the chart of the employment rate vs. the unemployment rate is that the employment rate is in a gentle downtrend while the unemployment rate is in a gentle uptrend. That trend should not be ignored, despite the surprising numbers. It is noteworthy that the previous two months were revised downward. Downward revisions are not unusual. The unemployment rate (U3) rose to 4.2% from 4.1% while the employment rate (employment population ratio) was unchanged at 59.9%. But it was a surprise that the U6 unemployment rate (all persons marginally attached to the labor force, plus total employed part-time for economic reasons, as a percent of the civilian labor force plus all persons marginally attached to the labor force) actually fell to 7.9% from 8.0%. The Shadow Stats (www.shadowstats.com) unemployment number (U6 plus those deemed out of the labor market by definition made in 1994) remained unchanged at 27.4%. The number of people employed rose by 201,000 while the civilian labor force grew by 232,000. No surprise that the actual population level rose by 176,000. The number of those not in the labor force fell by 362,000, signaling that more people were moving into the labor force. The labor force participation rate actually rose 0.1% to 62.5%. All in all, a good report?
It got better, it seems. Full-time employment rose by 459,000 while part-time employment fell by 415,000. Government employment actually rose by 19,000 when they were expecting a decline of 5,000. Where’s Musk? Again, these numbers are before tariffs and mass firings, making things look rosier than they might actually be. Government hirings may have all been concentrated in state and municipal governments. That sector rose as did the health care and private education sectors. While it is estimated that some 280,000 federal government workers have been laid off, those still being paid or with severances are not counted as unemployed, yet. While the labor force participation rate rose, the participation rate for the price 25–54 age group actually fell 83.3%, the lowest since 2023.
The report may be somewhat misleading. It is before the tariffs. We just don’t know yet the impact of the tariffs on either employment or inflation. Nor do we know the full impact of the Musk firings or layoffs announced at numerous firms. The Fed will have time to think it all through as their next meeting isn’t until May 6–7. That will keep the market guessing. Some are expecting a number of rate cuts this year but overall, the expectation is for only two cuts. President Trump is pushing hard for rate cuts, setting up a possible clash with the Fed. But what if inflation stays high? This coming week we get the CPI and PPI.
As to the markets, well, the stock market focused on tariffs and fell sharply again, gold was walloped even as it made little sense because of strong cash flows from higher prices, while bond yields fell. The Atlanta Fed is still holding to its 2.8% contraction for Q1, suggesting that a recession may already be underway.
Canada Job Numbers
Canada Unemployment Rate vs. Employment Change 2015–2025
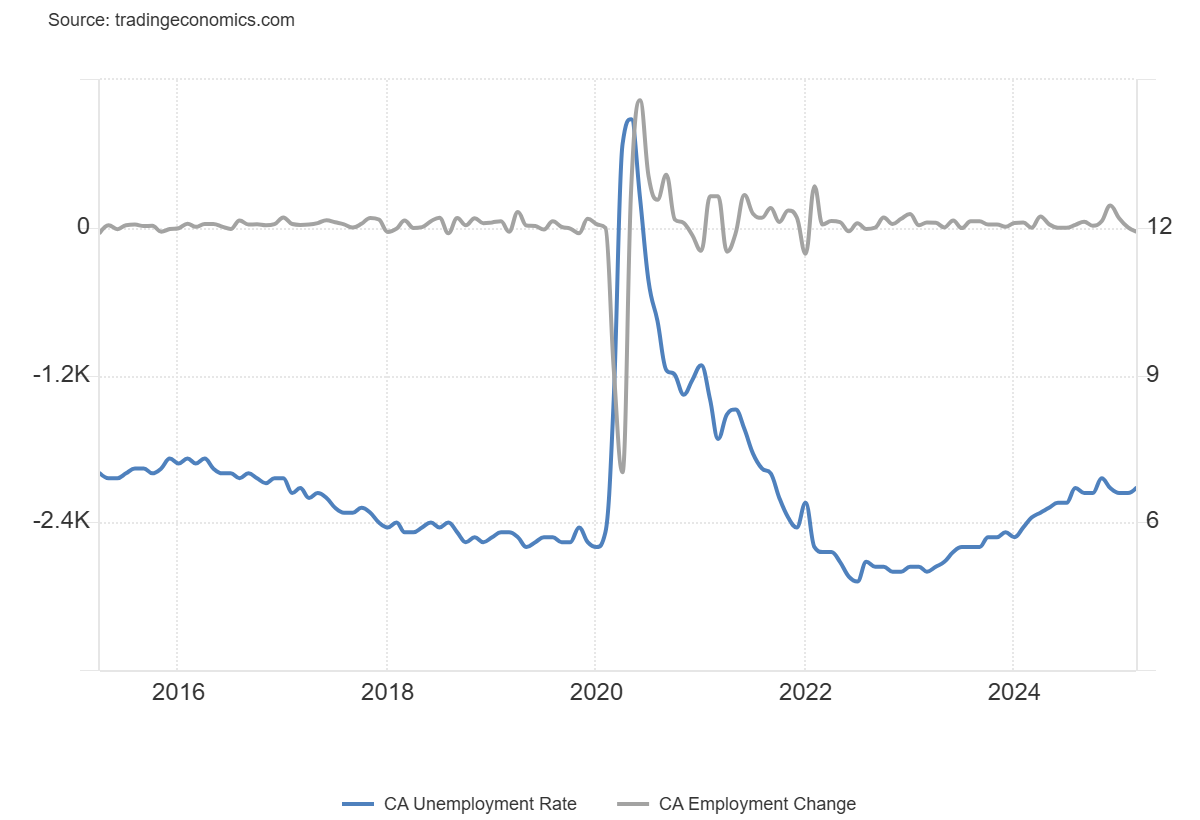
Source: www.tradingeconomics.com, www.statcan.gc.ca
If the U.S. was celebrating its employment numbers, there were no celebrations in Canada. The market was looking for a gain of 12,000 jobs. Instead, jobs fell 33,000. It was the first drop since January 2022. Remember, however, that before this Canada recorded job gains far exceeding expectations. Possibly this is just some rebalancing as employment gains overall have been strong for Canada. Full-time employment did fall by 62,000 but part-time employment rose by 29,500. Overall, full-time employment is up 336,200 over the past year while overall employment is up 470,300 over the past year. So, there does need to be some perspective.
The unemployment rate is ticking up again after falling last at 6.7% vs. 6.6%. The R8 unemployment rate (highest reported by StatsCan and adding in discouraged searchers, waiting groups, portion of involuntary part-timers) rose to 9.5% from 9.1%. Not helping going forward was the announcement that 6,000 auto workers had been laid off because of the tariff war. The employment-population ratio slipped to 60.9%, down 0.2%.
However, we remain up over the past several months. The Bank of Canada meets next on April 16. The expectation is that they may not do anything but wait instead to see what the fallout is from the tariff war. The expectation is that a recession is underway in Canada, just as it may also be underway in the U.S.
Overall, not a great report. As in the U.S., employment is faltering while unemployment is ticking up. As we have so often noted, unemployment is a lagging indicator so the impact of the tariffs is still to come.
Markets & Trends
|
|
|
|
% Gains (Losses) Trends |
|
||||
|
|
Close Dec 31/24 |
Close Apr 4/25 |
Week |
YTD |
Daily (Short Term) |
Weekly (Intermediate) |
Monthly (Long Term) |
|
|
ne |
|
|
|
|
|
|
|
|
|
S&P 500 |
5,881.63 |
5,074.08 |
(9.1)% |
(13.7)% |
down |
down |
up |
|
|
Dow Jones Industrials |
42,544.22 |
38,314.86 |
(7.9)% |
(9.9)% |
down |
down |
up |
|
|
Dow Jones Transport |
16,030.66 |
13,160.27 (new lows) |
(9.8)% |
(17.2)% |
down |
down |
down |
|
|
NASDAQ |
19,310.79 |
15,587.79 |
(10.0) |
(19.3)% |
down |
down |
up (weak) |
|
|
S&P/TSX Composite |
24,796.40 |
23,193.47 |
(6.3)% |
(6.2)% |
down |
down (weak) |
up |
|
|
S&P/TSX Venture (CDNX) |
597.87 |
575.92 |
(9.1)% |
(3.7)% |
down |
neutral |
neutral |
|
|
S&P 600 (small) |
1,408.17 |
1,155.99 (new lows) |
(9.1)% |
(17.9)% |
down |
down |
down (weak) |
|
|
MSCI World |
2,304.50 |
2,344.80 |
(5.4)% |
1.8% |
down |
down (weak) |
up |
|
|
Bitcoin |
93,467.13 |
83,491.90 |
(0.4)% |
(10.7)% |
down |
neutral |
up |
|
|
|
|
|
|
|
|
|
|
|
|
Gold Mining Stock Indices |
|
|
|
|
|
|
|
|
|
Gold Bugs Index (HUI) |
275.58 |
325.80 |
(9.3)% |
18.2% |
neutral |
up |
up |
|
|
TSX Gold Index (TGD) |
336.87 |
413.41 |
(8.5)% |
22.7% |
neutral |
up |
up |
|
|
|
|
|
|
|
|
|
|
|
|
% |
|
|
|
|
|
|
|
|
|
U.S. 10-Year Treasury Bond yield |
4.58% |
4.00% |
(5.9)% |
(12.7)% |
|
|
|
|
|
Cdn. 10-Year Bond CGB yield |
3.25% |
2.90% |
(4.3)% |
(10.8)% |
|
|
|
|
|
Recession Watch Spreads |
|
|
|
|
|
|
|
|
|
U.S. 2-year 10-year Treasury spread |
0.33% |
0.35% |
6.1% |
6.1% |
|
|
|
|
|
Cdn 2-year 10-year CGB spread |
0.30% |
0.53% |
(1.9)% |
76.7% |
|
|
|
|
|
|
|
|
|
|
|
|
|
|
|
Currencies |
|
|
|
|
|
|
|
|
|
US$ Index |
108.44 |
102.99 |
(1.0)% |
(5.1)% |
down |
down |
up |
|
|
Canadian $ |
69.49 |
.7021 |
0.5% |
1.0% |
up |
down |
down |
|
|
Euro |
103.54 |
109.51 |
1.2% |
5.8% |
up |
up |
down |
|
|
Swiss Franc |
110.16 |
116.06 |
2.3% |
5.4% |
up |
up |
neutral |
|
|
British Pound |
125.11 |
128.70 |
(0.6)% |
2.9% |
up (weak) |
up (weak) |
neutral |
|
|
Japanese Yen |
63.57 |
68.10 |
2.0% |
7.1% |
up |
up |
down |
|
|
|
|
|
|
|
|
|
|
|
|
|
|
|
|
|
|
|
|
|
|
Precious Metals |
|
|
|
|
|
|
|
|
|
Gold |
2,641.00 |
3,039.53 (new highs) * |
(1.4)% |
15.1% |
up |
up |
up |
|
|
Silver |
29.24 |
29.65 |
(13.0)% |
1.4% |
down |
up |
up |
|
|
Platinum |
910.50 |
904.90 |
(7.8)% |
(0.6)% |
down |
down |
up (weak) |
|
|
|
|
|
|
|
|
|
|
|
|
Base Metals |
|
|
|
|
|
|
|
|
|
Palladium |
909.80 |
895.50 |
(7.2)% |
(1.6)% |
down |
down |
down |
|
|
Copper |
4.03 |
4.83 |
(5.7)% |
19.9% |
neutral |
up |
up |
|
|
|
|
|
|
|
|
|
|
|
|
Energy |
|
|
|
|
|
|
|
|
|
WTI Oil |
71.72 |
61.99 (new lows) |
(10.6)% |
(13.6)% |
down |
down |
down |
|
|
Nat Gas |
3.63 |
3.83 |
(6.4)% |
5.5% |
down |
up |
neutral |
|
Source: www.stockcharts.com
* New All-Time Highs
Note: For an explanation of the trends, see the glossary at the end of this article.
New highs/lows refer to new 52-week highs/lows and, in some cases, all-time highs.
It was demolition week in the stock markets. Thanks to Liberation Day or, as we call it, Demolition Day, stock markets around the world roiled. Thursday and Friday were murderous. The Dow Jones Industrials (DJI) 2,231-point decline made it the third worst point drop day in the DJI’s history. Percentage-wise, it was only 5.5%, a long way off from the 22.6% drop of October 19, 1987. The percentage drop doesn’t even make the top 20. On the week, the S&P 500 fell 9.1%, the Dow Jones Industrials (DJI) was down 7.9%, the Dow Jones Transportations (DJT) was down 9.8% and fresh 52-week lows, and the NASDAQ fell 10.0%. The S&P 400 (Mid) fell 9.1% while the S&P 600 (Small) fell 9.1% as well, making 52-week lows, and is in an official bear market. The S&P 500 Equal Weight Index fell 5.9% while the NY FANG Index dropped 10.3%, making 52-week lows, and is down 26.2% from its all-time high also in a bear market.
Canada wasn’t spared as the TSX Composite dropped 6.3%, while the TSX Venture Exchange (CDNX) fell 9.1%. The EU was whacked with the London FTSE falling 6.8%, the Paris CAC 40 down 8.1%, the German DAX off 8.1%, and the Euronext down 8.8%. In Asia, China’s Shanghai Index (SSEC) fell 0.3% but was off on holiday on Friday. The Tokyo Nikkei Dow (TKN) fell 9.0% while Hong Kong’s Hang Seng (HSI) was a winner, down only 1.6%. The carnage was everywhere for Liberation Day as the U.S. unleashed a global trade war.
There is nothing good to say about any of this. Stories have surfaced that all this carnage is deliberate so that they can crash the global economy and remake it in their own image. Collateral damage is not relevant. We have mused as to whether this is deliberate. Given the emergence of stories supporting that thesis, it is very possible. The question is, how can one man create so much carnage? What’s worrying now are the rising delinquencies and defaults that could result in a banking collapse and crisis. We cannot rule that out.
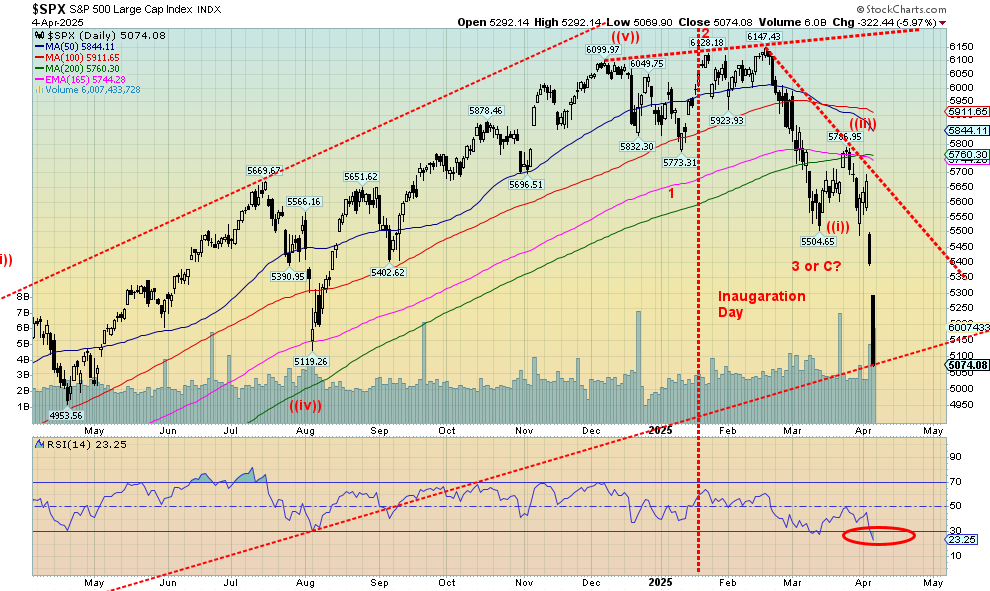
The S&P 500 gapped down Thursday and Friday in what appears as measuring gaps or runaway gaps. Runaway gaps are usually only in the middle of the decline. If that is correct, targets for the S&P 500 could be down to 4,800, another 5.5% drop. The S&P 500 is in correction territory but not yet in bear market territory. It’s no surprise we are under the 200-day MA. A rebound could occur anytime—even this week if the CPI and PPI are better than expected, or if the Fed announces quantitative easing (QE) to prevent a collapse. The 200-day MA near 5,760 would act as resistance. The S&P 500 is down 17.5% from its high, not quite yet in an official bear market. That point is close under 4,900. We note the RSI is at 23, signaling we are oversold. That suggests a rebound, and a bounce could occur at any time.
We have reached the end of the world as we knew it. What is coming is not a brave new world. It is something darker. Gold should remain a safe haven, regardless of any corrective action.
Source: www.stockcharts.com
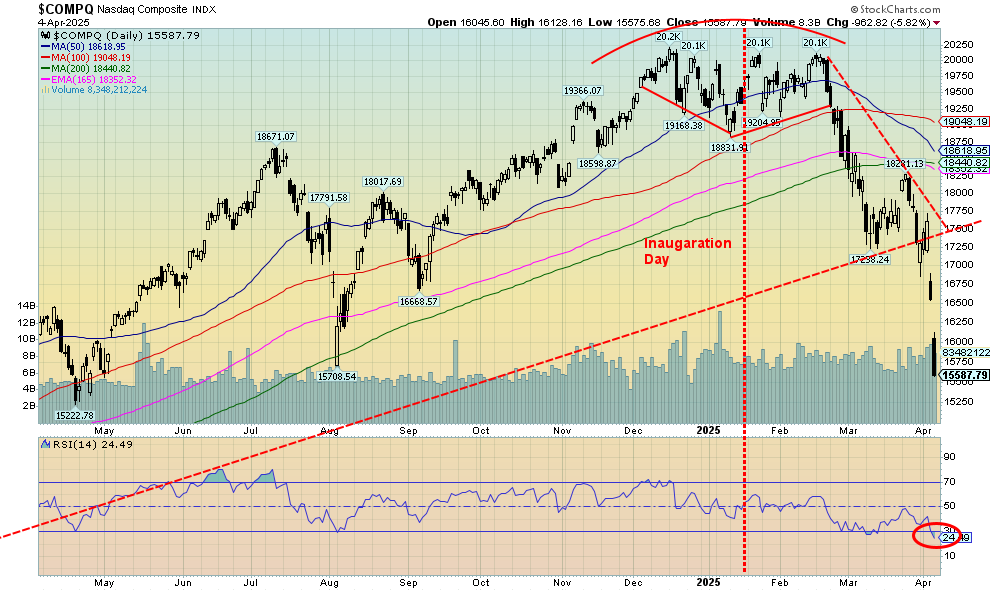
That was nasty. The NASDAQ just gapped down on both Thursday and Friday this past week, suggesting they are runaway gaps, just like the S&P 500. The measuring gap could take the NASDAQ to 14,300 at minimum. The NASDAQ fell 10.0% this past week and has now entered an official bear market, down 22.8% from the December high. The tech-heavy NASDAQ is dominated by the MAG7 which were, for the most part, slaughtered this past week. Nvidia led the way down 14.0% and down 29.8% in 2025. Apple dropped 13.6% and is down 24.8% in 2025. Meta fell 12.4% but is off only 13.8% on the year. Google did well, down 5.3% but down 22.4% in 2025. Google also made 52-week lows. Oh yes, and Tesla fell 9.2% this past week but is down 40.7% in 2025. Microsoft made 52-week lows, down a modest 5.0% and down 14.6% in 2025. MAGS, the ETF representing the MAG7, fell 10.2% and is down 24% in 2025. The NY FANG Index fell 10.3% and is down 20.9% so far this year. Any good news? Well, the NASDAQ is in oversold territory with an RSI near 24. A bounce? Yes. A reversal of this bear? Not likely. 18,300 is a long way away to suggest the low is in.
Source: www.stockcharts.com
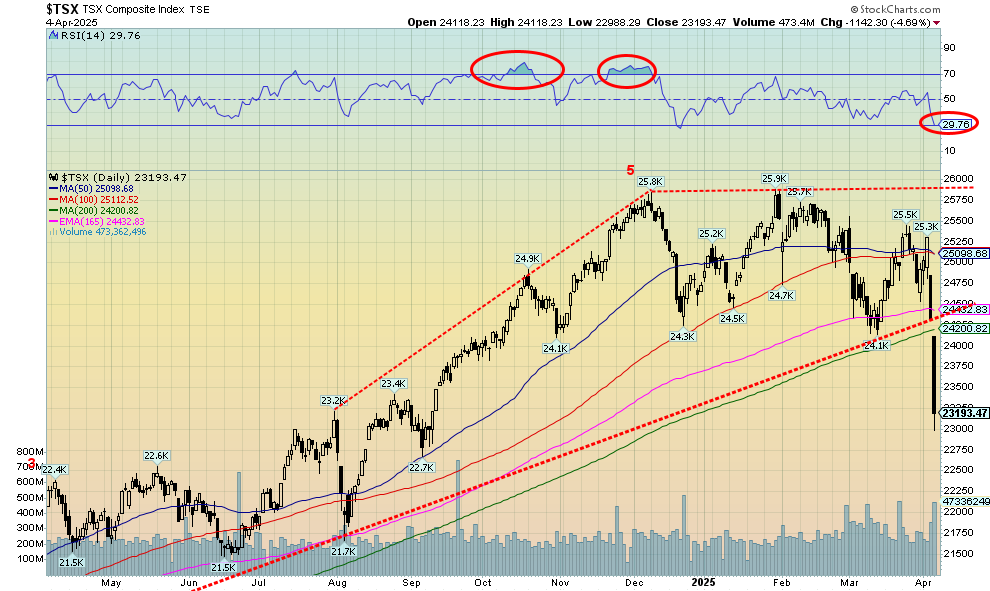
It’s no surprise that the TSX Composite did not escape the carnage elsewhere. It just wasn’t as bad as the TSX Composite fell 6.3% this past week and is now down 6.2% on the year. The TSX Venture Exchange (CDNX) wasn’t spared as it fell 9.1% and is now down 3.7% in 2025. Of the 14 sub-indices only one was up, Consumer Staples (TCS), up 2.0%. You know where a safe haven is. Taking big hits were Energy (TEN), down 12.9%, Metals & Mining (TGM), off 12.6%, Materials (TMT), down 10.1%, and Information Technology (TTK), off 10.2%. Metals and Materials fell because of fear of tariffs. Energy (TEN), Health Care (THC), and Industrials (TIN) all made 52-week lows. The TSX broke major support near 24,500. Potential downside targets are 22,700, but that’s just a minimum. We are now in correction territory, down 10.4% from the high. We are also under the 200-day MA. The RSI is sliding under 30, suggesting we are entering oversold territory. Like the U.S. market, a rebound would not be surprising. The reality is we need to regain above 25,300 to suggest a low might be in.
Source: www.stockcharts.com
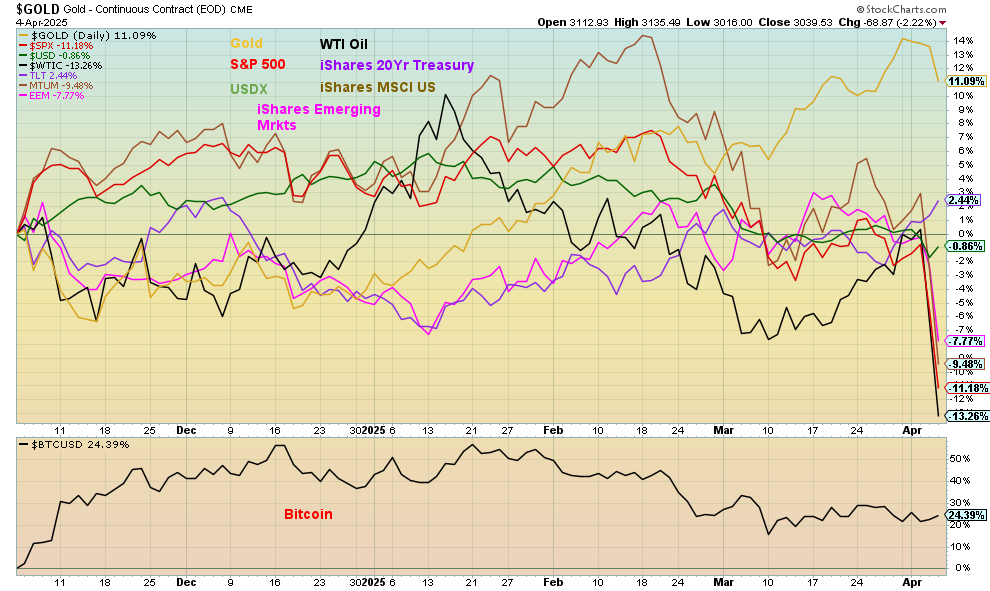
Our chart on performance since November 5 shows gold still in the lead despite the poor week. Gold is up 11.1% since November 5. At the other end is WTI oil, down 13.3%. Others that are now in negative territory include the S&P 500, the US$ Index, the MSCI Momentum ETF (MTUM), and the MSCI Emerging Markets ETF (EEM). The iShares 20-year bond (TLT) holds on to a small gain (before interest payments). Bitcoin remains the big winner, still up 24.4% but fading.
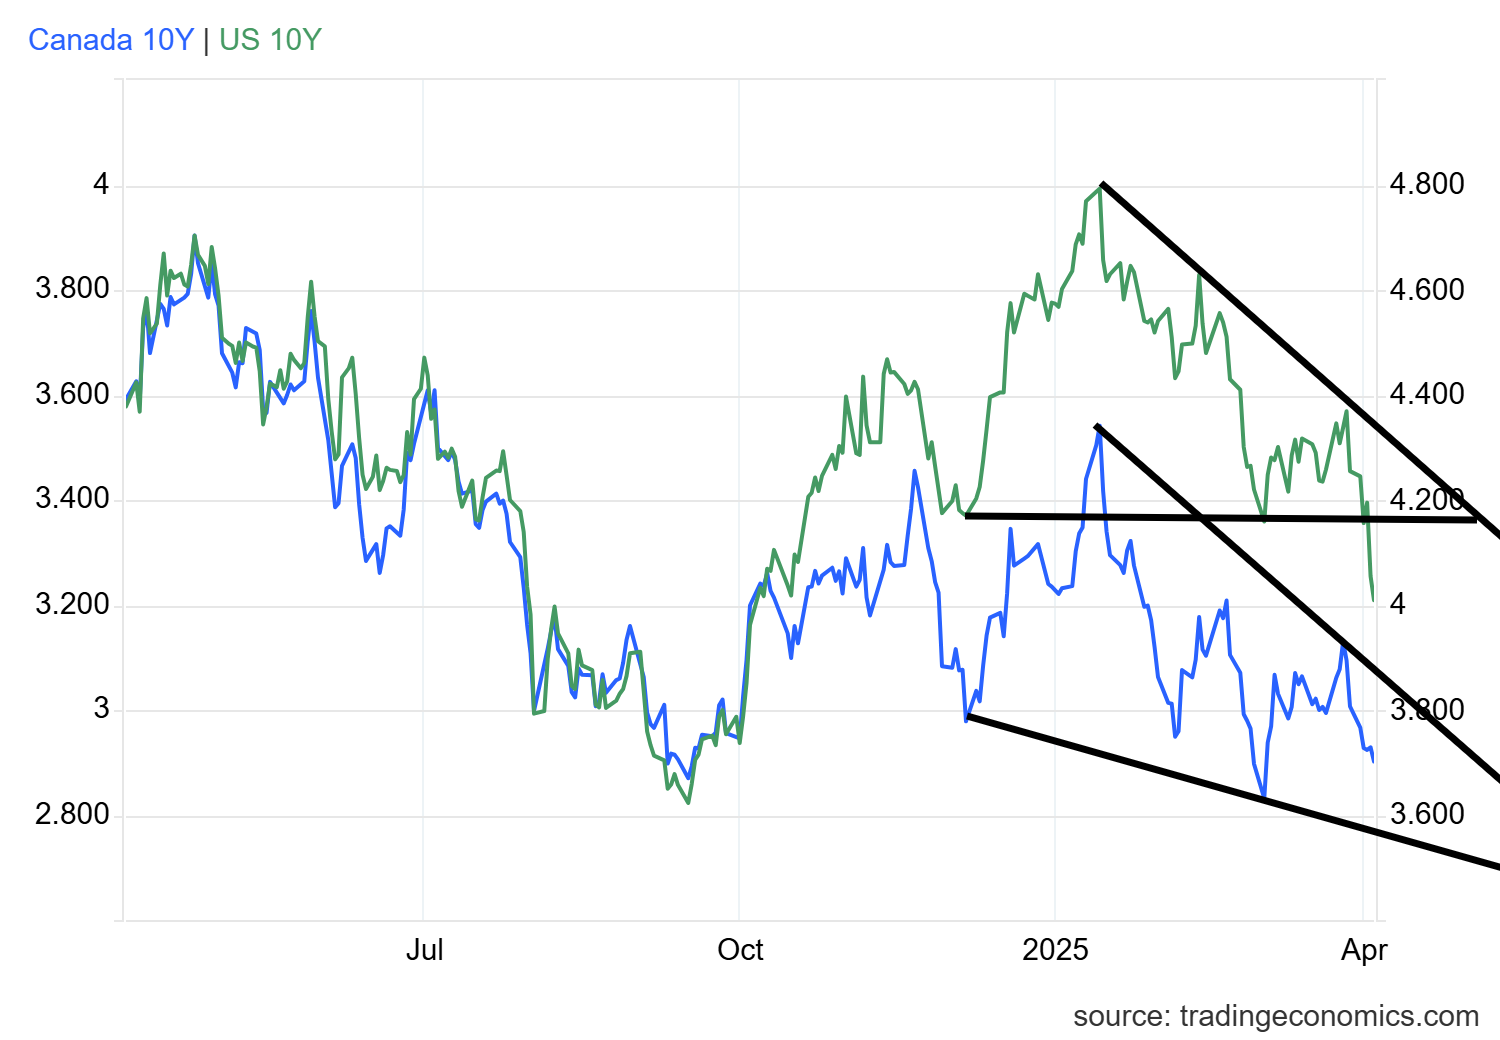
U.S. 10-year Treasury Note, Canada 10-year Bond CGB
Source: www.tradingeconomics.com, www.home.treasury.gov, www.bankofcanada.ca
Given the threat of recession because of the tariffs and chaos in the U.S., long-bond yields fell this past week. The 10-year U.S. treasury note fell to 4.00%, down 5.9% on the week. The Government of Canada 10-year bond (CGB) fell to 2.90%, down 4.3% on the week. The direction is good for mortgages and other instruments that are priced off the bond market. It’s also the direction President Trump wants as he is very desirous of lower rates. As we’ve already noted, inflation and other considerations will drive how the Fed acts. Their next meeting isn’t until May 6–7. Canada sets its interest rate decision on April 16. The recession spreads are still registering recession with the U.S. 2–10 spread at 35 bp and the Cdn 2–10 at 53 bp.
The direction of long rates still appears to be lower. The pattern isn’t on the U.S. notes but on the Canadian bond, we appear to be forming a descending wedge triangle that is ultimately bullish, meaning that long rates could rise again. While punishing tariffs could be put on the U.S. by China and even Japan, the real danger is they decide to start dumping U.S. treasuries. That in turn could put upward pressure on bond yields. Japan, as of January 31, holds almost $1.1 trillion of U.S. treasuries while China still has $760 billion. In total, foreign entities hold $8.5 trillion of U.S. debt, representing roughly 23% of all U.S. federal debt.
The other danger for U.S. debt is the coming debt ceiling fight. The U.S. could run out of cash by mid-May if Congress does not increase or suspend the debt limit. Currently, the U.S. has $36.6 trillion of debt outstanding of which $28.9 trillion is held by the public. The remainder is held by government agencies such as Social Security and Medicare. The debt limit is currently $31.4 trillion. It has, however, been constantly suspended. But every few months or so another crisis develops and the worst case is failure to agree and a dicey debt situation. U.S. federal debt is currently 122.6% of GDP. Of the G7, the U.S. debt is the third highest, behind Japan and Italy. Anything over 100% is a distinct drag on the economy.
The U.S. survives because the U.S. dollar is the world’s reserve currency and central banks have to hold U.S. treasuries. But as we know, the U.S. dollar is being challenged, particularly by the BRICS nations (Brazil, Russia, India, China, and South Africa, plus a host of others that have joined BRICS) as they develop an alternative to the global payments system SWIFT and even alternatives to the IMF, World Bank, and other international agencies. Trump has promised huge tariffs against the BRICS if they try and challenge U.S. dollar supremacy. From their perspective they want to get off the U.S. dollar supremacy system. Sanctions, etc. against Russia and others have sent the message that no country is safe. That in turn is a threat to the U.S. dollar and the U.S. bond market.
This week the CPI and PPI are out and will give us a read on the inflation situation.
Source: www.stockcharts.com
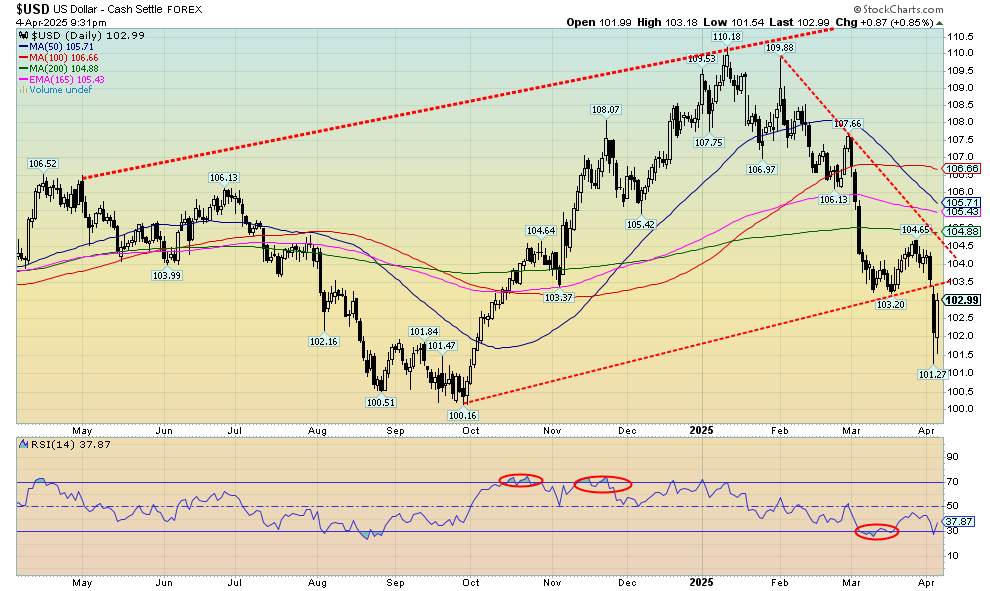
A sinking US$ Index is positive for gold and commodities. They are priced in U.S. dollars, so a drop in the U.S. dollar reprices gold and commodities higher to compensate for the drop in the dollar. The US$ Index appears to have broken an uptrend line at 103.50, sending the index lower with minimum targets to 102. Since we’ve already exceeded that, the next target is 101. The low this past week was 101.27. On the week, the US$ Index fell 1.0%, the euro was up 1.2%, the Swiss franc, showing its safe haven status, gained 2.3%, the pound sterling fell 0.6%, and the Japanese yen was up about 2.0%. The Canadian dollar, responding positively to being hit less than expected with tariffs, was up 0.5%. We could rebound and test that 103.50 breakdown level, but we’d have to break over 104.50 to suggest a low.
Source: www.stockcharts.com
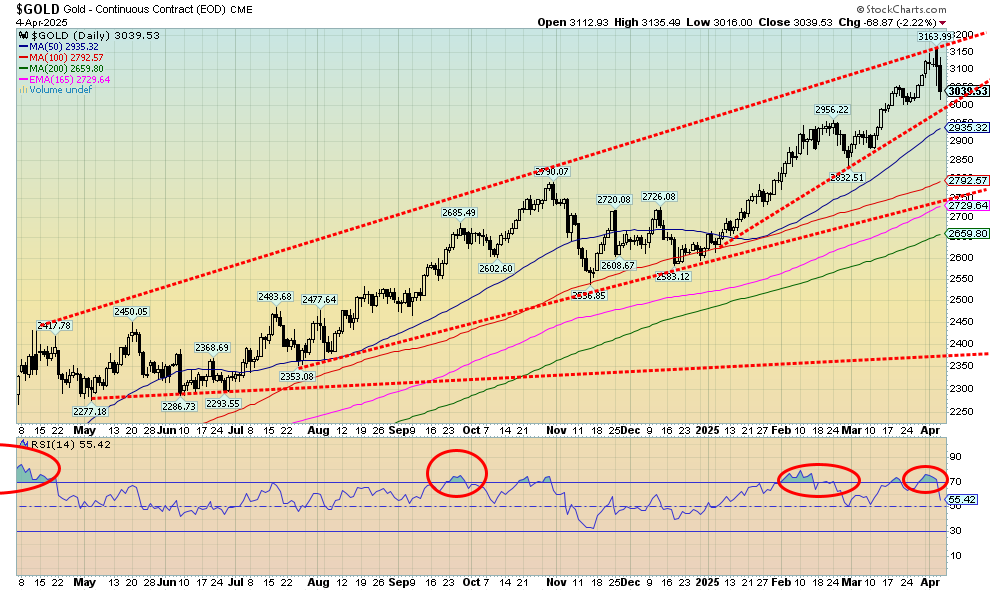
We’ve seen it in the past. The stock market gets beat up and gold follows. This week proved to be no exception, although the background remains very positive for gold going forward. We wish it were more like the 1987 stock market crash when the DJI fell 23% and gold rose 2.5%. That said, gold did pull back afterward. However, what usually happens is when the stock market gets hit hard gold also gets hit but nowhere near as badly. As to silver and gold stocks, well they are not gold and were hit just like the broader market. Gold lost only 1.4% this past week after making new all-time highs once again. A reversal week? Yes, and April 3 saw what looked like a key reversal day, meaning a new all-time high, a reversal, and a lower close below the previous day’s low. We also fell from overbought levels, so arguably a pullback was no doubt already going to happen. The most galling part was that on Friday, while gold was falling 2.2%, Bitcoin rose (up 0.4%). Is Bitcoin more valuable than gold? Hardly.
The prime reasons for holding gold haven’t changed: geopolitical tensions (that are rising further given the tariffs), economic uncertainty (thanks to tariffs), and loss of faith in government (again, the tariffs and how they are happening along with growing protests against the Trump administration). Gold is still regarded as a safe haven. Gold also protects against currency devaluation. Gold remains up 15.1% on the year. The S&P 500 is down 13.7%. On the week, gold fell 1.4%, silver was walloped, down 13.0%, and platinum dropped 7.8%. Of the near precious metals, palladium fell 7.2% and copper dropped 14.7%, as many predicted with an impending recession copper demand would fall. The gold stocks fell too, with the Gold Bugs Index (HUI) down 9.3% and the TSX Gold Index (TGD) off 8.5%. Both remain up on the year, a far cry from the broader stock market.
Nonetheless, we can’t argue against a potential corrective period for gold that could at minimum take us into May. If we fall through $3,000, a drop to $2,900 can’t be ruled out. Longer-term support appears to be down to $2,700. A normal Fibonacci 38.2% correction of the move from that November 2024 low would take us to nearly $2,900.
Source: www.stockcharts.com
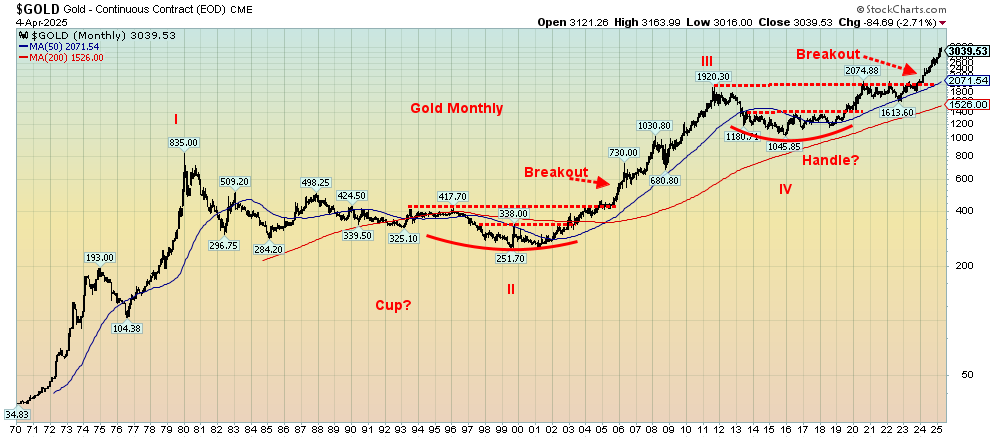
Our long-term chart of gold shows the breakouts that occurred in 2004–2005 from a huge base and as well the breakout from what appears as a possible cup and handle pattern. The pattern, which is not a classic cup and handle, projects up to at least $3,000, which we have already hit. Potential further targets are up to $3,700. We appear to be working on what may be a fifth wave to the upside that started back in the 1970s. So far, this wave appears to have completed two waves with the first ending at $2,075 in 2020 that started at $1,045 in 2015. The correction into 2022–2023 was wave 2. So this should be wave 3 up with wave 4 (corrective) and 5 to come. The question is, have we topped for wave 3? Any corrective wave must hold above $2,100 to be valid. On the other hand, this could just be a pullback within the context of wave 3 up. A minimum correction could take us back to around $2,600. That’s why the points at $3,000 and $2,900 are important. We prefer to hold above these points or the correction could be steeper. We should be in the upcycle of the current 7.8-year cycle that last bottomed in October 2022. A normal cycle correction would target 2025 for a low. Hence, watch the key points. Irrespective of this, a correction that takes us into May and even into July appears to be underway. But gold might respond to the unknowns that lie ahead.
Source: www.stockcharts.com
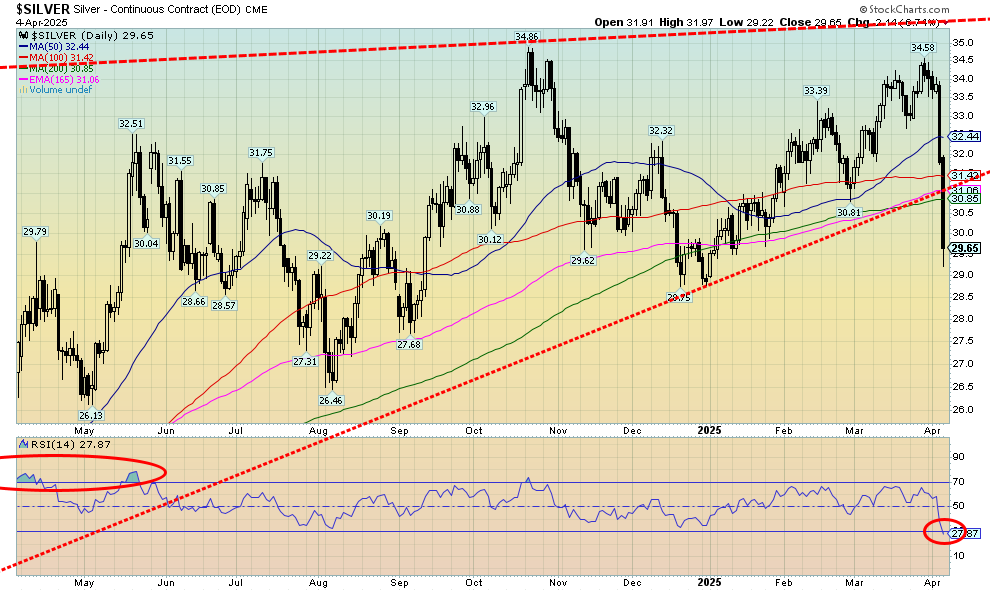
Ugly, thy name is silver. It seems rather perverse that silver could be so beat up, despite being in shortage. But alas, the paper market, which is estimated to be 200–300 times larger than the physical market, rules. Given its industrial use, the desire is to keep prices low. The paper silver market does its job. Short squeeze? More like a long panic. Silver plunged 13% this past week, one of its worst wipeouts ever. Maybe the clue was gold making new all-time highs but silver failing its October high. Tellingly, silver was hit harder during the 2008 financial crisis and the pandemic than was gold. Silver tends to lead to the upside and to the downside. This week it proved the downside in spades. We suppose it is good news that the RSI has plunged under 30, meaning we are now oversold. But that is merely a state and does not tell us we can’t fall even further. We have broken that uptrend line and only that December 2024 low near $28.75 stands in the way of even lower prices. Arguably, we could say we made a double top and targets could be down to around $25. Regaining $32 would be positive, but only new highs and a breakout over now $36 tell us this is over.
Source: www.stockcharts.com
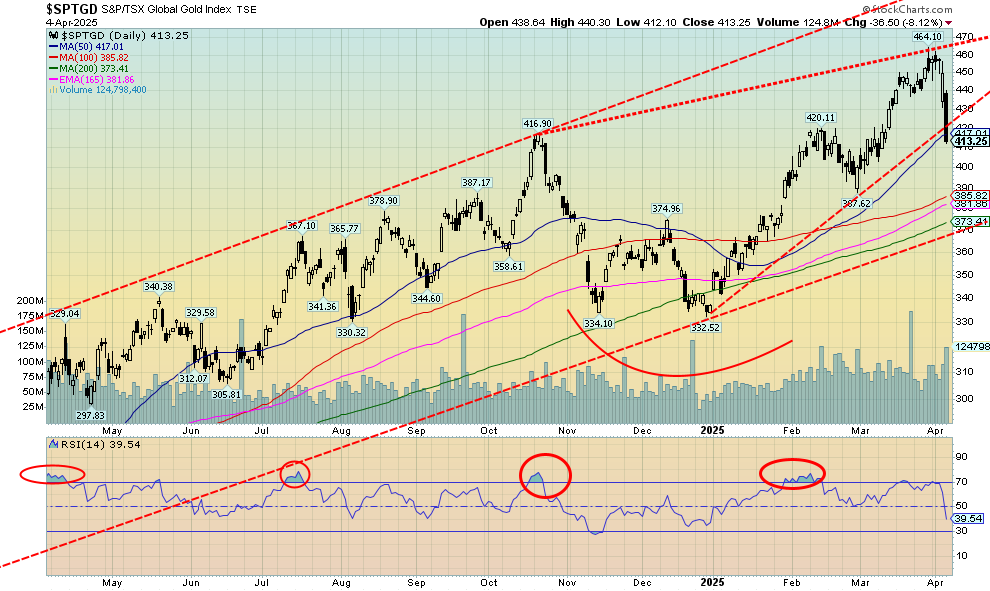
Ugly is the only word we can use to describe the fall in the gold stocks on Friday after Thursday’s less-than-expected drop. Still, the gold stock indices wiped out a chunk of their gains year to date with this past week’s fall. That’s the bad news. The good news is they are still positive for the year. The broader stock market can’t say that. This past week the TSX Gold Index (TGD) dropped 8.5% while the Gold Bugs Index (HUI) fell 9.3%. Both fell into the vicinity of the 50-day MA. But the TGD could be breaking down from an ascending wedge triangle with targets down to 288. Still, there are good support levels before getting to that low and that may be an extreme. A solid close under 400 could send us to 370–385 support. The record high of 464 was made on March 28. On April 1 it attempted to take that level out but failed. Then came the deluge with few prepared for what happened. The RSI tingled with overbought at 70, but we never became seriously overbought. With an RSI at 39 on Friday, we have room to move lower before becoming oversold. The action this week came unexpectedly but was predictable, given what happened elsewhere. During the 2008 financial crisis and the pandemic, gold stocks were hit hard, even worse than the broader stock market but recovered quickly once they found their bottom. It's a rather thin market so moves either way can be exaggerated. That was even as the rise from that December 2024 low to the high was orderly. The drop this week has all the earmarks of a shakedown and not the start of something bigger.
Source: www.stockcharts.com
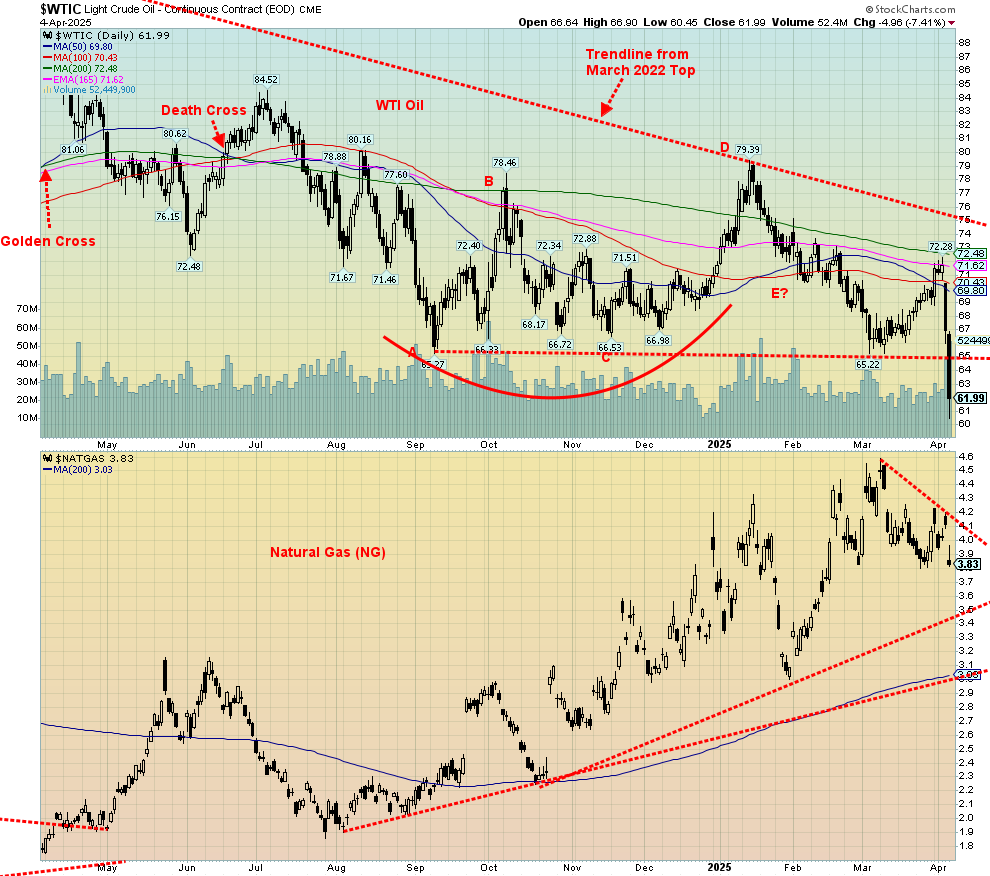
Just when you thought that oil was poised to break out higher, along came Trump’s tariffs. War with Iran? Fuhgeddaboudit, at least for the moment. The focus shifted to Trump’s tariffs, plus counter-tariffs being put on the U.S., particularly from China, and thoughts instead shifted to recession and waning demand for oil. The timing was lousy as well as OPEC+ decided it was time to speed up their unwinding of production cuts. Maybe that will be back on the table with this price plunge. It was a lousy week for oil markets.
WTI oil fell almost $7.40 this past week or 10.6%. Brent crude was down 9.9%. Both WTI and Brent made 52-week lows. Natural gas (NG) decided to keep pace as NG at the Henry Hub was down 6.4% while EU NG at the Dutch Hub fell 10.1%. The energy stocks revolted as the ARCA Oil & Gas Index (XOI) dropped 15.8% while the TSX Energy Index (TEN) was down 12.9%. Both indices made 52-week lows. An ugly week all around.
With this fall, WTI oil plunged through a long-held zone of support, suggesting that it could fall further with potential targets down to $48. For a number of oil-producing countries, particularly Canada whose heavy oil requires higher prices, it could prove devastating. Not so much for Saudi Arabia. Assuming we did fall to $48 we’d be approaching the 2008 financial crisis low near $40. The pandemic low in 2020 was even worse, dropping to $20 and even briefly going negative, even as it was short-lived.
NG fell because of the tariffs, suggesting a drop in demand even as U.S. storage levels remain below average. Trade war fears leading to a recession and a drop in demand also helped the EU NG fall.
It’s hard to say where we go from here. Right now, the best call is we are headed lower, possibly towards that $48 target. But then one never knows when an event (war) interrupts the fall. We need to regain $73 to suggest a low is in.
Copyright David Chapman 2025
GLOSSARY
Trends
Daily – Short-term trend (For swing traders)
Weekly – Intermediate-term trend (For long-term trend followers)
Monthly – Long-term secular trend (For long-term trend followers)
Up – The trend is up.
Down – The trend is down
Neutral – Indicators are mostly neutral. A trend change might be in the offing.
Weak – The trend is still up or down but it is weakening. It is also a sign that the trend might change.
Topping – Indicators are suggesting that while the trend remains up there are considerable signs that suggest that the market is topping.
Bottoming – Indicators are suggesting that while the trend is down there are considerable signs that suggest that the market is bottoming.
Disclaimer
David Chapman is not a registered advisory service and is not an exempt market dealer (EMD) nor a licensed financial advisor. He does not and cannot give individualised market advice. David Chapman has worked in the financial industry for over 40 years including large financial corporations, banks, and investment dealers. The information in this newsletter is intended only for informational and educational purposes. It should not be construed as an offer, a solicitation of an offer or sale of any security. Every effort is made to provide accurate and complete information. However, we cannot guarantee that there will be no errors. We make no claims, promises or guarantees about the accuracy, completeness, or adequacy of the contents of this commentary and expressly disclaim liability for errors and omissions in the contents of this commentary. David Chapman will always use his best efforts to ensure the accuracy and timeliness of all information. The reader assumes all risk when trading in securities and David Chapman advises consulting a licensed professional financial advisor or portfolio manager such as Enriched Investing Incorporated before proceeding with any trade or idea presented in this newsletter. David Chapman may own shares in companies mentioned in this newsletter. Before making an investment, prospective investors should review each security’s offering documents which summarize the objectives, fees, expenses and associated risks. David Chapman shares his ideas and opinions for informational and educational purposes only and expects the reader to perform due diligence before considering a position in any security. That includes consulting with your own licensed professional financial advisor such as Enriched Investing Incorporated. Performance is not guaranteed, values change frequently, and past performance may not be repeated.
About the author


Website: https://www.enrichedinvesting.com
Disclaimer: David Chapman is not a registered advisory service and is not an exempt market dealer (EMD) nor a licensed financial advisor. We do not and cannot give individualised market advice. David Chapman has worked in the financial industry for over 40 years including large financial corporations, banks, and investment dealers. The information in this newsletter is intended only for informational and educational purposes. It should not be considered a solicitation of an offer or sale of any security. The reader assumes all risk when trading in securities and David Chapman advises consulting a licensed professional financial advisor before proceeding with any trade or idea presented in this newsletter. David Chapman may own shares in companies mentioned in this newsletter. We share our ideas and opinions for informational and educational purposes only and expect the reader to perform due diligence before considering a position in any security. That includes consulting with your own licensed professional financial advisor.