
War is a constant. Not a year goes by without war somewhere. But global wars are rare. A number of analysts are noting that the current wars of Russia/Ukraine and Israel/Hamas along with the growing discourse between the U.S. and China have the potential to turn into a global war i.e. a world war. The past century saw two world wars plus Vietnam that while not a world war the main players were the U.S., with Russia and China behind the scenes. Today's conflicts involve the same players and once again they are behind the scenes.
We look at how markets performed during world wars along with the Vietnam War. While markets were volatile with sharp ups and downs they were not a generally good period to own stocks. But commodities soared during these periods largely sparked by the need for them, supply disruptions and scarcity.
Two big events this past week. The Fed stood pat on interest rates as was largely expected and the October job numbers came in below expectations. The job numbers are the subject of our chart of the week. With the weak job numbers many now expect to continue to stand pat. And that sparked a wild rally in stocks. Gold and gold stocks followed although gold is responding to the deteriorating global geopolitics and the Fed pause.
Not much in the way of numbers this coming week. Watch consumer credit and consumer confidence.
They say we live in interesting times. But the weather is crisp and fall walks are great. Have a great week and set the global troubles aside.
DC
“You pay a very high price in the stock market for a cheery consensus.”
—Warren Buffett, American business magnate, investor, philanthropist, chairman and CEO Berkshire Hathaway, one of richest men in the world; b. 1930
“Anyone taken as an individual is tolerably sensible and reasonable—as a member of a crowd, he at once becomes a blockhead.”
—Friedrich Schiller, German poet, playwright, historian, philosopher, physician; 1759–1805
“I find more and more that it is well to be on the right side of the minority since it is always the more intelligent.”
—Johann Von Goethe, German poet, playwright, novelist, scientist, statesman, theatre director and critic, many works including Metamorphosis of Plants (1790), contemporary of Friedrich Schiller; 1749–1832
War is a constant for the human race. Hardly a day goes by that there isn’t a war someplace. There may be some discussion about the details, but by most accounts there has never been a year without war. However, all-encompassing wars are rare. Since the late 18th–early 19th century, we can note four wars we would consider global in nature; i.e., world wars.
The first two may be a surprise to many, but both were global in nature, fought on more than one continent, and involving numerous players. The first world war we note is what was known as the Seven Years’ War in 1757–1763, although in looking at it, it was really a nine-year war from 1754–1763. This was a war that involved all the European powers except for the Ottoman Empire. It was fought on five continents, including Europe, the Americas, West Africa, and in Asia, India, and the Philippines. In North America it was known as the French and Indian wars, which led to collapse of the French Empire in the Americas. There were also wars in South America that interconnected, involving great powers. After the war ended, revolutions took place in the Americas—the American Revolution and, in France, the French Revolution.
The second world war was the Napoleonic Wars of 1800-1815, which also included the War of 1812–1814. Again, these wars were fought on more than one continent and this time the Ottoman Empire was involved, along with primarily the great European powers and the U.S.A. After a long period of numerous wars but no global war, we had the two world wars of the 20th century, World War I and World War II. One hundred years went by between the end of the Napoleonic wars and World War I. To date, 78 years have gone by since the end of World War II, although since then we’ve had numerous smaller wars almost continually, along with the Cold War. Two of the largest wars during this period were the Korean War (1950–1953) and the Vietnam War (1955–1975).
The Economist is noted as a conservative weekly magazine focusing on current affairs, international business, politics, technology, and culture. It’s been around since 1843 and enjoys a global reputation. Yet, they have no qualms about stating and providing a front cover highlighting “The Next War: The growing threat of great-power conflict.” Was this headline recent? No, that was the headline back in January 2018. It was that long ago that the U.S. put China and Russia as the main threat to American power. Since then, nothing has changed as the world seems to move towards another potential global conflict. The war between Russia/Ukraine, Israel/Hamas, and before that the U.S.’s war on terror, which included invasions of Afghanistan, Iraq, and Libya are merely a preamble, just as Japan’s invasion of Manchuria, Italy’s invasion of Abyssinia, the Spanish Civil War, and Germany’s takeover of the Rhineland and Sudetenland were percussors to World War II. Against the backdrop of the Great Depression, we also witnessed the rise of fascism.
Another common theme we see is, before World War II, the League of Nations that grew out of the ashes of World War I fell apart. The U.S. never joined, instead going into isolationism during the 1920s. Lately we are witnessing the powerlessness and disintegration of the United Nations as the Russia/Ukraine and Israel/Hamas wars rage. The UN can do nothing as it is paralyzed by the power struggle between the U.S. and the West vs. China/Russia.
The Economist is not the only place where we have noted articles concerned about the potential for another global conflict. We have also seen similar stories appear in such magazines as Foreign Affairs and Foreign Policy. CEOs of major corporations, led by Jamie Dimon of JP Morgan Chase, have expressed concern about the divisive global geopolitics and the potential for global war. While the current conflicts are between Russia/Ukraine and Israel/Hamas, other players are intertwined and the web of players is growing on both sides. The U.S. in particular is deeply entrenched in both wars, even though they are not officially a combatant. As the number of players grows, it spreads the risk of global war.
But wait! Aren’t we supposed to talk about investments and markets, not war? No, markets don’t go away just because there is war. Most wars have negligible effects on markets. But big global wars do. We are already in a secular bear market. How do we know that? The top in the markets was nearly two years ago, January 2022. Since then, we have had the Russian invasion of Ukraine in February 2022 and the outbreak of hostilities between Israel/Hamas in October 2023. We’ve also had the highest inflation since the 1970s, the worst bond market since the 1970s, and one of the largest percentage hikes in interest rates.
Rising interest rates threaten $300 trillion plus of global debt. Interest on the U.S. federal debt has climbed to almost $1 trillion, exceeding even U.S. defense expenditures. Evidence suggests that the world is slowly sliding into a recession. The risk of a major default is rising, both corporate and sovereign. Germany is in a recession, albeit a mild one, while other eurozone countries are experiencing very slow growth, if at all. The U.K. is verging on a recession, Japan is constantly experiencing slow growth, and China is pressured by the collapse of its real estate market and is also experiencing low un-China-like growth. Sanctions and trade wars leveled primarily by the U.S. against a host of countries are not helping as global trade slows and globalization retracts. Finally, Canada is slowing but not an official recession, while the U.S. is showing signs of slowing but remains the strongest of the G7. That’s not saying much.
Our focus is on what the markets did during World War I, World War II, and, for added measure, Vietnam. None of it was positive. Secular bear markets appeared to dominate through it all. However, even secular bear markets can have periods of bull markets.
Dow Jones Industrials (DJI) 1912–1922
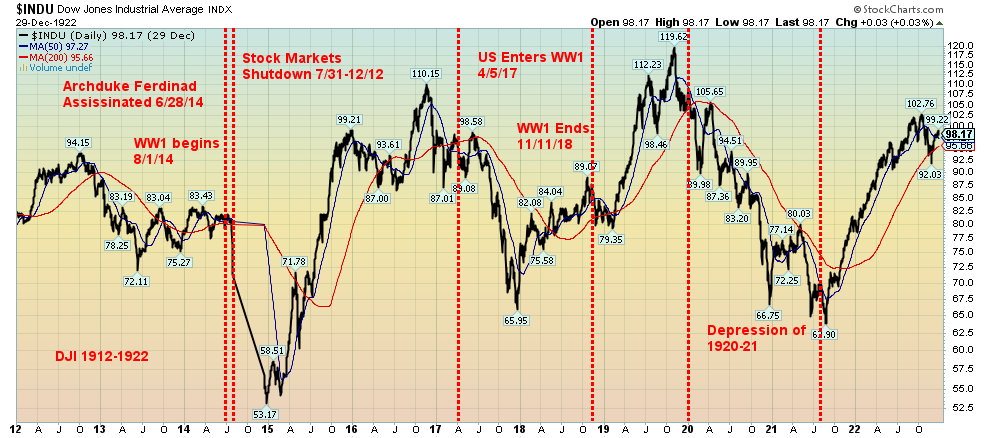
Source: www.stockcharts.co
The period of World War I is listed as starting on July 28, 1914 and ending on November 11, 1918. During that period, the Dow Jones Industrials (DJI) gained 12%. However, the Treaty of Versailles to end the war didn’t get signed until June 28, 1919 and did not take effect until January 10, 1920. The NYSE shut down for roughly four months in 1914 after a few days of selling following the outbreak of hostilities. The exchange closed on July 30, 1914 and did not reopen until December 12, 1914. By the time the dust cleared, the DJI had fallen 30%.
World War I was followed by what was known as the Spanish flu, one of the deadliest pandemics in history. Globally, an estimated 40 to 50 million died, more than the death toll of World War I. The U.S. and the world fell into a depression during 1920–1921 as returning troops were largely jobless, along with the collapse of the economies of Europe plus the negative impact of the Spanish flu. It was a short but nasty depression.
The DJI fell 47% from 1919–1921. All told, from the outbreak of war in 1914 to the bottom of the 1920–1921 depression, the DJI lost about 18%. Two significant rallies took place. The bull market of 1915–1916 remains as one the best bull markets ever as the DJI rose 110%, driven by the U.S. staying out of the war but with manufacturing to supply the combatants rising sharply. Once the U.S. entered the war in 1917 the DJI fell over 40%. Signs that the Allies would win the war, along with the end of the war in November 1918 and the period of the signing of the Treaty of Versailles, contributed to a strong bull market and the DJI rose 81% in 1918–1919. The high of 1919 wasn’t surpassed until 1925 as the Roaring Twenties got underway.
While there were a couple of significant rallies through the period, overall, it was a depressive period for the stock market that didn’t end until the 1920s got underway.
Dow Jones Industrials (DJI) 1938–1946 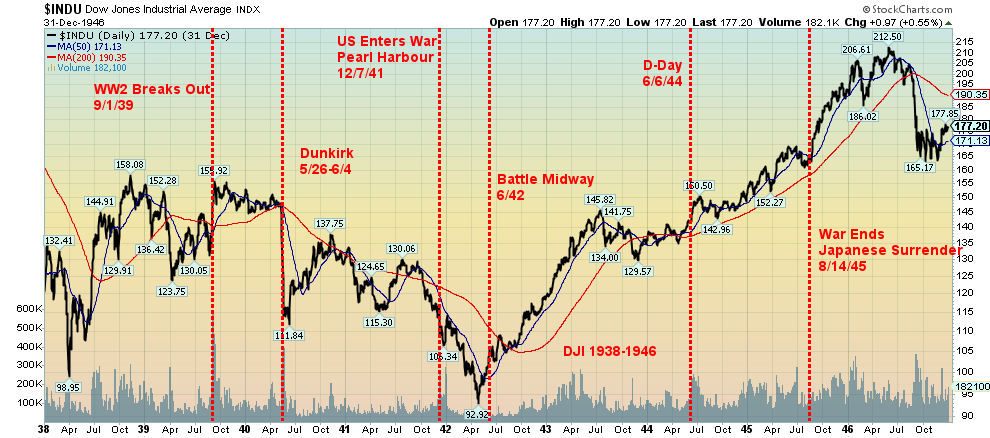
Source: www.stockcharts.co
World War II broke out following the Great Depression of the 1930s. As we noted, the lead-up to World War II witnessed a number of other wars that ultimately all played a role in leading to World War II. Officially, the war lasted from September 1, 1939 when Nazi Germany invaded Poland to September 2, 1945 when Japan officially surrendered. During this period, the DJI actually gained about 28%. However, the early part of the war saw markets fall globally. From a peak in early September 1939 to its bottom in April 1942, the DJI lost over 40%. The Battle of Dunkirk in May/June 1940 was a turning point for the war and the markets. Markets reacted negatively to the Allies’ loss by falling over 22% in a matter of days. Markets continued their downward drift into 1941. The U.S.’s entry into the war following Pearl Harbour on December 7, 1941 did nothing for the markets as they fell further. The bottom didn’t come until April 1942. By that time the DJI had fallen over 40% from a 1939 top.
Things began to change with the U.S.’s victory in the Battle of Midway in June 1942. Sensing the Allies could win and, coupled with the sharp rise in manufacturing for the war, stock markets started a rally that didn’t peak until May 1946. The DJI gained almost 129% from April 1942 to May 1946. The sharp post-war recession of 1946 shaved some 23% off of the DJI into 1947. As was the case after World War I, returning troops were jobless. But the recession was short-lived and, following another interruption in 1949, a long period of stability and growth got underway in the 1950s.
The period of World War II can be characterized as two-pronged. The weak first half was triggered by the war itself, but when the odds shifted in the favour of the Allies and war manufacturing soared, the stock markets soared as well. D-Day on June 6, 1944 was another turning point for the markets as the realization that the invasion could be successful sparked the rally that carried into 1946.
The period of the Great Depression and war didn’t end until the stock market bottom in June 1949. At that point the DJI was some 290% above the 1932 Great Depression low. However, it wasn’t until 1954, a period of 25 years, that finally saw the DJI take out the high of the 1929 on a nominal basis. On an inflation-adjusted basis, the 1929 high wasn’t exceeded until June 1959.
Dow Jones Industrials (DJI) 1963–1975
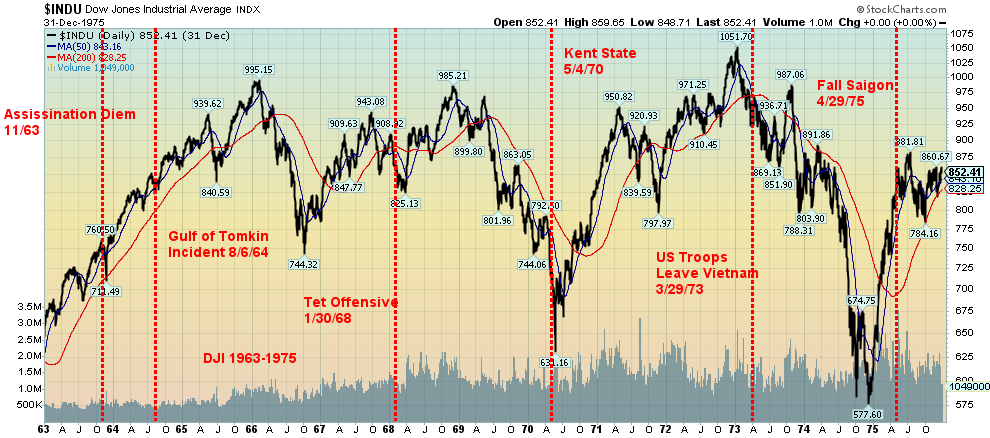
Source: www.stockcharts.co
While the Vietnam War was not a global war, numerous other players were involved, even if not directly. The main war was between South Vietnam along with the U.S. and North Vietnam. North Vietnam was strongly backed by both Russia (Soviet Union) and China at the time. However, others were also involved including France, Laos, Cambodia, and South Korea. Also supplying troops were Australia, New Zealand, Philippines, Taiwan, and Spain, although their contributions were small compared to the main combatants. North Korea and Cuba also provided some support to North Vietnam. Despite the number of players, the battle was confined to what had previously been known as French Indochina (Vietnam, Cambodia, and Laos). Still, the war was significant and the U.S. suffered more deaths during Vietnam than they did during the Korean War of 1950–1953. The war also triggered deep divides in the U.S. and anti-war protests dominated the period, particularly during the late 1960s and into the early 1970s.
The Vietnam War was a major conflict of the Cold War. It was a major proxy war between the Cold War combatants U.S./Soviet Union/China, except the U.S. was directly involved. Officially, the war lasted from 1955 to 1975. The U.S. began sending military advisors for South Vietnam in 1959, but the U.S. really didn’t up the troop levels until 1963 after the assassination of former South Vietnamese president Ngo Dinh Diem, engineered by South Vietnam generals backed by the U.S. CIA. For our purposes, we consider the period from the assassination of Diem to the Fall of Saigon in April 1975 to be the main period of the Vietnam War and U.S. involvement.
During that period the DJI gained a small 6.5%, but it was a roller coaster ride. Markets peaked in February 1966, ending the secular bull market of 1949–1966. Inflation as a result of the Vietnam War, the war itself, protests on the street, Watergate, and eventually the outbreak of hostilities in the Middle East between Israel and Arab countries that led to the Arab oil embargo of 1973 all played a role in the negative markets of the period.
After the peak in February 1966, the markets fell some 25% into October 1966. A rebound rally took place from October 1966 to December 1968 as the DJI gained 32%. The collapse of 1968–1970 then got underway as the Vietnam War intensified and the protests grew larger. The DJI fell 36% into May 1970. The bottom coincided with the Kent State affair that saw four Kent State students killed by U.S. National Guards during Vietnam War protests. The affair sent shock waves through the Nixon administration and efforts were then underway to end the war. The subsequent rally took the DJI up 67% to the Nifty Fifty peak in January 1973. There was an interruption with a 16% correction in 1971.
The markets broke in October 1973 with the outbreak of the Yom Kippur War in the Middle East, the Watergate Saturday Night Massacre, and the Arab oil embargo. When the dust cleared, the DJI fell 45% from the top in January 1973 to the bottom in December 1974. Other indices fell even more. Another rally got underway into 1976, but the inflationary/war/Watergate scandals/oil embargo/war protests period didn’t officially end until August 1982. This was following a steep recession triggered by the Fed hiking interest rates to 20% to bring down inflation that had been mainly the result of the Vietnam War.
The DJI fell 22% from the peak in 1966 to the final bottom in August 1982 with numerous ups and downs in between. On an inflation-adjusted basis, the decline was 62% as the low on an inflation-adjusted basis put the DJI back to where it was in 1949. The stock market high during the period wasn’t fully taken out until later in 1982 and, on an inflation-adjusted basis, the 1966 high was not exceeded until 1995
Conclusions
Global wars and Vietnam were not friendly to stock markets. Overall, all three conflicts saw steep declines in the stock market, even if the World War II example did see markets recover and end up better. Recessions were a characteristic, either during the conflict, as was the case with Vietnam, or in the post-war collapse. The conclusion here is that stocks are not the best bet during global conflict. However, defense stocks may do well.
One area that does perform during periods of war is commodities. Commodity prices rose during World War I but peaked by 1920. The rise was not as dramatic during World War II, but commodity prices were on an upward trajectory during the period and didn’t peak until 1951. The period of the Vietnam War and inflation during the 1970s saw commodity prices and gold and oil soar. Gold was fixed during World War I and, while it was revalued upwards in 1934, gold was also fixed during World War II. However, the dislocations caused by the Vietnam War, along with the inflationary 1970s and the end of the gold standard in August 1971, saw gold soar from $35/ounce in 1971 to a peak of $875/ounce in January 1980, a gain of some 2,400%. Oil prices soared from $3 to $40 because of the Arab oil embargo 1973 and the Iranian hostage crisis 1979.
Gold, as represented by Homestake Mining, also saw HM soar during the 1930s. Our chart below shows how Homestake Mining, along with Dome Mines outperformed the DJI during the Great Depression. The chart has been adjusted to show relative gains during the period. Gold was revalued higher in 1934. HM and DM were both weak and low until 1932, then began a rise that far outpaced the performance of the DJI.
Our long-term chart of commodity prices shows how they tend to rise during periods of war but generally collapse during periods of steep recessions or depressions. We call these commodity super-cycles.
Long-Term Chart Commodity Prices 1770–2013
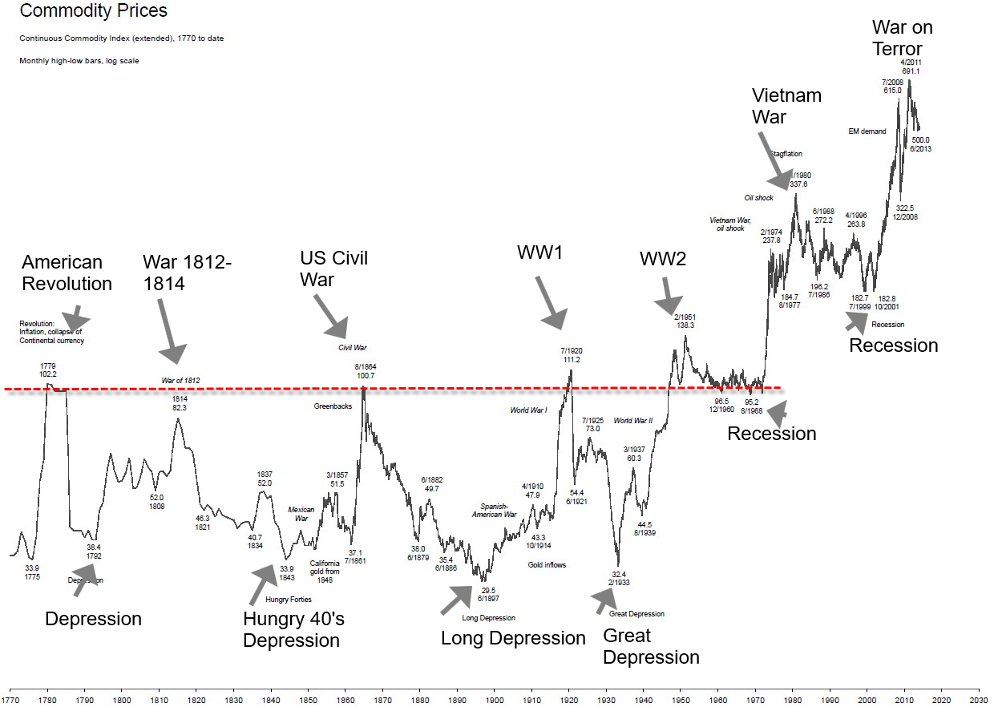
Source: www.goldchartrus.com
We complete the picture with a chart of the CRB (Commodity Research Bureau) Index from 2004. Note how, after peaking in 2011, commodity prices went into a long slump, bottoming with the pandemic recession in 2020. Since then, supply disruptions, a major shortage of commodities to drive the economy, coupled with wars, have started what might be a new commodity super-cycle to the upside. This could intensify, particularly if the wars were to expand.
Our conclusion: wars are bad for stocks but very good for commodities. Many analysts have noted as an example that if Iran were to come into the Middle East war, oil prices could rise to $150 or higher. Others note that gold prices could rise to $2,500 or higher. Other commodities would follow accordingly. See our chart of the CRB Index from 2004.
CRB Index 2004–2023
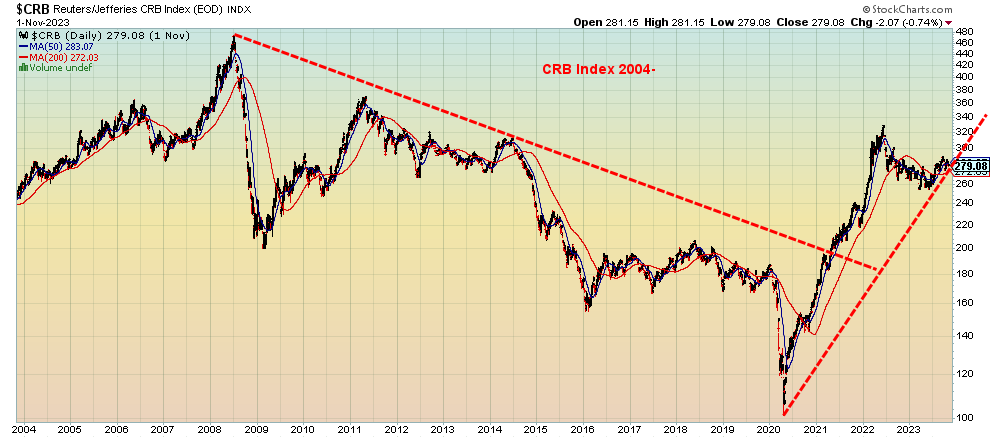
Source: www.stockcharts.co
Chart of the Week
US Job Numbers
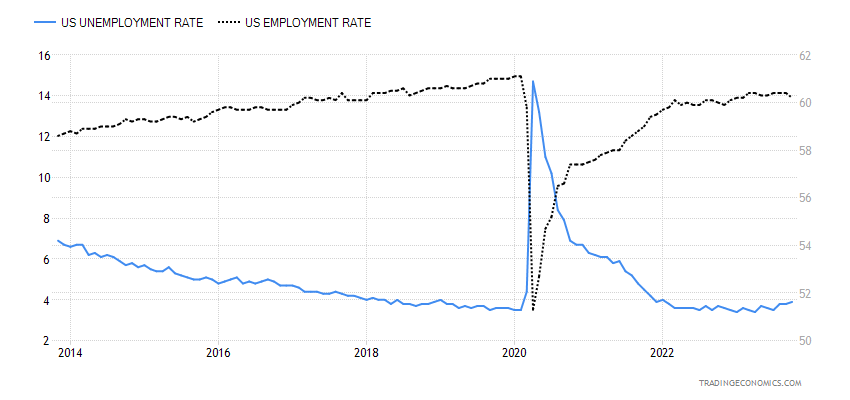
Source: www.tradingeconomics.com, www.bls.gov
Well, surprise, surprise! We could say, not unexpected, or it’s about time, or even how could that be as the economy is so strong. Nonfarm payroll came in below expectations at 150,000 for October. The market had expected at least 170,000 and some up to 190,000. The unemployment rate (U3) ticked up to 3.9% from 3.8% while the U6 unemployment rate (U3 plus total employed part-time for economic reasons, all persons marginally attached the labour force) was 7.2% up from 7.0%. While the unemployment rate ticked up, the employment population ratio slipped from 60.4% to 60.2%. That means fewer people as a percentage of the labour force are actually working. In February 2020, before the pandemic, the employment population ratio was 61.1%. It has been a steady decline since. Unemployment rate rising, employment population ratio falling. The labour force participation rate also fell to 62.7% from 62.8%.
Not a surprise as the employment level fell by 348,000 in October even as the civilian labour force also fell by 201,000 and those listed as not in labour force rose by 158,000. All this against the backdrop of the total pool of working age or civilian population level rising by 56,000. The total number listed as unemployed (U3) rose by 146,000 in October. The drop in the labour force led to the hike in the unemployment rate both U3 and U6. Note: we do not appear to be receiving any longer Shadow Stats. Unsure what the real problem is.
No surprise, either, that the nonfarm payroll number for September was revised down to 297,000. It is noteworthy that nonfarm has been revised downward every month in 2023. The good news, we suppose, is that at 150,000 it remains above the 75,000 to 100,000 jobs needed every month just to keep up with labour force population growth.
Playing havoc with the numbers this past month were the strikes that weighed against manufacturing jobs. A drop there was offset by gains in health care, government, construction, and social assistance. The gain of 150,000 was below the average gain of 258,000 jobs over the past year.
The lower than expected nonfarm, rise in the U3 unemployment rate, fall in the labour force, lower employment population ratio, plus other indicators have many calling for the Fed to cut rates by next June. U.S. bond yields fell on the news and that in turn lowered the inverted yield curve, suggesting that the long-awaited recession could soon be upon us. The lower number also reduced speculation that the Fed would hike rates in either the December or January FOMC. All this is leading us to speculate that the Fed is finished hiking and now we await cuts. That said, don’t expect too much on rate cuts as our belief is that the Fed doesn’t want to get back to the trap of previous downturns when the financial system was flooded with liquidity (QE) and interest rates lowered to zero (ZIRP).
Besides a rise in the unemployment rate, a fall in the employment population ratio, and a drop in the labour force participation rate, we note that average work declined to 34.3 hours from 34.4 hours. Average hourly earnings also were lower, up 0.2% vs the expected up 0.3% and last month’s gain of 0.3%. Year over year (y-o-y), average hourly earnings rose 4.1% vs. expected 4.2% and last month’s 4.3%. On the good news front, the median weeks unemployed fell to 8.9 weeks from 9.2 weeks.
Canada Job Numbers
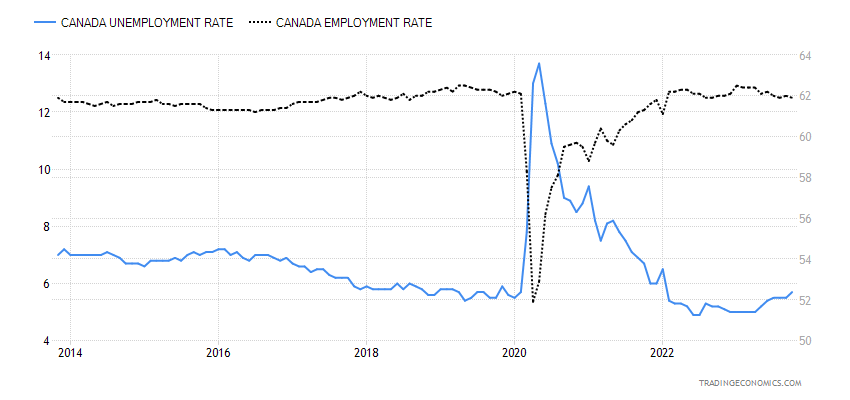
Source: www.tradingeconomics.com, www.statcan.gc.ca
Canada’s job numbers for October disappointed as they reported only a gain of 17,500 jobs vs. the expected 25,000. But disappointed seems misplaced since September’s gain of 63,800 blew everyone away as being well over expectations. Maybe all this is not a surprise as Canada’s monthly job numbers seem to be very volatile. It was the third successive month for job gains. The unemployment rate ticked up to 5.7% from 5.5%. They had expected a rise to 5.6%. The R8 unemployment rate, the highest reported by Statistics Canada that adds discouraged searchers and the waiting group portion of involuntary part-timers, was steady at 6.9%. That’s down from 8.2% in August.
The labour force participation rate for October was steady at 65.6%, but the employment ratio fell to 61.9% from 62.0%. Full-time employment fell 3,300 but part-time employment rose by 20,800. Part-time up, full-time down. Low wage, no benefit jobs replace higher wage, benefit jobs. They are also the first jobs to disappear in a downturn. Wage gains were steady, up 4.2% y-o-y.
The loonie rose as a result, despite the job gains being lower than expected. Bond yields fell, along with the drop in bond yields in the U.S. That narrows the curve, putting us closer to a recession. It has been noted that Canada has fallen into a technical recession, even as we are not really sure what that means. Either we are in one or not. But the softer numbers should keep the BofC on the sidelines, at least into 2024.
Canada has been averaging 28,000 jobs per month in 2023. But the population of 15 years and older is up 81,000 per month. Construction, information technology, and health care led the gains while real estate, manufacturing (strikes?), and retail trade saw losses.
Markets & Trends
|
|
|
|
% Gains (Losses) Trends |
|
||||
|
|
Close Dec 31/22 |
Close Nov 3, 2023 |
Week |
YTD |
Daily (Short Term) |
Weekly (Intermediate) |
Monthly (Long Term) |
|
|
Stock Market Indices |
|
|
|
|
|
|
|
|
|
S&P 500 |
3,839.50 |
4,358.33 |
5.9% |
13.5% |
up (weak) |
neutral |
up (weak) |
|
|
Dow Jones Industrials |
33,147.25 |
34,061.32 |
5.1% |
2.8% |
up (weak |
neutral |
neutral |
|
|
Dow Jones Transport |
13,391.91 |
14,512.76 |
7.1% |
8.4% |
down (weak) |
down |
neutral |
|
|
NASDAQ |
10,466.48 |
13,478.28 |
6.6% |
28.8% |
up (weak) |
up (weak) |
neutral |
|
|
S&P/TSX Composite |
19,384.92 |
19,824.85 |
5.8% |
2.3% |
up (weak) |
down |
neutral |
|
|
S&P/TSX Venture (CDNX) |
570.27 |
525.25 |
0.9% |
(7.9)% |
down |
down |
down |
|
|
S&P 600 (small) |
1,157.53 |
1,148.40 |
7.5% |
(0.8)% |
up (weak) |
down |
down |
|
|
MSCI World |
1,977.74 |
2,023.39 |
3.3% |
2.3% |
neutral |
down |
down |
|
|
Bitcoin |
16,531.31 |
34,657.39 |
2.4% |
109.7% |
up |
up |
neutral |
|
|
|
|
|
|
|
|
|
|
|
|
Gold Mining Stock Indices |
|
|
|
|
|
|
|
|
|
Gold Bugs Index (HUI) |
229.75 |
227.56 |
0.8% |
(1.0)% |
up |
down |
down |
|
|
TSX Gold Index (TGD) |
277.68 |
277.47 |
(1.1)% |
(0.1)% |
up |
down (weak) |
down |
|
|
|
|
|
|
|
|
|
|
|
|
% |
|
|
|
|
|
|
|
|
|
U.S. 10-Year Treasury Bond yield |
3.88% |
4.57% |
(5.4)% |
17.8% |
|
|
|
|
|
Cdn. 10-Year Bond CGB yield |
3.29% |
3.74% |
(6.0)% |
13.7% |
|
|
|
|
|
Recession Watch Spreads |
|
|
|
|
|
|
|
|
|
U.S. 2-year 10-year Treasury spread |
(0.55)% |
(0.27)% |
(58.8)% |
(50.9)% |
|
|
|
|
|
Cdn 2-year 10-year CGB spread |
(0.76)% |
(0.65)% |
(6.6)% |
(14.5)% |
|
|
|
|
|
|
|
|
|
|
|
|
|
|
|
Currencies |
|
|
|
|
|
|
|
|
|
US$ Index |
103.27 |
105.03 |
(1.5)% |
1.7% |
down (weak) |
up |
up |
|
|
Canadian $ |
73.92 |
73.25 |
1.6% |
(0.9)% |
down (weak) |
down |
down |
|
|
Euro |
107.04 |
107.29 |
1.5% |
0.2% |
up |
down |
down |
|
|
Swiss Franc |
108.15 |
111.26 |
0.3% |
2.9% |
up (weak) |
neutral |
up |
|
|
British Pound |
120.96 |
123.77 |
2.1% |
2.3% |
up |
down |
neutral |
|
|
Japanese Yen |
76.27 |
66.91 (new lows) |
0.1% |
(12.3)% |
down (weak) |
down |
down |
|
|
|
|
|
|
|
|
|
|
|
|
|
|
|
|
|
|
|
|
|
|
Precious Metals |
|
|
|
|
|
|
|
|
|
Gold |
1,826.20 |
1,999.20 |
flat |
9.5% |
up |
up |
up |
|
|
Silver |
24.04 |
23.28 |
1.7% |
(3.2)% |
up (weak) |
neutral |
neutral |
|
|
Platinum |
1,082.90 |
944.30 |
4.3% |
(12.8)% |
up |
down (weak) |
down |
|
|
|
|
|
|
|
|
|
|
|
|
Base Metals |
|
|
|
|
|
|
|
|
|
Palladium |
1,798.00 |
1,128.30 |
(0.2)% |
(37.3)% |
down |
down |
down |
|
|
Copper |
3.81 |
3.68 |
0.8% |
(3.4)% |
neutral |
down |
neutral |
|
|
|
|
|
|
|
|
|
|
|
|
Energy |
|
|
|
|
|
|
|
|
|
WTI Oil |
80.26 |
80.51 |
(5.9)% |
0.3% |
down |
up (weak) |
up |
|
|
Nat Gas |
4.48 |
3.52 |
1.2% |
(21.4)% |
up |
up |
down (weak) |
|
Source: www.stockcharts.com
Note: For an explanation of the trends, see the glossary at the end of this article.
New highs/lows refer to new 52-week highs/lows and, in some cases, all-time highs.
Source: www.stockcharts.com
Is a new bull underway? One would get that feeling, given the strong performance of the stock markets this past week. But the first thing we say is “where’s the beef”, as volume was not overly impressive. This then could just be another hook. The S&P 500 (SPX) gained a good 5.9% this past week, the Dow Jones Industrials (DJI) was up 5.1%, the Dow Jones Transportations (DJT) gained 7.1%, and the NASDAQ leaped 6.6%. Even the Mids and Smalls went up as the S&P 400 (Mid) gained 6.5% and the S&P 600 (Small) was up 7.5%.
In Canada, the TSX Composite gained 5.8% while the TSX Venture Exchange (CDNX) was up 0.9%, thanks to a strong Friday. In the EU, the London FTSE gained 1.7%, the EuroNext was up 3.8%, the Paris CAC 40 was up 3.7%, and the German DAX gained 3.4%. In Asia, China’s Shanghai Index (SSEC) gained a small 0.4%, the Tokyo Nikkei Dow (TKN) was up 4.4%, and Hong Kong’s Hang Seng (HSI) was up 1.5%. The MSCI World Index gained 3.3%. All in all, a good week for stocks.
Driving markets was the central banks standing still. The Fed left rates unchanged as was expected and the BOE followed suit. The employment numbers also helped, despite the fact that nonfarm payrolls were lower than expected at 150,000 and the unemployment rate was higher than expected at 3.9%. It all fueled thoughts that the Fed is done with hiking rates. And that is bullish for markets. We are also entering what is known as the best six months from November to May. Or the period of buy when it snows, sell when it goes. Will the joy continue?
But wait! The markets seem to be ignoring a few realities. Interest rates are still going to stay higher for longer. And with the jobs report the economy is weakening. In two weeks’ time we could have a government shutdown. Wars are raging and are threatening to spread. The market appears to ignoring risks and are now bidding up stocks that are already overvalued. Not a good sign.
This is all despite growing signs of rising bankruptcies, China slowing as its real estate market unravels, home owners facing increased mortgage costs, thus potentially fueling defaults (which is especially true in Canada), the commercial real estate markets remaining on edge, and consumers possibly facing a bleak Christmas as the economy slows. We’ll really see that with the annual Black Friday at Thanksgiving later this month. Also, if the wars expand, that would not be good for markets. CEOs are becoming very concerned about the potential negative impact of an expanding Middle East war.
Technically, we’ve gone up almost too fast. The result is, this feels more like a correction to suck everyone back in than the start of a new bull. We really have no significant divergences at the low. That’s something that normally shows up at significant lows. Also, volume wasn’t exactly huge on this rise. The VIX Volatility Indicator is, however, threatening to make new lows even as the SPX remains a way from its July highs. That could be a negative divergence. As we note later, we are also watching the DJI and DJT as they have the potential to diverge as well. We risk a false breakout as well if the SPX were to break above 4,400 resistance, then turn down again.
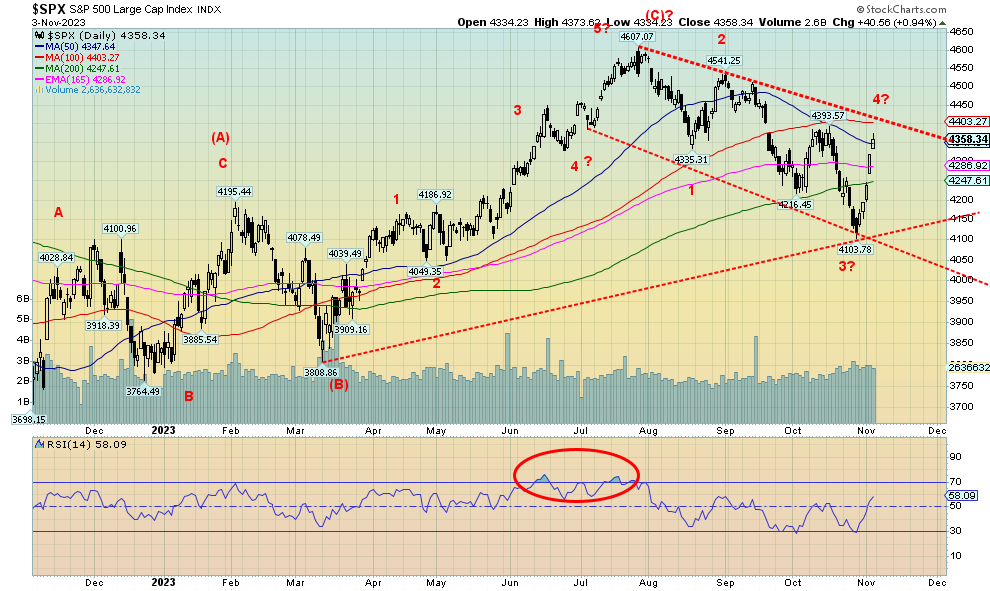
We appear to have made five waves down from the July high at 4,607 to the October low at 4,104. A drop of about 11% goes into correction territory. If correct, then that was just the first wave down of a possible five-wave decline. This is the start of the second or B wave up. Not even new highs above 4,607 would seal the deal as it could well be a false breakout that we noted in our opening piece in the October 30, 2023 Scoop. Obviously, a crash was averted. But we do remember that 1973–1974 bear market; it definitely had its hooks that made everyone think the bear was over.
Resistance is up to 4,400. Above 4,500 new highs are possible. It’s been a fast up move. Usually not sustainable. Support is down to 4,250. But if this plays out right, this is just the A wave of a potential ABC correction.
Conference Board Index of Leading Economic Indicators 2000-2023
Source: www.conference-board.org, www.bea.gov
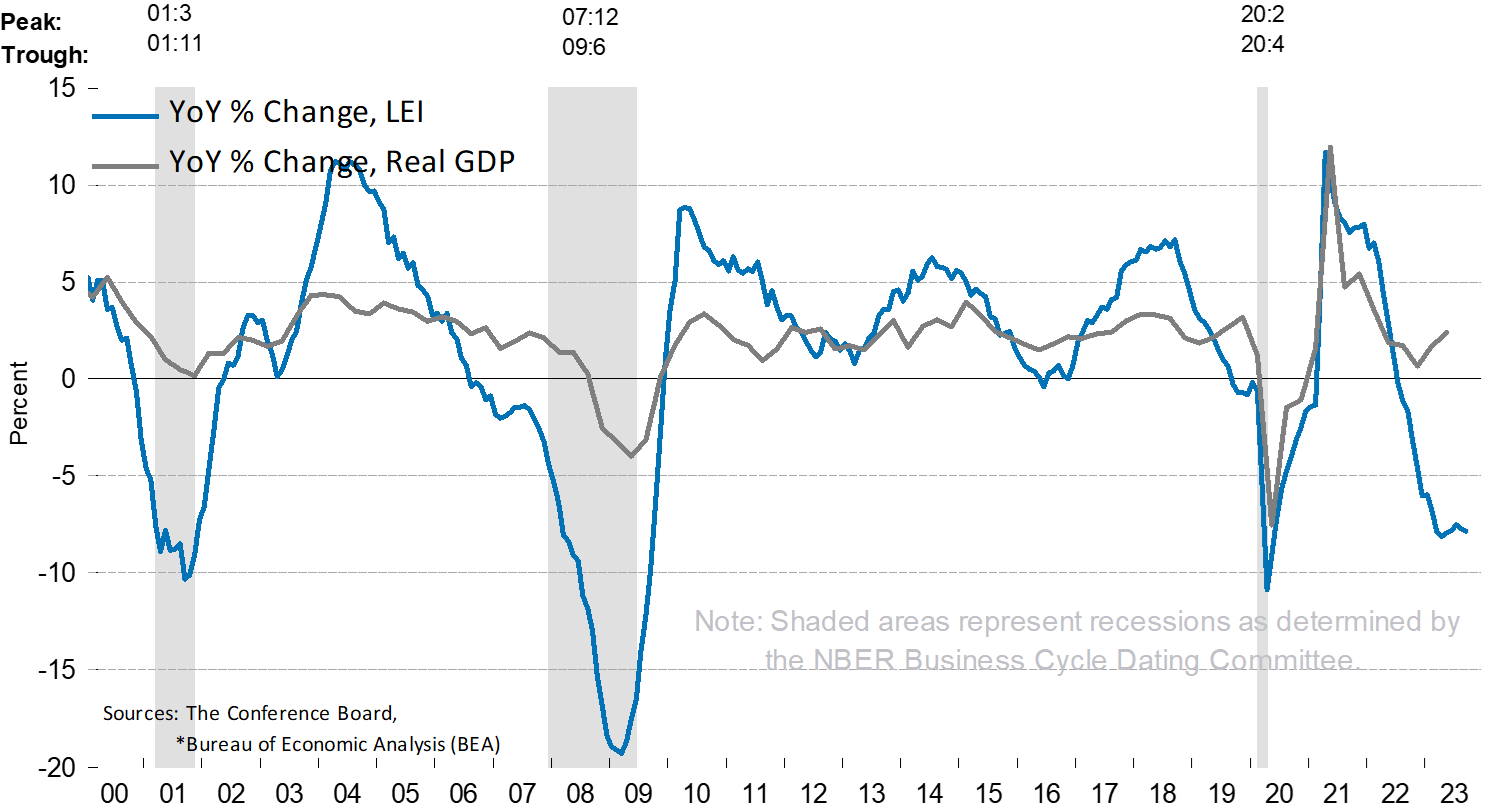
The Conference Board’s Index of Leading Economic Indicators has been falling steadily (with small upward blips) since peaking in 2021. This is not a good sign. Note how the LEI started falling with a peak in 204 and then it didn’t bottom until the Great Recession of 2007-2009. Already the LEI is below where it was when the U.S. economy fell into a recession in 2007. And we are not even in one – yet. The LEI has been negative since 2022. Not a good sign.
Source: www.stockcharts.com
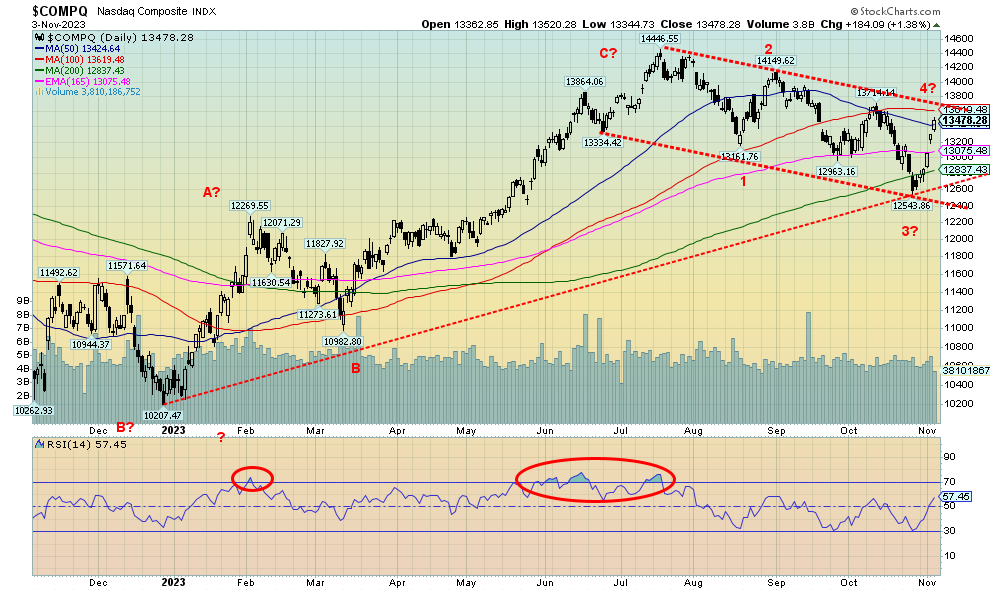
The NASDAQ jumped this past week along with everyone else, gaining 6.6%. The key component of the NY FANG Index was up 6.8%, suggesting that the NASDAQ’s gains were fueled by the rebound of the FAANGs. That is possibly the case. The FAANGs were led by Nvdia jumping 11.1% and Advanced Micro Devises leaping 16.4%. Indeed, all of the FAANGs we follow were up on the week. Meta (Facebook) gained 6.0%, Apple 5.0%, Amazon 8.5%, Netflix 8.7%, Google 5.7%, Microsoft 7.0%, and Tesla 6.1%. If there were any laggards, it was the Chinese stocks as Baidu gained 2.4% and Alibaba was up 3.0%. Snowflake was another laggard, up 4.6%. Okay, a laggard compared to the others.
The NASDAQ rebounded at the uptrend line, up from the December 2022 low and just under 200-day MA. But it is quickly approaching the downtrend line from the recent July top at 14,446. A move over 13,600 could suggest higher prices ahead. A move above 14,075 could suggest new highs ahead. But first we must break over 13,600. As with the S&P 500, we say “where’s the beef”, as volume lagged following the lower than expected nonfarm payrolls. Support now is down to 13,075, then down to 12,600. Only new lows below 12,540 would suggest that we are entering a bear market. As with the S&P 500, this appears to us as a correction, albeit a sharp one and not the start of a new bull. Enthusiasm seems to be coming back too fast.
Source: www.stockcharts.com
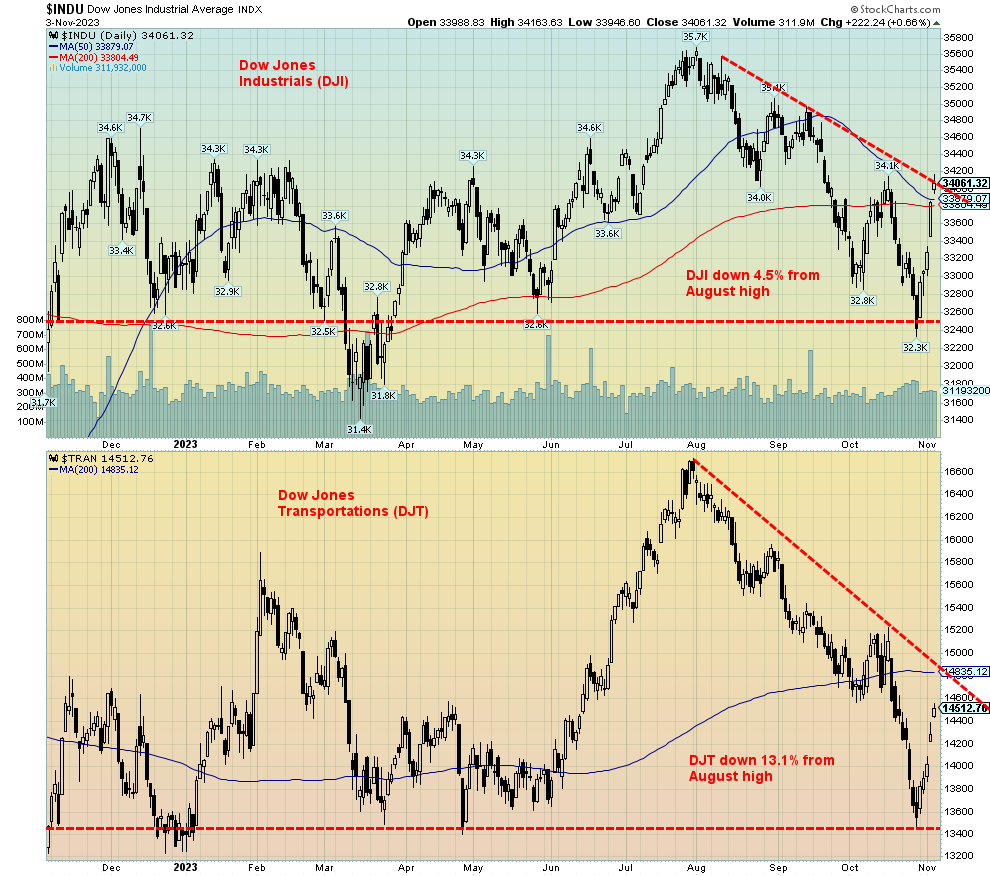
We’ll be keeping an eye on the DJI and DJT for potential divergences. A key tenet of Dow Theory is that the averages must agree with each other. Granted, at this point we have no confirmations. However, we can’t help but notice that, while the DJI has quickly recouped above both the 200-day and 50-day MAs, the DJT remains well below both. The DJI is currently down 4.5% from that August high, but the DJT is down 13.1% from the same high. The DJI is threatening to break its downtrend, whereas the DJT remains well below its downtrend. The DJI appears poised to take out its October high. The DJT is nowhere near that high. A potential divergence.
Source: www.stockcharts.com
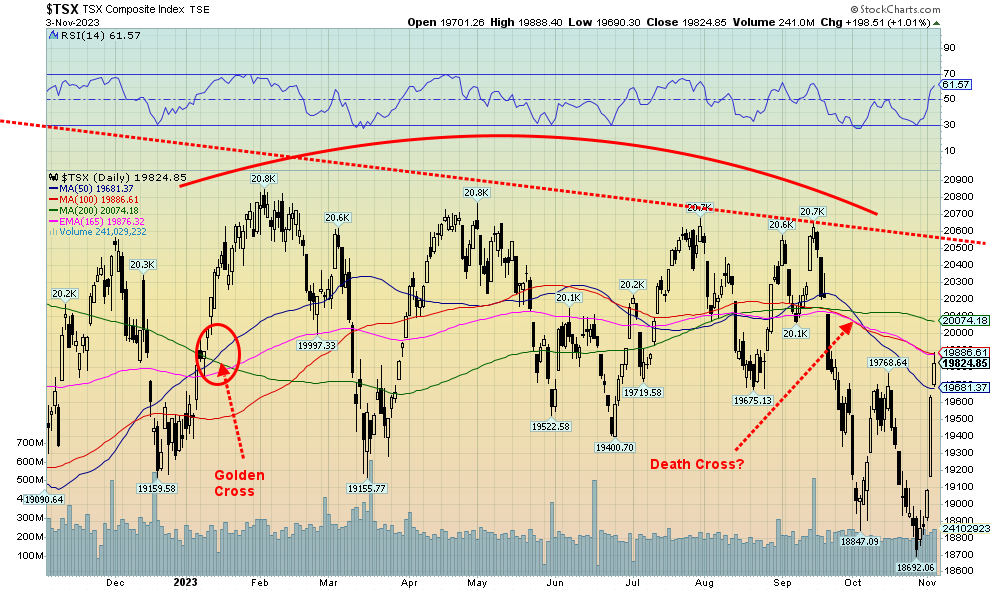
A spectacular bounce-back week for the TSX Composite as it leaped 5.8%. As we noted with the S&P 500 and other U.S. indices, was it too much too fast? And was it justified? Nonetheless, the TSX had a great week, bouncing back from mildly oversold levels. But, as we noted earlier, where’s the beef, the volume, and the breadth? So, as before, we are suspicious. We could make it back to the downtrend line that has stopped every rebound over the past year. Once past 20,600/20,700 we’d need to reassess. The small cap TSX Venture Exchange (CDNX) did not join the party, up only 0.9% and that was accomplished on November 3.
Not everyone joined the party as only 12 of the 14 sub-indices were up on the week. The losers? Materials (TMT) were down 2.1% and Golds (TGD) off 1.1%. The big winners were largely those sectors that were suffering. Income Trusts (TCM) was the big winner, up 13.0%. Information Technology (TKK) followed, up 12.6%. Real Estate (TRE) gained 9.4%, Utilities (TUT) +9.1%, Telecommunications (TTS) +8.8%, Health Care (THC) +9.5%, Financials (TFS) +7.0%, as was Consumer Staples (TCS) +7.0%. Despite the big gains, many of them remain down on the year. The following remain in negative territory for 2023 – Income Trusts (TCM), Financials (TFS), Metals & Mining (TGM), Golds (TGD) barely, Materials (TMT), Real Estate (TRE), Telecommunications (TTS), and Utilities (TUT). Information Technology (TKK) has been the big winner, followed by Health Care (THC) and Energy (TEN). The CDNX remains negative on the year and the TSX is up barely as is the TSX 60.
Materials, Metals, and Golds still look positive going forward. If interest rates were really to come down, then Income Trusts, Real Estate, Utilities, Financials could perk up. But overall this move is too much too fast.
U.S. 10-year Treasury Bond/Canadian 10-year Government Bond (CGB)
Source: www.tradingeconomics.com, www.home.treasury.gov, www.bankofcanada.ca
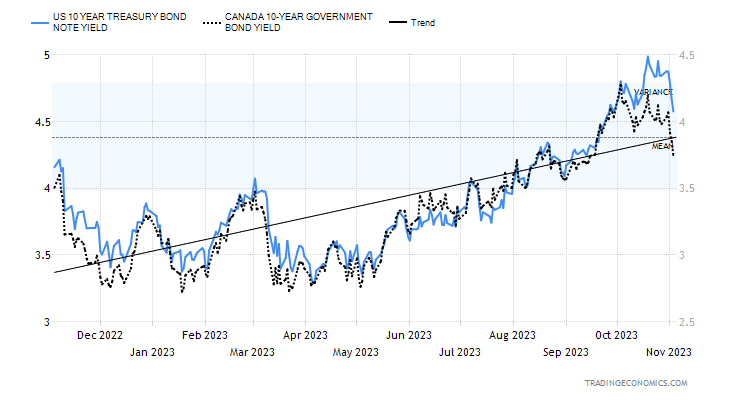
The lower-than-expected nonfarm payrolls on Friday have helped bond yields to fall this past week. The U.S. 10-year treasury bond fell to 4.57% from 4.83%. It was only a couple of weeks ago the 10-year hit just over 5%. That the Fed stood pat at the FOMC also helped bond yields, even though standing pat was widely expected. The Fed still talks a game about inflation so we are not expecting any rate cuts any time soon. The next FOMC is December 12–13 and many now widely expect the Fed to stand pat. That’s music for gold prices and for lower bond yields.
Other economic numbers that were weak include the Chicago PMI, which came in at 44—recession territory (anything under 50). The market had expected 45. House prices were generally higher, but that won’t last if unemployment is rising. Consumer confidence surprised, coming in at 102.6 vs. the expected 100.0. The S&P Global Manufacturing Index came in at 50, not in recession territory but not in growth territory, either. Construction spending was weaker. Initial jobless claims jumped on the week to 217,000, up from 212,000 the previous week and above expectations of 210,000. Factory orders were stronger than expected.
The Government of Canada 10-year bond (CGB) also fell to 3.74% from 3.98%. The inverted yield curve popped out. In the U.S. it rose from negative 16 bp to negative 27 bp and in Canada it rose to negative 65 bp from negative 61 bp. Still, the trend for the inverted yield curve continues downward. Invariably, a recession gets underway as the inverted yield curve disappears. Every recession since the 1970s has seen the recession get underway as the inverted yield curve approaches zero.
Will bond yields fall further? A break under 4.50% might suggest further declines. But we note we are approaching zones of support that range down to 3.50% for the 10-year. So, the best part of the down move might be over.
Source: www.stockcharts.com
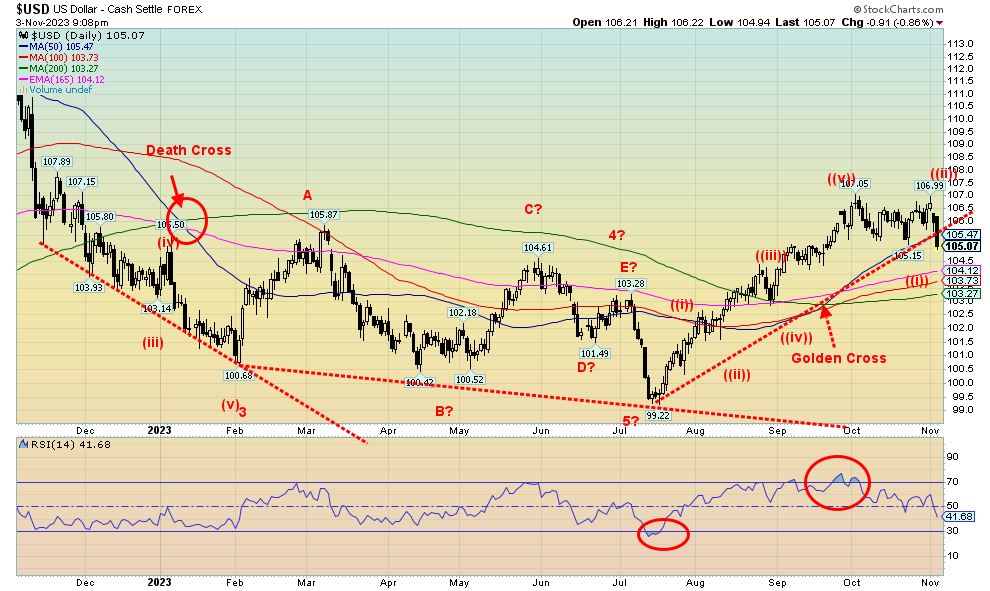
Has the US$ Index topped? It appears as if it has, given the break on Friday following the employment report. On the week, the US$ Index (USDX) fell 1.5% with most coming on Friday. The Canadian dollar was a beneficiary, up 1.6%. But so was the euro, up 1.5%, the Swiss franc, up 0.3%, the U.K. pound sterling, up 2.1%, and the Japanese yen, rising 0.1% after hitting fresh 52-week lows. A rising yen is positive for gold as the two are closely correlated. USDX appears now to have possibly made a double top at 107.05 and 106.99. A firm break under 105 could suggest USDX falls to 103/103.25. Under 103 USDX could enter a bear market. With the RSI at 41.5, it has more room to move lower.
The US$ Index is falling because of ongoing dysfunction in the U.S. government and the potentially negative impact on the U.S. with the wars between Israel/Hamas and Russia/Ukraine.
U.S. deficits keep rising and there is now a fight over funding for both Israel and Ukraine as the U.S. deficits soar. As well, the appointment of Johnson as the House Speaker leaves open the potential for major clashes between the House, the president, and the Senate. The USDX was also hurt by the lower-than-expected nonfarm payrolls on Friday. If the U.S. slows and falls into recession, that’s bad for the rest of the world and funds could flee the U.S. dollar.
Source: www.stockcharts.com
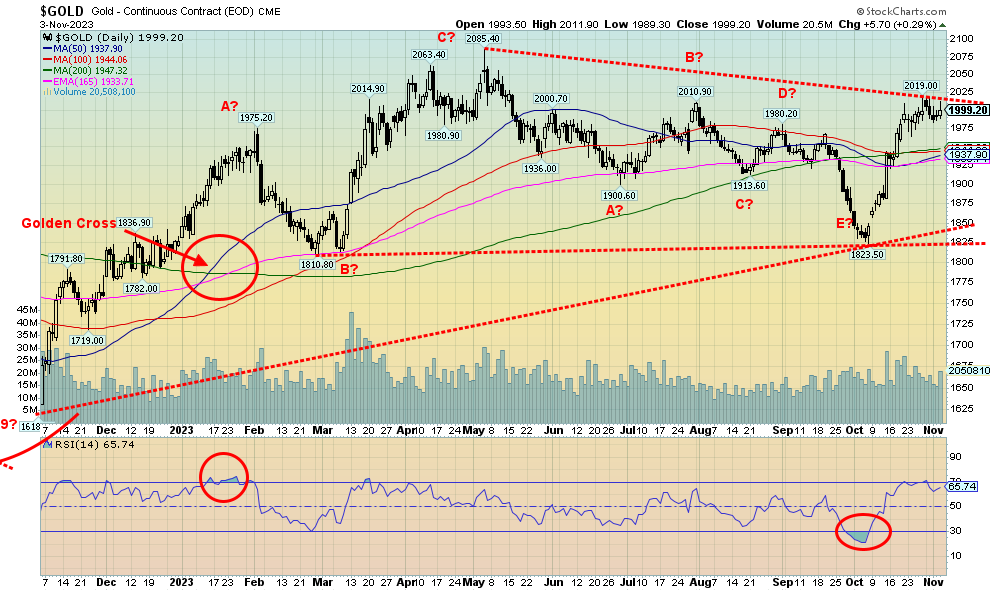
Was this a successful week for gold? We did manage to close flat with a minor gain of 70 cents. But we failed to close over $2,000. The $2,000 zone is still acting as resistance. Silver did gain on the week, up 1.7%, and the gold stocks were mixed, with the Gold Bugs Index (HUI) up 0.8% but the TSX Gold Index (TGD) losing 1.1%. The week was salvaged by Friday when the October employment numbers reported that nonfarm payrolls were up only 150,000 when they had expected upwards to 190,000. September was revised down and the unemployment rate ticked higher. Gold was up 0.3% on Friday but failed to close over our important $2,000 resistance. We do, however, appear poised to break the level, most likely this coming week. The past week appeared as a correction to the rise from the $1,823 low in early October. The entire zone up to around $2,090 remains as formidable resistance, but we expect to eventually break above it and possibly before year end. The falling US$ Index helped gold this past week as did falling bond yields.
Other metals were mixed. Platinum jumped 4.3%, but palladium fell 0.2% and copper was up 0.8%. However, gold’s rise was premised mostly on the thoughts that the Fed may be finished hiking rates. If the employment situation continues to deteriorate, that would keep the Fed on the sidelines but not necessarily spark the Fed to cut rates. Gold also notes the ongoing dysfunction in the U.S. government and the potential for the Israel/Hamas war to spread, along with the growing humanitarian crisis. Gold was up over 7% in October on safe haven demand. The Middle East war spreading into a regional war would help move gold prices higher.
The gold commercial COT fell to 27% this past week from 29%. That is no surprise as they tend to cover their longs as gold moves higher. But we’ve seen gold rise before, even with what appears to be an unfriendly COT. Resistance is at $2,000, but once firmly above that the next key area will be $2,025 then $2,050. Above $2,025, the odds suggest that gold could make new highs above $2,085. Above $2,100, gold could start a more sustained rise. It would also be a major breakout.
Gold is a safe haven commodity due the fact it has no liability and cannot be destroyed. It is especially true if the geopolitical situation were to deepen and if the dysfunction in the U.S. gets worse. Gold has positive seasonals that sometimes start in November and last until February.
Source: www.stockcharts.com
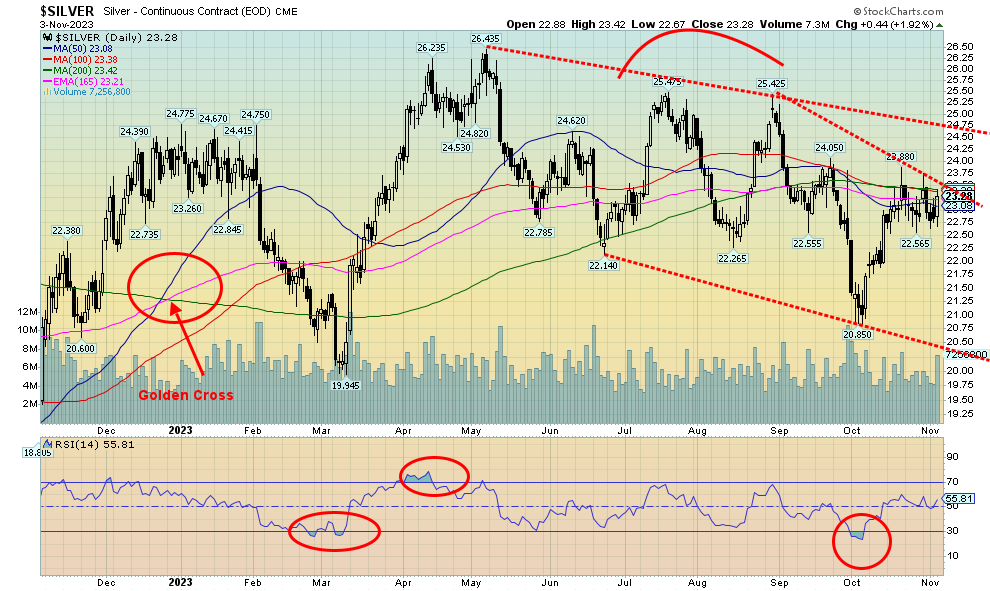
As with gold, silver prices jumped on Friday on news of the weaker than expected nonfarm payrolls and higher unemployment. On the week, silver gained 1.7% and managed to close over $23 once again. That’s positive as silver needs to hold above $23 to suggest that the next level at $24 could fall. Interim resistance is seen up to $23.50. After rising from the $20.85 low in early October, the recent corrective appears as a possible pennant formation. That suggests we should break to the upside. New highs above $24 would confirm the breakout. Indicators are turning up once again after a hook to the downside. Support now is down to $22.50, but under that level we could fall further. Above $25, new highs above the May high of $26.44 are probable.
On the other hand, a break under $21.50 would have us looking at new lows. The entire move down from the May high appears to us as an ABCDE type of correction. A break above $25 would suggest a breakout and a potential move to $30 or higher. The commercial COT remains at 35%, neither too bullish or too bearish.
Source: www.stockcharts.com
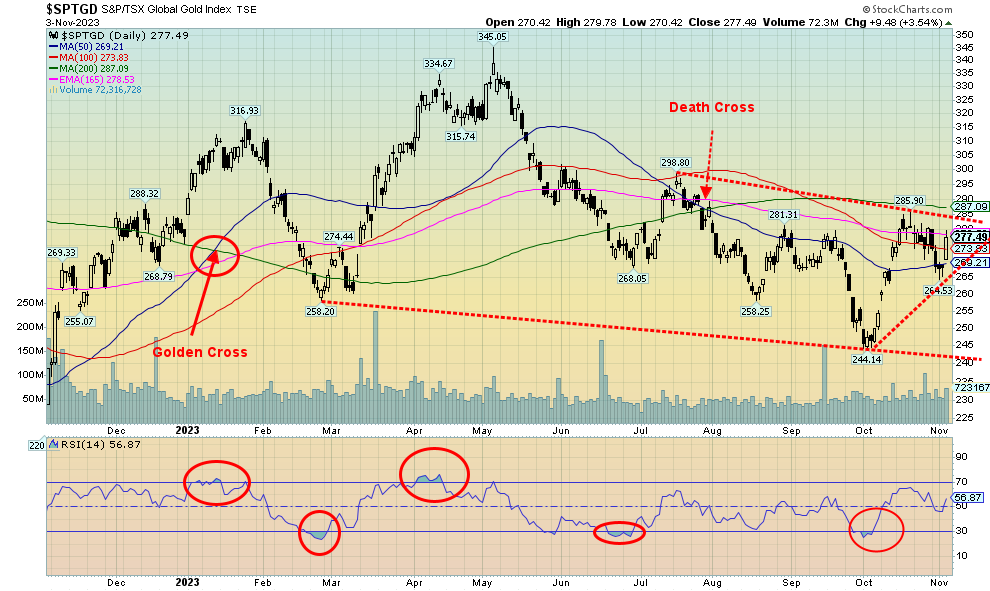
The gold stock indices had a strong up day on Friday, following the report of the lower-than-expected nonfarm payrolls and a rise in unemployment. Bonds rallied and the US$ Index fell, which was good for gold and the gold stocks. The TSX Gold Index (TGD) jumped 3.5% on Friday. However, that wasn’t enough to prevent a down week for the TGD as it lost 1.1%. The Gold Bugs Index (HUI) fared a bit better as it gained about 0.8% on the week. Follow-through this coming week will be important for both indices. For the TGD, following that low at 244, this appears as a corrective pattern forming a small flag formation to the downside. A firm break above 286 and especially above 288 would suggest a low is in and higher prices lie ahead. Over 300 would be better. Above 320 and the odds suggest that new highs over the May high of 345 are probable. The all-time high set in 2011 remains far away at 455. Yes, a 12-year bear market in gold stocks, despite some good years such as 2016 and 2020. But all failed to see new highs. Support appears down to 265, but a drop under 260 would be negative and under 253 new lows are probable. Long-term support looks good down to 240.
Source: www.stockcharts.com
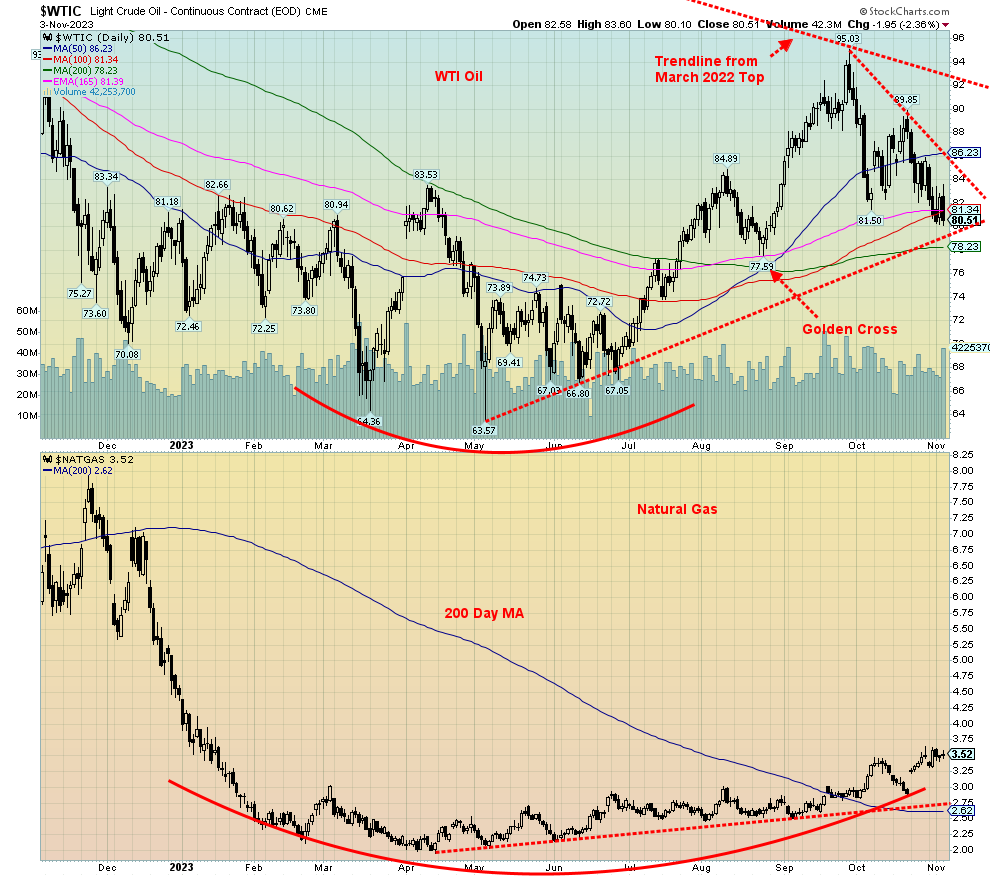
Fear of recession appears to be overwhelming fear of the war expanding. For the second week in a row, WTI oil fell sharply this week, losing 5.9%. Brent crude fell 4.1%, also for the second week in a row. Still, it was a volatile week with some sharp ups and downs. We are now rapidly approaching that uptrend line from the May low. It is near $78.30, but we’d use $78 as our key point. If that breaks, then WTI could be headed lower. WTI briefly jumped after the Fed held rates steady on Wednesday, but fell sharply on Friday with news of the lower-than-expected nonfarm payrolls. Production has also jumped, but will demand keep up?
Natural gas (NG) was also mixed with NG at the Henry Hub up 1.2% but down 4.9% at the EU Dutch Hub. The Henry Hub was being driven by low inventories and rising demand. The Dutch Hub fell, thanks to a reboot of the shipments from Egypt and Israel restarting the Karish field after shutting it down due to the war. The Egyptian flow is still low at 250 million cubic feet/daily, but could soon be back to the old average of 800 million cubic feet/daily. Unseasonably warm weather and full tanks are also not helping the Dutch Hub price. At the other end, expectations are for a colder winter in the Americas, which could increase demand.
WTI oil is clinging to its uptrend and NG appears poised to go higher, having hit now the highest prices since January 2023. Seasonally, we are moving slowly into the best period for both oil and gas from December to June. The energy indices took it on the chin on Friday with WTI’s big drop but still managed to close higher on the week. The ARCA Oil & Gas Index (XOI) was up 2.0% while the TSX Energy Index (TEN) gained 1.8%. Both indices are struggling below its highs. However, if WTI prices were to leap again then the indices would follow. For WTI this still looks like a very sharp ABC correction following what appears to be a five-wave advance from the low in May 2023 at $63.87. That would suggest that, once this correction is over, WTI should advance once again.
If the uptrend line holds, expect WTI to rise again. If the war in the Middle East were to expand, that could also spark higher oil prices. Could the Arabs once again impose an embargo as they did in 1973? It’s been mentioned. And, as well, if things were to slide out of control in the Russia/Ukraine war, that could also negatively impact oil prices, sending them higher.
Copyright David Chapman 2023
GLOSSARY
Trends
Daily – Short-term trend (For swing traders)
Weekly – Intermediate-term trend (For long-term trend followers)
Monthly – Long-term secular trend (For long-term trend followers)
Up – The trend is up.
Down – The trend is down
Neutral – Indicators are mostly neutral. A trend change might be in the offing.
Weak – The trend is still up or down but it is weakening. It is also a sign that the trend might change.
Topping – Indicators are suggesting that while the trend remains up there are considerable signs that suggest that the market is topping.
Bottoming – Indicators are suggesting that while the trend is down there are considerable signs that suggest that the market is bottoming.
Disclaimer
David Chapman is not a registered advisory service and is not an exempt market dealer (EMD) nor a licensed financial advisor. He does not and cannot give individualised market advice. David Chapman has worked in the financial industry for over 40 years including large financial corporations, banks, and investment dealers. The information in this newsletter is intended only for informational and educational purposes. It should not be construed as an offer, a solicitation of an offer or sale of any security. Every effort is made to provide accurate and complete information. However, we cannot guarantee that there will be no errors. We make no claims, promises or guarantees about the accuracy, completeness, or adequacy of the contents of this commentary and expressly disclaim liability for errors and omissions in the contents of this commentary. David Chapman will always use his best efforts to ensure the accuracy and timeliness of all information. The reader assumes all risk when trading in securities and David Chapman advises consulting a licensed professional financial advisor or portfolio manager such as Enriched Investing Incorporated before proceeding with any trade or idea presented in this newsletter. David Chapman may own shares in companies mentioned in this newsletter. Before making an investment, prospective investors should review each security’s offering documents which summarize the objectives, fees, expenses and associated risks. David Chapman shares his ideas and opinions for informational and educational purposes only and expects the reader to perform due diligence before considering a position in any security. That includes consulting with your own licensed professional financial advisor such as Enriched Investing Incorporated. Performance is not guaranteed, values change frequently, and past performance may not be repeated.
About the author


Website: https://www.enrichedinvesting.com
Disclaimer: David Chapman is not a registered advisory service and is not an exempt market dealer (EMD) nor a licensed financial advisor. We do not and cannot give individualised market advice. David Chapman has worked in the financial industry for over 40 years including large financial corporations, banks, and investment dealers. The information in this newsletter is intended only for informational and educational purposes. It should not be considered a solicitation of an offer or sale of any security. The reader assumes all risk when trading in securities and David Chapman advises consulting a licensed professional financial advisor before proceeding with any trade or idea presented in this newsletter. David Chapman may own shares in companies mentioned in this newsletter. We share our ideas and opinions for informational and educational purposes only and expect the reader to perform due diligence before considering a position in any security. That includes consulting with your own licensed professional financial advisor.