
A bit of a hybrid shorter report this weekend due to the sudden onset of a flu bug that hit us leaving us bedridden at times.
This week's Scoop is against the backdrop of what may be the most divisive contentious election in U.S. history since the Civil War. Over the past couple of weeks, we've had an assassination attempt, the sudden resignation of president Joe Biden, the emergence of Project 2025 as an election issue, the potential for Kamala Harris to become the first female president of the U.S. and we've learned about childless cat ladies. And there are still 100 days to go.
The expectation is that a Kamala Harris presidency would be an extension of Biden's presidency and therefore present fewer contentious policies than would a Donald Trump presidency. However, there are many wild cards and one is whether the electorate would accept either candidate as president. That is not a given.
The stock markets are wobbling as a tech/AI selloff appears to be underway. One beneficiary appears to be the blue-chip Dow Jones Industrials (DJI) that rose this past week while the MAG 7 dominated S&P 500 and NASDAQ sold off. Still, we have a short way to go to get official sell signals. One would think that gold would be a beneficiary of the chaos but so far it has been sliding as well. Nonetheless, we note a number of positive divergences there that suggest this could be temporary. For example, Lundin Gold Inc. reported increased ore tons processed, pays a dividend, and is held in the Enriched Capital Conservative Growth Strategy.*
Our chart of the week centers on copper that only a short while ago hit record highs but has since hit the skids. But increased demand and dwindling supplies should have a positive impact on the metal going forward.
This past week saw the Bank of Canada cut rates by 25 bp as was widely expected. This week the FOMC meets for its interest rate decision. Despite the continued improvement in the inflation rate the Fed is expected to leave rates unchanged. That would shift the expectations to the September meeting where it is widely expected the Fed will cut. The upcoming week is one of economic numbers and the big one is on Friday August 2 with the release of the July employment report. The expectation is for nonfarm payrolls to rise by 190,000. Canada releases its employment report the following week.
Things may be crazy out there but the Scoop tries to provide a guidepost for the markets. Have a great week.
DC
* Reference to the Enriched Capital Conservative Growth Strategy and its investments, celebrating a 5-year history of strong growth, is added by Margaret Samuel, President, CEO and Portfolio Manager of Enriched Investing Incorporated, who can be reached at 416-203-3028 or msamuel@enrichedinvesting.com
“Whom the gods would destroy, they first put on the cover of Business Week.”
—Paul Krugman, American economist, professor of economics City University of NY, columnist NY Times, Nobel Prize economics (2008); b. 1953
“To know values is to know the meaning of the market.”
—Charles Dow, American journalist, co-founder of Dow Jones & Co. with Edward Jones and Charles Bergstresser, co-founder of the Wall Street Journal, inventor of the Dow Jones Industrials Average, creator of the Dow Theory, laying the groundwork for technical analysis; 1851–1902
“First rule is not to lose. The second rule is don’t forget the first.”
—Warren Buffett, American businessman, investor, philanthropist, Chairman & CEO Berkshire Hathaway, known as the Oracle of Omaha; b. 1930
President Joe Biden resigned from running as the Democrat nominee for the president of the U.S. The election is to be held on November 5, 2024 between whoever the Democrats nominate and the Republican nominee Donald Trump. It has, so far, been an extremely divisive campaign and with the resignation of Biden the divisiveness is not expected to change. The nominee for the Democrats appears to be Kamala Harris, the current vice-president.
Biden’s resignation and the possibility of a Harris candidacy and her becoming the president has set many to look at her potential policies, particularly economic policy, and where it might differentiate from Trump’s. Quite simply, the two are not alike. And they come at things from two completely different angles.
If there was one positive thing about the Biden presidency, it is that the U.S. experienced the strongest recovery from the pandemic. That was largely unexpected. Unemployment fell to multi-year lows and jobs were plentiful. It was one of the best job reports on record. Interest rates had been dropped to almost zero (compared to negative interest rates in the EU and Japan) and oodles of liquidity were supplied to the market via quantitative easing or QE. Money supply exploded.
But the ultra-low interest rates. coupled with the monetary explosion, eventually helped unleash inflation. No, that was not the only reason as supply chain disruptions and droughts or floods negatively impacting agricultural regions also contributed. The inflation wasn’t limited to prices. It also included housing and the stock market. House prices under both Trump and Biden exploded upwards (even more so in Canada) because of plenty of money and ultra-low interest rates. The stock market also benefitted, hitting records under both presidents. The AI explosion goosed stock markets even more.
Performance for Selected Indicators by President (2017–2024)
|
Indicator |
Trump 2017–2021 |
Biden 2021–present |
|
Gold |
55.4% |
31.3% |
|
S&P 500 |
70.2% |
42.9% |
|
NASDAQ |
142.9% |
31.4% |
|
10-year US treasury note |
10.2% |
(18.9)% |
|
Employment |
(2.0)% |
10.9% |
|
CPI |
7.4% |
19.4% |
|
GDP |
13.8% |
28.3% |
|
Case Shiller 20-city housing prices |
25.1% |
33.2% |
|
US$ Index |
(10.2)% |
15.4% |
|
Unemployment Rate |
36.2% |
(35.9)% |
|
University of Michigan Sentiment Index |
(18.0)% |
(16.5)% |
|
Fed Rate |
(86.4)% |
5,822.2% |
Source: www.stockcharts.com
As the table shows, inflation was up 7.4% under Trump but leaped 19.4% under Biden, which is down from its peak. Stock markets started their upward thrusts under Trump and kept going under Biden. Gold prices also leaped under both presidents to record highs. However, employment expanded sharply under Biden as the unemployment rate fell sharply under Biden after rising sharply under Trump during the pandemic. During Biden’s tenure there were complaints of labour shortages. The Fed rate was dropped to almost zero under Trump, but has leaped sharply higher under Biden as inflation soared. House prices have just kept on rising. GDP improved considerably under Biden but consumer sentiment has been falling under both Trump and Biden. The US$ Index fell under Trump but has since risen under Biden.
No matter who comes to power in 2024, the negatives are growing. The economy is slowing; however, you wouldn’t know it with the reported preliminary release of Q2 GDP that unexpectedly came in at 2.8% when it was expected to be 2.5%. It wasn’t all good news as the GDP Sales advance was 2% below the expected 2.8% but the GDP price index was 2.3% vs. the expected 2.6%. Better growth, but poorer sales and less inflation. However, these numbers are subject to revisions before the final tally in September.
Wages rebounded with the rising number of jobs and falling unemployment. However, consumer sentiment remains near multi-year lows. Consumer sentiment, according to the Michigan Consumer Sentiment Index, fell under both Trump and Biden. Wars, the pandemic, domestic divisiveness, and increasingly fierce storms and heat waves have all contributed. High prices seem to offset high employment. The upcoming election is also causing considerable uncertainty.
No matter who becomes the next president, both face headwinds. Harris has maintained a strong defense of the Biden administration’s economic policies. Expect those to continue. Unlike Trump, there is no sign a Harris administration would sharply increase tariffs, thus sparking trade wars. However, notably the tariffs put on during the first Trump administration are still in place. The tax cuts from the Trump administration are set to expire in 2025 and a Harris administration would most likely allow them to expire, with possible tinkering. That would mean the corporate rate could go back to 35% from 21% rather than Trump’s proposal of dropping it to 15%.
Harris has indicated a desire to find ways to provide relief from high rents and high housing prices. However, to be able to succeed, Harris would, at least, need Congress to switch to the Democrats and preferably the Senate as well. Otherwise, proposals, which have already percolated, would be dead on arrival.
Harris would be a major supporter for minority businesses and in looking for ways to lower pay inequality. She is also a strong proponent of education for all. She would also continue the Biden administration’s fight on energy and climate change, something a Trump administration would not do.
GDP Growth Rate % 2017–2024
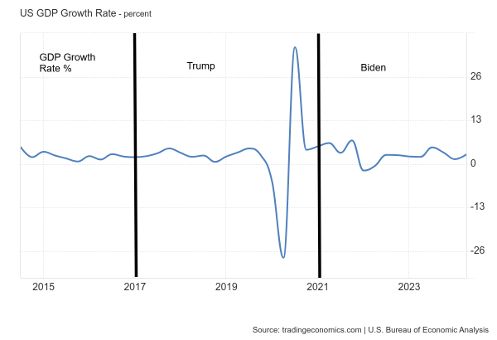
Source: www.tradingeconomics.com, www.bea.gov
It may be best to look at the GDP growth rate before the pandemic of 2020 and its negative impact on GDP, employment, interest rates, and more. Before the pandemic, the growth rate was roughly the same as it has been under four years of Biden. As for employed persons, the huge loss during the pandemic has been fully recovered and then some. But, as the chart shows, the number of persons employed is starting to flatline and wobble.
Employed Persons in Thousands 2017–2024
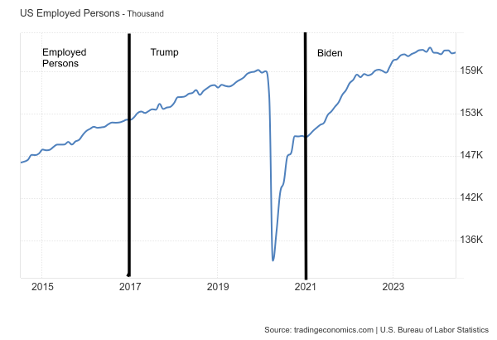
Source: www.tradingeconomics.com, www.bls.gov
Since 2000, the population level of the U.S. (those 16 years of age and over) has grown by 55,756 thousand or 19.8%. The civilian labour force (all those in labour force both employed and unemployed) has grown by 25,742 thousand or 18.1%. However, those not in the labour force (retirees, disabled persons, students, those taking care of children or elderly (not paid), and those deemed no longer in the labour force (NILF) neither employed or unemployed due to changes in 1994) has grown by 31,287 thousand or 45% since 2000. This was under four different presidents, which included 12 years of Republican presidents and 12 years of Democrat presidents. The big rise for those not in the labour force came after the 2008 financial crash.
Population level, Civilian Labour Force, Not in Labour Force 2000–2024
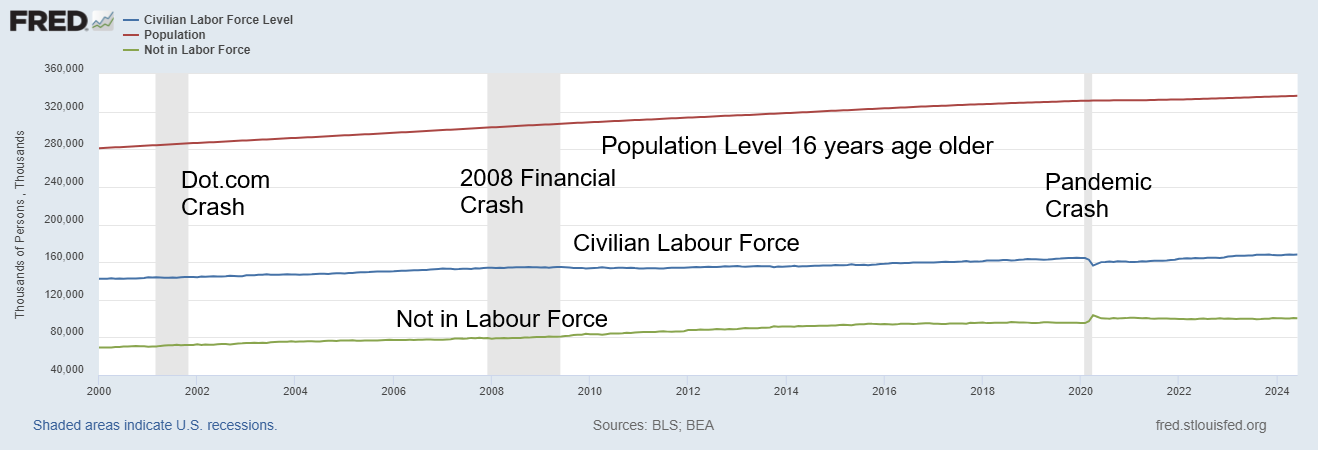
Source: www.stlouisfed.org
Inflation Rate (CPI) and PCE Prices 2014-2024
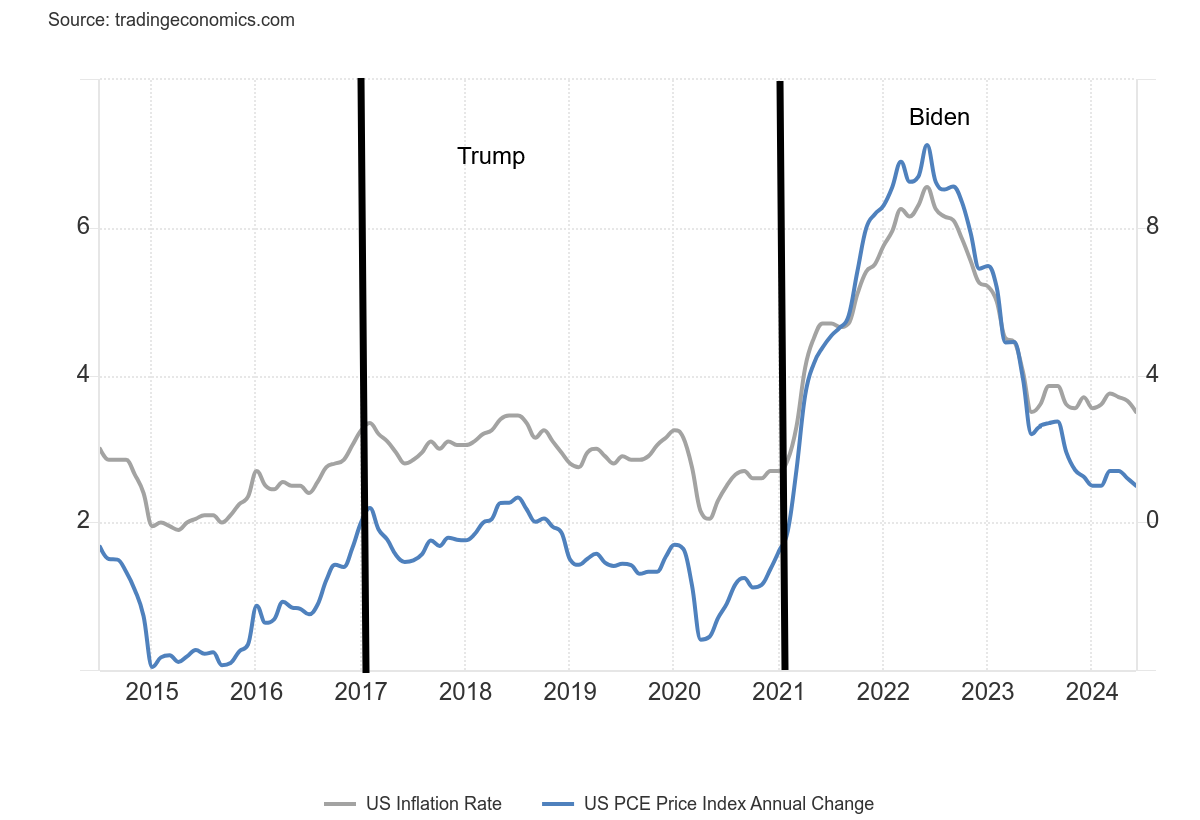
Source: www.tradingeconomics.com, www.bls.gov, www.bea.gov
Inflation soared after the pandemic crash of 2020. But the conditions for the sharp rise in inflation were set before that because of the huge QE resulting from the pandemic, along with lowering interest rates to near zero. Add in supply disruptions, droughts, etc., and prices were bound to rise no matter who was in charge. Nonetheless, all the largesse, coupled with ultra-low interest rates, set off a huge rise in the stock market, gold, the housing market, and more. This eventually forced the Fed to hike interest rates and bring in QT (quantitative tightening) to combat inflation. It is no surprise that things are showing signs of slowing, the economy is slowly rolling over, and defaults, delinquencies, bankruptcies, and unemployment are all rising. So far, it has not turned into a rout.
No matter who is the president elect on November 5, they will be facing a declining economy and probably a declining stock market. Inflation is moderating and a rate cut is still expected for September. The wild card for the markets is the deep divisions in the U.S. that, in a worst-case scenario, could break out in violence. This election is already one of the most contentious ever with its share of surprises such as the Trump assassination attempt and the resignation of Biden. Could things get worse? Yes. That is irrespective as to who wins in November. If all is allowed to proceed, the differences in the two candidates’ platforms suggest that the stock market and gold could both do well under Trump but less so under a Harris administration (the presumed Democrat candidate). But inflationary forces could also be unleashed, particularly under Trump with trade wars and more huge tax cuts, forcing the Fed to act once again to put the brakes on.
No matter how we look at it and who wins in November, the next four years promise to be rocky.
Chart of the Week
Source: www.stockcharts.com
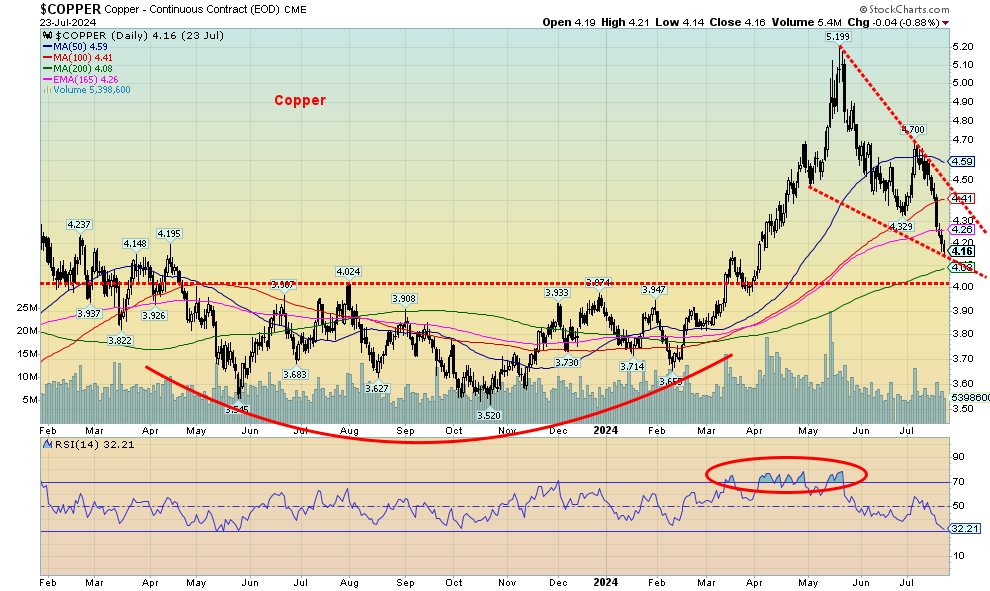
Since peaking at $5.20 back in May 2024, copper prices have fallen rather precipitously—down 20% just like that. Grant you, copper had leaped over 40% from a February 2024 low, so some sort of pullback was to be expected. The correction is just over the Fibonacci 61.8% point, making this thus far a steep but normal correction. However, beware a breakdown under $3.90 as below that new lows become possible. The 200-day MA near $4.05/$4.10 could provide support. But the reality is that we need to regain above that last high at $4.70 to suggest the low is in.
So why copper? Copper is in demand globally, particularly as clean energy for solar panels, wind turbines, and electric vehicles (EVs). It is also needed to expand energy grids. It is used elsewhere as well—in electric wires, cables, plumbing, industrial machinery, and construction. Yes, and the growth of AI is also going to impact the demand for copper. The list goes on. While copper is abundant in the earth, the reality is that it takes upwards of 16 years to bring a copper mine from discovery to production. And an abundance of copper is not necessarily in friendly places.
The world’s largest copper producer is Chile, followed by the Democratic Republic of Congo, Peru, China, and the U.S. Russia is also a large copper producer, ranking sixth in the world. As to consumers, China leads by a wide margin over second place United Kingdom. Together with the EU they consume less than a quarter of what China consumes. North America (Canada, U.S.) is in third place, still well behind the EU and U.K.
When it comes to reserves, Chile has by far the largest with an estimated 20% of the global total. Canada by comparison has only about 1% of the global total. Other large reserves are found in Peru, the Democratic Republic of Congo, Australia, and Russia. Interestingly, Chile and Peru are often paralyzed by strikes, rebels operate in the Democratic Republic of Congo, and Russia is under sanctions. Yet even as demand increases, supplies dwindle as the chart from Sprott Asset Management attests. Sprott suggests that demand increases 4.8 times to 2050 from 2022.
So, demand is increasing, supply is dwindling, plus there is a need to find more copper. That may explain why we’ve seen some increased interest in copper companies. The largest companies involved in copper mining include BHP Group, Freeport McMoran, and Glencore PLC. There are others, along with numerous junior miners, involved mostly in exploration. Freeport McMoran (FCX/TSX) is up just over 6% in 2024, but we note it is also down 18.5% from its 2024 high, in line with the drop in copper prices. One sign of the need for copper is BHP’s bid to take over Anglo-American another large copper producer.
We were struck by an article written by Tom Stevenson in The Telegraph on May 2, 2024 (https://www.telegraph.co.uk/business/2024/05/02/world-poised-on-edge-new-copper-supercycle/). (Note: a subscription may be required.) Mr. Stevenson said the word in the movie The Graduate was “plastics.” He suggests the word today is “copper.” Our colleague Mike Ballanger of GGM Advisory also notes the need for copper. We are adding our voice.
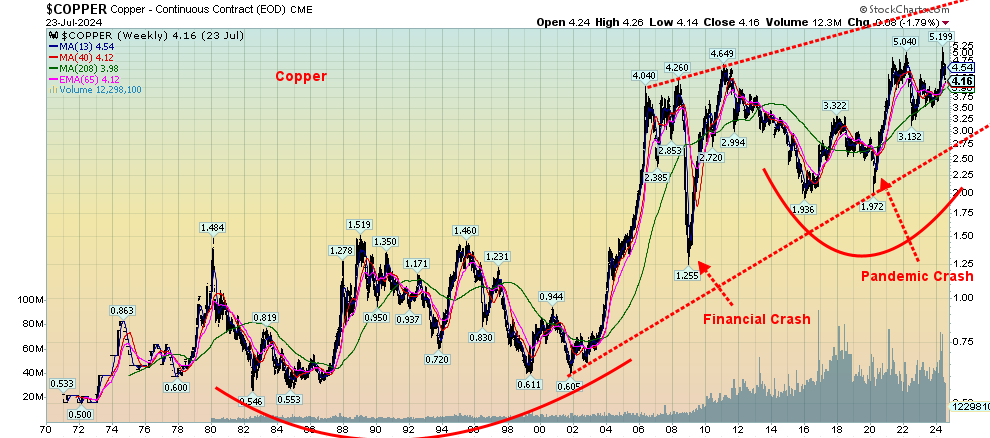
Here are two charts to follow, including a long-term chart from 1970. Note the long consolidation throughout the 1980s, the 1990s, and into the early 2000s. Since then, copper prices have broken out, reaching all-time highs in 2024. The long-term trend is up, signified by higher highs and higher lows. Since the pandemic low in March 2020, copper prices on pullbacks have held the 4-year MA. Today, once again we are testing near that line. Copper should resume its upward trend going forward once a bottom has been determined.
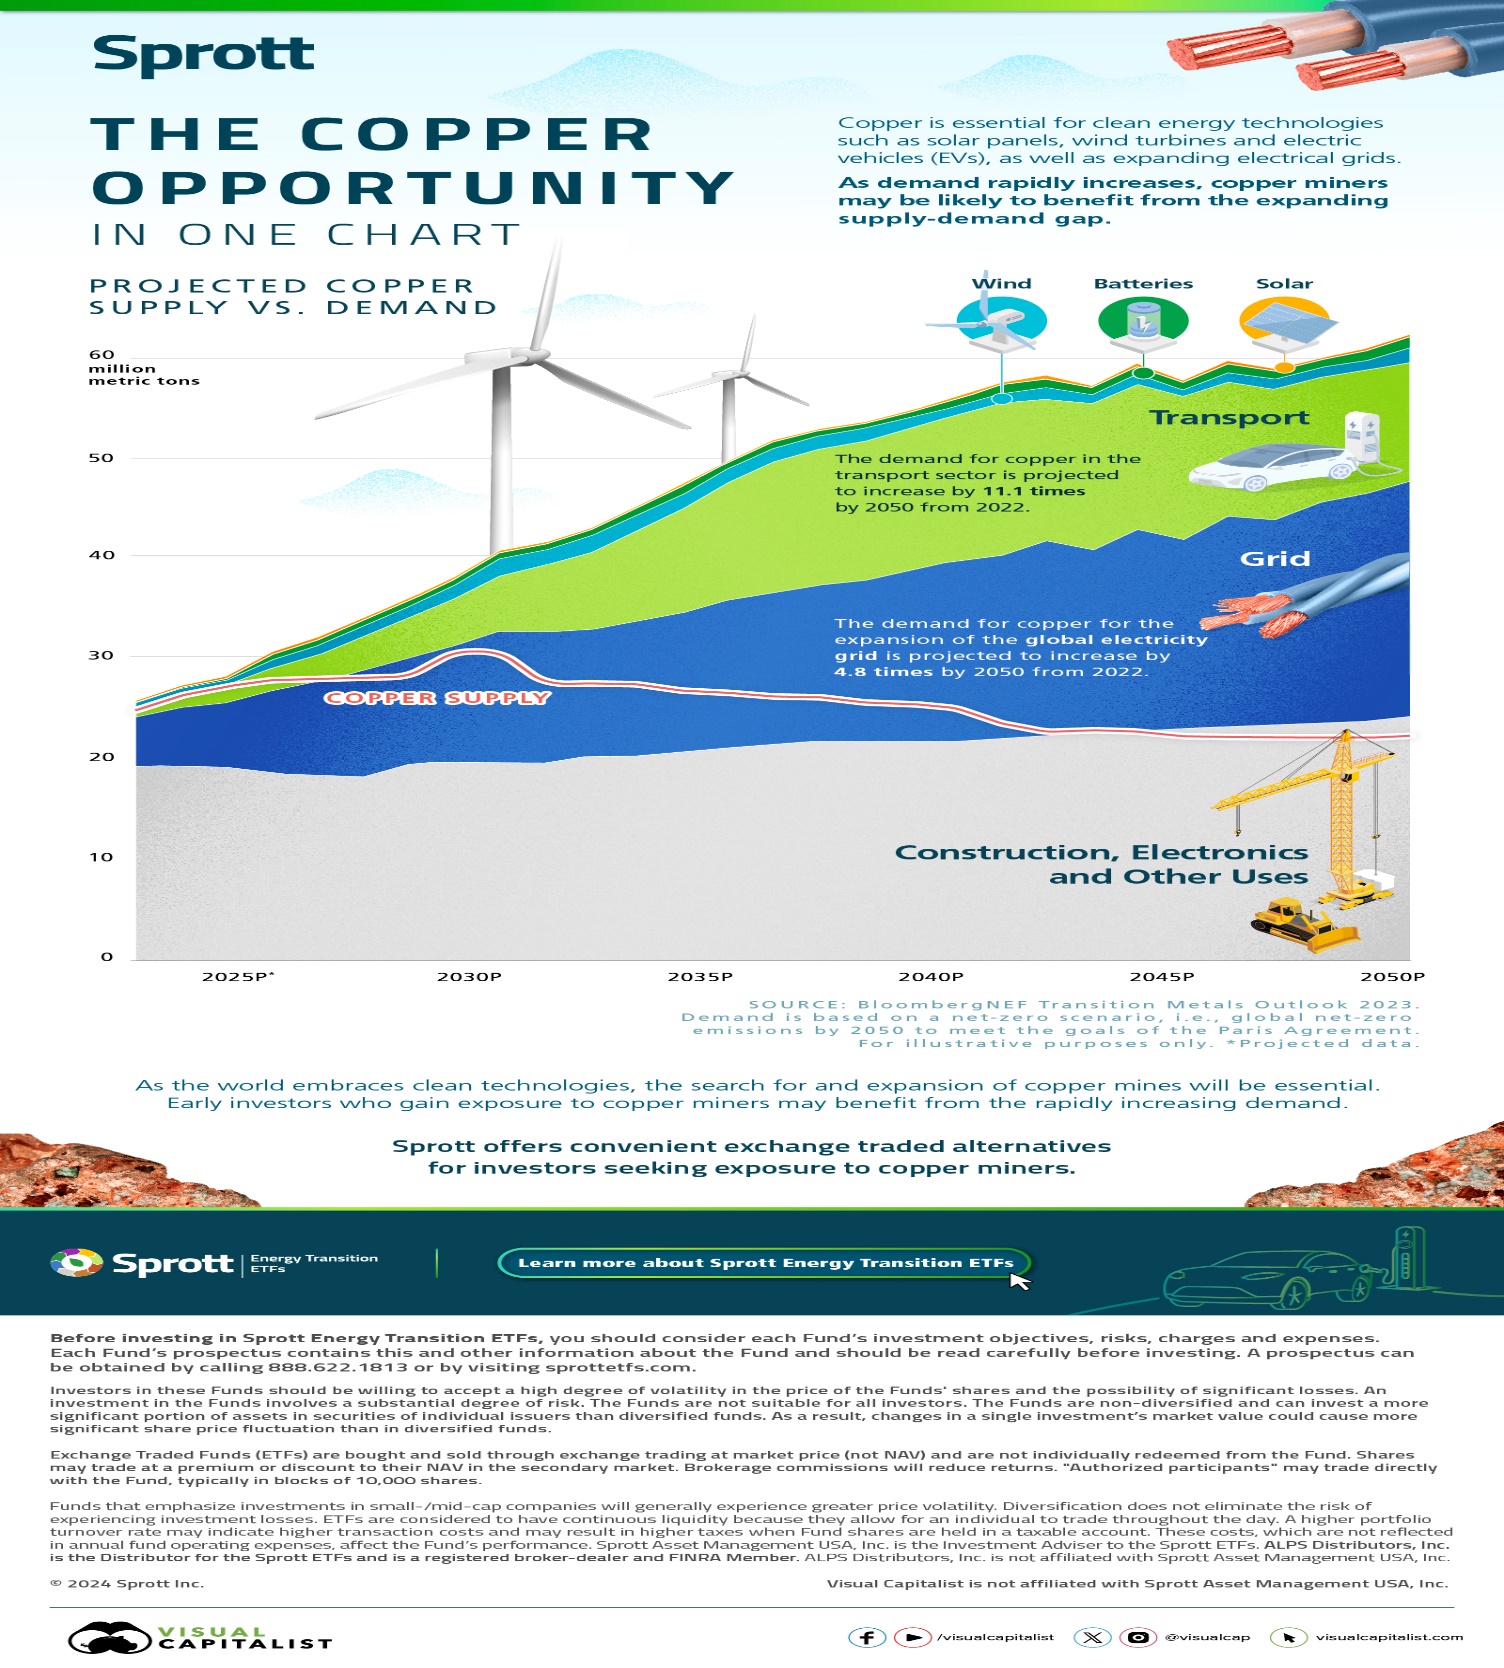
Source: www.visualcapitalist, www.bloomberg.com, www.sprott.com
Copper 1970–2024
Source: www.stockcharts.com
Markets & Trends
|
|
|
|
% Gains (Losses) Trends
|
|
||||
|
|
Close Dec 31/23 |
Close Jul 26, 2024 |
Week |
YTD |
Daily (Short Term) |
Weekly (Intermediate) |
Monthly (Long Term) |
|
|
Stock Market Indices |
|
|
|
|
|
|
|
|
|
S&P 500 |
4,769.83 |
5,459.10 |
(0.8)% |
14.5% |
neutral |
up |
up |
|
|
Dow Jones Industrials |
37,689.54 |
40,589.34 |
0.8% |
7.7% |
up |
up |
up |
|
|
Dow Jones Transport |
15,898.85 |
15,919.59 |
0.9% |
0.1% |
up |
up |
up |
|
|
NASDAQ |
15,011.35 |
17,357.88 |
(2.1)% |
15.6% |
down |
up |
up |
|
|
S&P/TSX Composite |
20,958.54 |
22,814.81 |
0.6% |
8.9% |
up |
up |
up |
|
|
S&P/TSX Venture (CDNX) |
552.90 |
579.33 |
(1.8)% |
4.8% |
down (weak) |
up |
up (weak) |
|
|
S&P 600 (small) |
1,318.26 |
1,429.35 |
3.5% |
8.4% |
up |
up |
up |
|
|
MSCI World |
2,260.96 |
2,344.36 |
(2.3)% |
3.7% |
down (weak) |
up |
up |
|
|
Bitcoin |
41,987.29 |
67,459.52 |
0.8% |
60.9% |
up |
neutral |
up |
|
|
|
|
|
|
|
|
|
|
|
|
Gold Mining Stock Indices |
|
|
|
|
|
|
|
|
|
(1.5)% |
243.31 |
292.69 |
(1.3)% |
20.3% |
up |
up |
up |
|
|
TSX Gold Index (TGD) |
284.56 |
347.30 |
(1.1)% |
22.1% |
up |
up |
up |
|
|
|
|
|
|
|
|
|
|
|
|
% |
|
|
|
|
|
|
|
|
|
U.S. 10-Year Treasury Bond yield |
3.87% |
4.20% |
(1.2)% |
8.5% |
|
|
|
|
|
Cdn. 10-Year Bond CGB yield |
3.11% |
3.35% |
(2.1)% |
7.7% |
|
|
|
|
|
Recession Watch Spreads |
|
|
|
|
|
|
|
|
|
U.S. 2-year 10-year Treasury spread |
(0.38)% |
(0.20)% |
25.9% |
47.4% |
|
|
|
|
|
Cdn 2-year 10-year CGB spread |
(0.78)% |
(0.28)% |
17.7% |
64.1% |
|
|
|
|
|
|
|
|
|
|
|
|
|
|
|
Currencies |
|
|
|
|
|
|
|
|
|
US$ Index |
101.03 |
104.33 |
(0.1)% |
3.3% |
down (weak) |
neutral |
up (weak) |
|
|
Canadian $ |
75.60 |
72.38 |
(0.8)% |
(4.3)% |
down |
down |
down |
|
|
Euro |
110.36 |
108.57 |
(0.2)% |
(1.6)% |
up (weak) |
up |
neutral |
|
|
Swiss Franc |
118.84 |
113.15 |
0.6% |
(4.8)% |
up |
neutral |
up |
|
|
British Pound |
127.31 |
128.72 |
(0.3)% |
1.1% |
up |
up |
neutral |
|
|
Japanese Yen |
70.91 |
65.02 |
2.4% |
(8.3)% |
up |
down |
down |
|
|
|
|
|
|
|
|
|
|
|
|
|
|
|
|
|
|
|
|
|
|
Precious Metals |
|
|
|
|
|
|
|
|
|
Gold |
2,071.80 |
2,381.00 |
(0.8)% |
14.9% |
up (weak) |
up |
up |
|
|
Silver |
24.09 |
28.02 |
(4.4)% |
16.4% |
down |
up |
up |
|
|
Platinum |
1,023.20 |
973.90 |
(3.9)% |
(4.8)% |
down |
neutral |
neutral |
|
|
|
|
|
|
|
|
|
|
|
|
Base Metals |
|
|
|
|
|
|
|
|
|
Palladium |
1,140.20 |
886.90 |
(1.7)% |
(22.2)% |
down |
down |
down |
|
|
Copper |
3.89 |
4.12 |
(2.8)% |
5.9% |
down |
neutral |
up (weak) |
|
|
|
|
|
|
|
|
|
|
|
|
Energy |
|
|
|
|
|
|
|
|
|
WTI Oil |
71.70 |
77.16 |
(1.9)% |
7.5% |
down |
neutral |
neutral |
|
|
Nat Gas |
2.56 |
2.05 |
(3.8)% |
(19.9)% |
down |
down |
down |
|
Source: www.stockcharts.com
Note: For an explanation of the trends, see the glossary at the end of this article.
New highs/lows refer to new 52-week highs/lows and, in some cases, all-time highs.
- * New All-Time Highs
Source: www.stockcharts.com
Is the high tech/AI bubble bursting? We ask that question as this past week saw once again the Magnificent Seven lead the tech world down. But the beneficiary of that sell-off was the Dow Jones Industrials (DJI), which rose on the week. It was a decidedly mixed week with the S&P 500 down 0.8% but the DJI gaining 0.8%. The Dow Jones Transportations (DJT) did even better, up 0.9%. But the tech-heavy NASDAQ fell 2.1% and the NY FANG Index dropped 3.3%. The small caps continue to do well with the S&P 400 (Mid) up 2.0% and the S&P 600 (Small) up 3.5%. Many take that as a signal that the market is broadening out. It’s an odd one, though, as the tech/AI sell off and the blue chips and the small caps rise. In a bit of a divergence, the S&P 500 Equal Weight Index rose 0.8%. That’s another clue that we appear to be broadening out, even as tech/AI takes its lumps. Bitcoin rose 0.8% but remains below recent highs.
Standouts this past week for the Mag 7 were Google, falling 6.0%, and Tesla, dropping 8.4%. Advanced Micro (AMD) fell 7.7%.
In Canada, the TSX Composite rose 0.6% but the TSX Venture Exchange (CDNX) continues to have trouble, falling 1.8%. Interest-sensitive stocks are responding to lower interest rates as Income Trusts (TCM) rose 2.7%, Real Estate (TRE) was up 3.5%, and Utilities (TUT) rose 3.1%. Financials (TFS) made all-time highs, rising 1.3%.
In the EU, the London FTSE was up 1.6%, the EuroNext fell 0.5%, the Paris CAC 40 fell 0.2%, while the German DAX gained 1.4%. In Asia, China’s Shanghai Index (SSEC) took it on the chin, down 3.1%, the Tokyo Nikkei Dow
(TKN) dropped 6.0%, while Hong Kong’s Hang Seng (HSI) fell 1.7%. The MSCI World Index fell 2.3%.
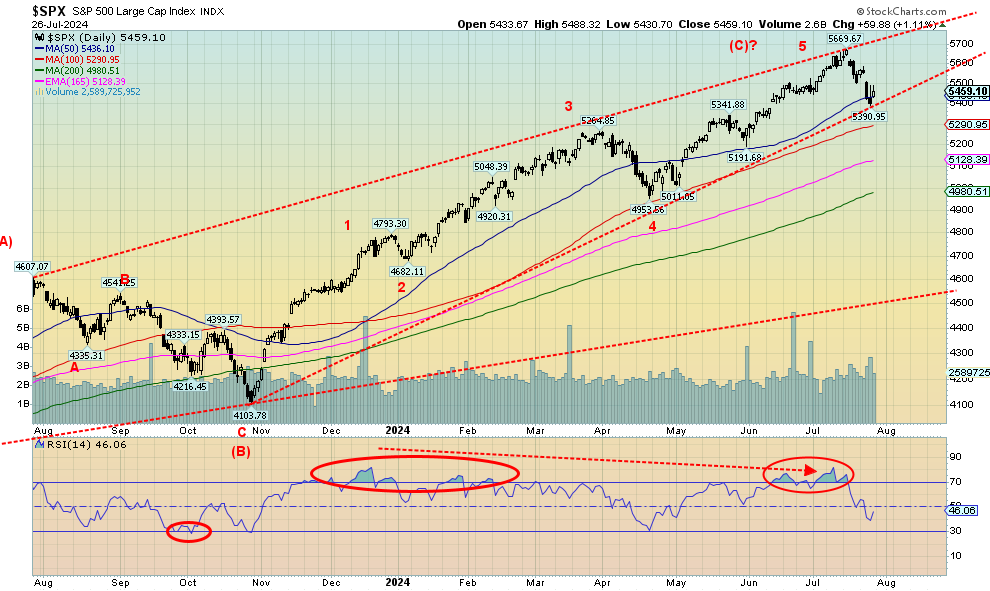
It was a very mixed week. However, our focus is the S&P 500 and the U.S. markets, where we see trouble brewing. Our dailies are giving sell signals with the weeklies not too far behind. The monthlies still need more work to drive them lower. 5,200 is support, then down to 4,900/5,000. The latter is around the 200-day MA, so a break under that level could signal the start of a bear market. For the moment, the DJI (and surprisingly the DJT) are benefitting. Right now, the S&P 500 would have to regain above 5,600 to suggest more new highs could lie ahead.
Interest rates fell this past week as inflation moderated. The U.S. 10-year treasury note fell 1.2% to 4.20%. The Canadian 10-year Government of Canada bond (CGB) dropped 2.1% to 3.35% as the Bank of Canada (BofC) cut rates 25 bp, as was widely expected. More interesting was that the 2–10 spreads narrowed further. The U.S. 2–10 is down to negative 20 bp while Canada’s 2–10 spread is negative 28 bp. Both fell on the week as the yield curve continues to normalize. As we begin to normalize, we know we are closer to the start of a recession. The fourth quarter could be the start of a recession.
U.S. 10-year Treasury Note, Canada 10-year bond CGB
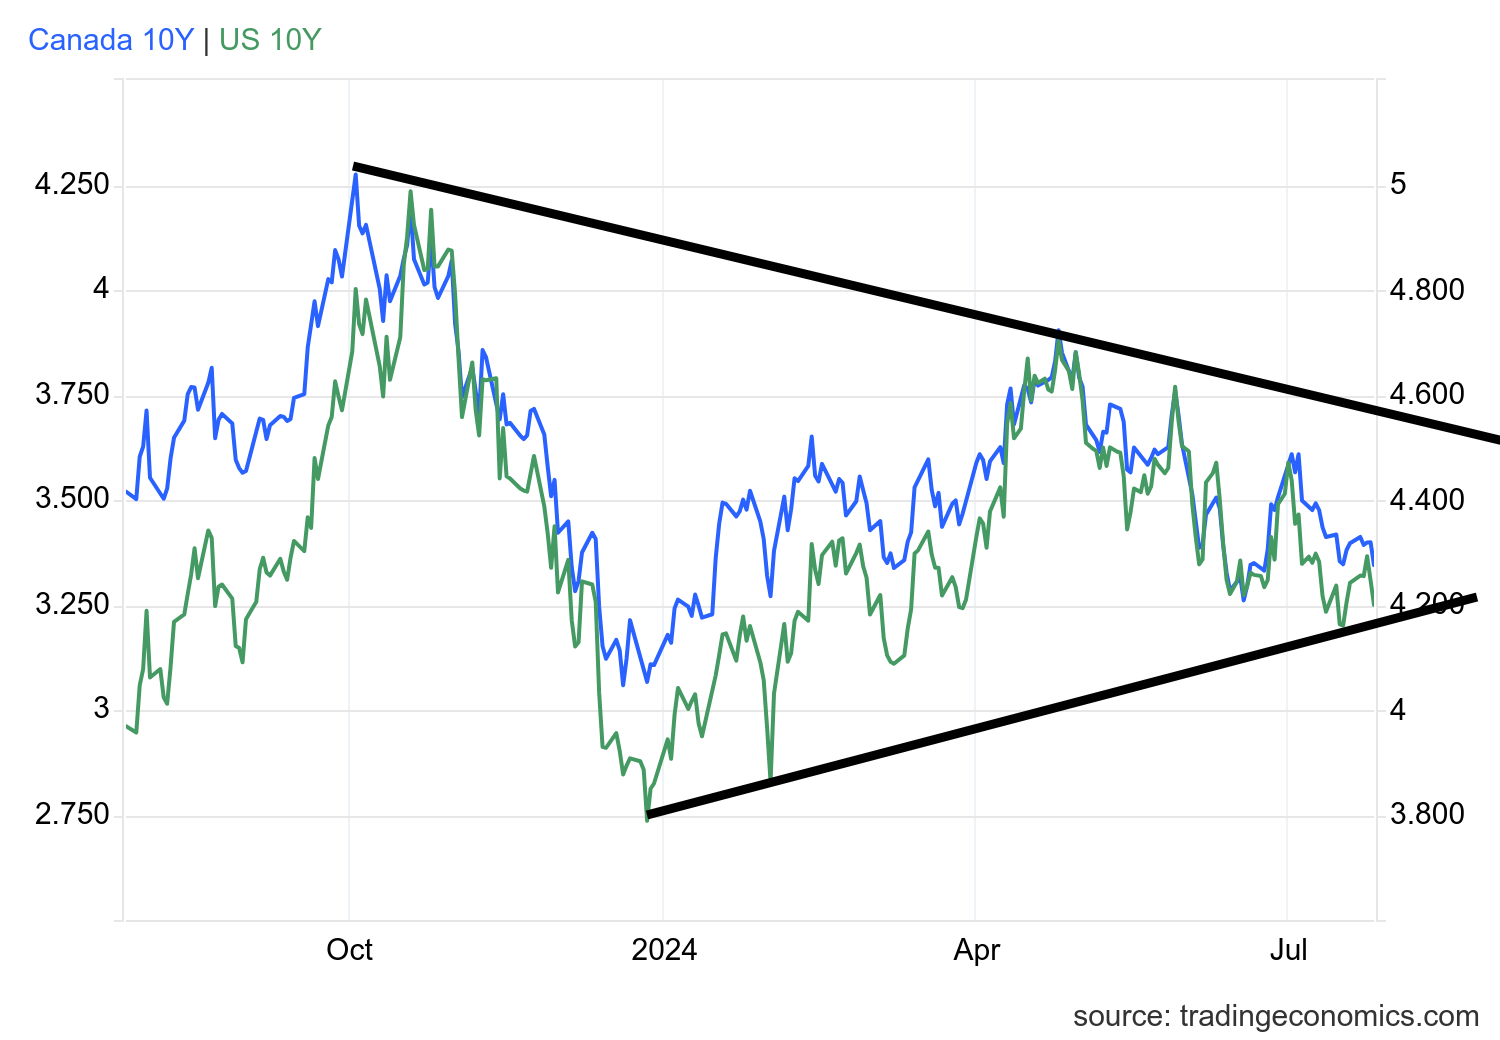
Source: www.tradingeconomics.com, www.home.treasury.gov, www.bankofcanada.ca
Source: www.stockcharts.com
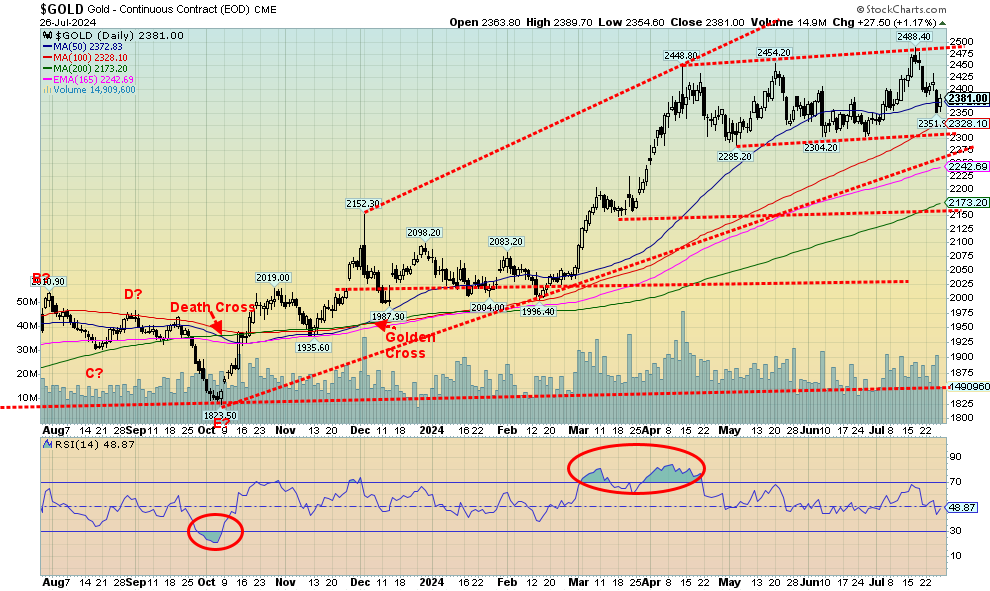
For the second consecutive week gold prices fell. We are now down over $100 from the all-time high set just seven days ago. We are holding above recent lows down near $2,300. On the week, gold fell 0.8%. But silver once again took it on the chin, falling 4.4%. Silver is still up 16.3% in 2024. Nonetheless, the weakness in silver suggests to us that this corrective period is not yet over. Silver fell to new lows for the current move, but gold did not. A potentially positive divergence? We’d actually prefer it the other way as strength in silver pulls gold higher.
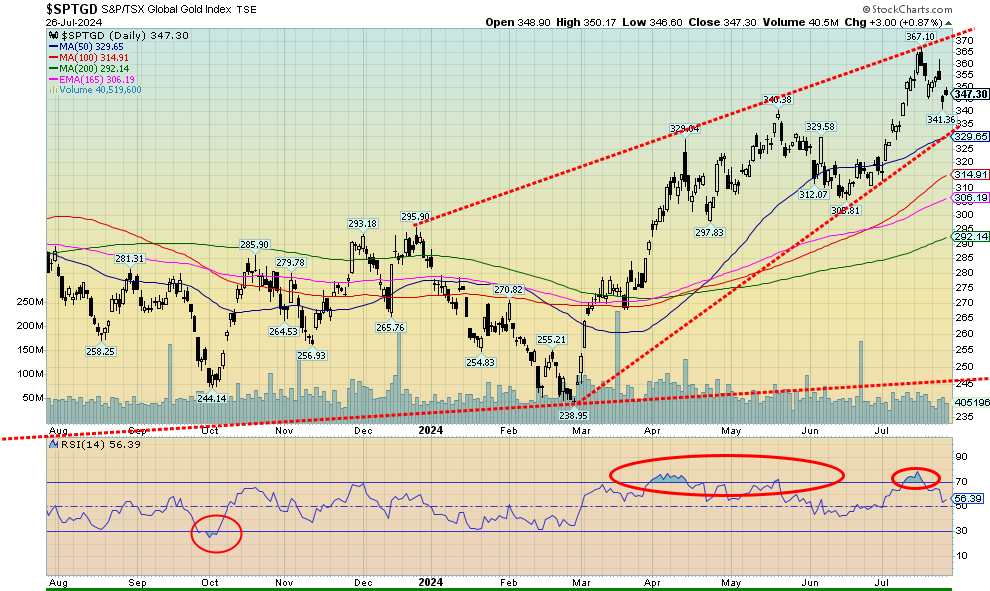
The rest of the precious metals market did not enjoy a good week, either. Platinum fell 3.0% and is now down 7.7% in 2024. Of the near precious metals, palladium fell 1.7% and copper dropped 2.8%. We continue to be positive on copper despite the drop we noted in our chart of the week. If there was a potential bright spot, it was the gold stocks. The Gold Bugs Index (HUI) fell 1.3% while the TSX Gold Index (TGD) dropped 1.1%. But both remain up 20%+ in 2024. With the gold stocks holding up so well, we view that as strength, suggesting to us this is just a correction and not the start of a bear market.
Despite the drop in gold, it responded positively to the PCE prices released on Friday. The PCE prices showed that inflation continues to moderate, even as it more or less remains above the Fed’s 2%. The Fed meets this coming week with the interest rate decision coming on Wednesday, July 31. It’s expected that the Fed will do nothing. Everyone is focused on the September meeting where it’s expected that the Fed will cut rates by at least 25 bp.
Many consider the Fed is behind because the BofC has already made two interest rate cuts. China recently cut rates as well. But that’s been about it. It is highly unlikely that the Fed would respond by knee jerk reaction to others cutting rates. The Fed makes their own decisions.
We learned that recently China slowed its gold purchases. We wouldn’t, however, read too much into that. It may just be a pause. China is the world’s largest gold producer. China continues to shed U.S. treasuries. The most recent figures available show that China sold off just over $2 billion in May. They are down about $78 billion year-over-year. But the world seems to be gradually shunning U.S. treasuries as total international holdings fell $19 billion in May and are down $8 billion over the past year. Doesn’t seem like much; however, the U.S. had to sell an additional $2.4 trillion in new debt this past year. Someone has to buy it. Most likely intra-government departments and some domestic holders like banks and insurance companies.
Gold’s pattern appears to us as a possible five-point reversal pattern. It comes in the form of ABCDE. If we are correct, this should be the E wave, the last one. Ideally, we’d like to see it hold above $2,300. After that low is found, we should resume the uptrend. We’ve been concerned about the poor performance of silver. However, we have to be pleased with the strong relative performance of the gold stocks. As you can see from the chart below, the TGD is holding up well with good support down to 330. We do keep reminding ourselves that the TGD is still down about 24% from its all-time high set in 2011. The HUI is worse, still down 54%. As we have pointed out many times, the gold stocks remain cheap relative to gold.
Source: www.stockcharts.com
Source: www.stockcharts.com
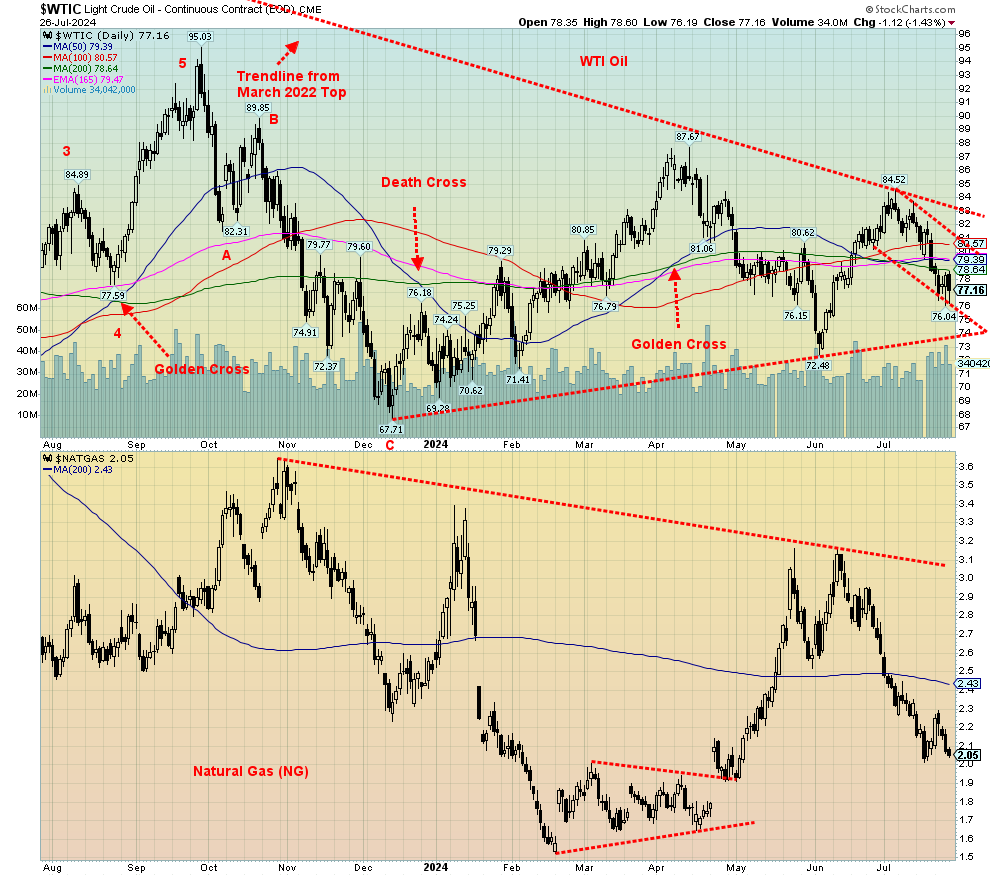
A quick word about oil. Oil remains volatile. The Chinese slowdown has everyone worried about falling Chinese demand. The tech sell-off this past week or two has everyone worried there will be a recession. However, U.S. GDP came in above expectations and the wildfires in Western Canada are having some negative impact on supply from Alberta. On the week, WTI oil was down 1.9% and Brent fell 2.8%. Natural gas (NG) at the Henry Hub fell 3.8% but rose slightly at the EU Dutch Hub, up 2.1%. Like the gold stocks, the energy stocks have generally been acting well. That suggests to us that once this correction period is over, we should resume the upward move. This past week the ARCA Oil & Gas Index (XOI) was flat while the TSX Energy Index (TEN) fell a small 0.2%.
Despite the drop in oil prices, we were pleased to see the energy stocks held in that continues to suggest to us that energy prices (oil and gas) could eventually resume their uptrends.
Copyright David Chapman 2024
GLOSSARY
Trends
Daily – Short-term trend (For swing traders)
Weekly – Intermediate-term trend (For long-term trend followers)
Monthly – Long-term secular trend (For long-term trend followers)
Up – The trend is up.
Down – The trend is down
Neutral – Indicators are mostly neutral. A trend change might be in the offing.
Weak – The trend is still up or down but it is weakening. It is also a sign that the trend might change.
Topping – Indicators are suggesting that while the trend remains up there are considerable signs that suggest that the market is topping.
Bottoming – Indicators are suggesting that while the trend is down there are considerable signs that suggest that the market is bottoming.
Disclaimer
David Chapman is not a registered advisory service and is not an exempt market dealer (EMD) nor a licensed financial advisor. He does not and cannot give individualised market advice. David Chapman has worked in the financial industry for over 40 years including large financial corporations, banks, and investment dealers. The information in this newsletter is intended only for informational and educational purposes. It should not be construed as an offer, a solicitation of an offer or sale of any security. Every effort is made to provide accurate and complete information. However, we cannot guarantee that there will be no errors. We make no claims, promises or guarantees about the accuracy, completeness, or adequacy of the contents of this commentary and expressly disclaim liability for errors and omissions in the contents of this commentary. David Chapman will always use his best efforts to ensure the accuracy and timeliness of all information. The reader assumes all risk when trading in securities and David Chapman advises consulting a licensed professional financial advisor or portfolio manager such as Enriched Investing Incorporated before proceeding with any trade or idea presented in this newsletter. David Chapman may own shares in companies mentioned in this newsletter. Before making an investment, prospective investors should review each security’s offering documents which summarize the objectives, fees, expenses and associated risks. David Chapman shares his ideas and opinions for informational and educational purposes only and expects the reader to perform due diligence before considering a position in any security. That includes consulting with your own licensed professional financial advisor such as Enriched Investing Incorporated. Performance is not guaranteed, values change frequently, and past performance may not be repeated.
About the author


Website: https://www.enrichedinvesting.com
Disclaimer: David Chapman is not a registered advisory service and is not an exempt market dealer (EMD) nor a licensed financial advisor. We do not and cannot give individualised market advice. David Chapman has worked in the financial industry for over 40 years including large financial corporations, banks, and investment dealers. The information in this newsletter is intended only for informational and educational purposes. It should not be considered a solicitation of an offer or sale of any security. The reader assumes all risk when trading in securities and David Chapman advises consulting a licensed professional financial advisor before proceeding with any trade or idea presented in this newsletter. David Chapman may own shares in companies mentioned in this newsletter. We share our ideas and opinions for informational and educational purposes only and expect the reader to perform due diligence before considering a position in any security. That includes consulting with your own licensed professional financial advisor.