In our post on February 10, 2022 “The Bank of England: There’s Only One Solution!” we wrote about the Bank of England governor’s solution to inflation was for workers to exercise ‘wage restraint’ when negotiating higher wages.
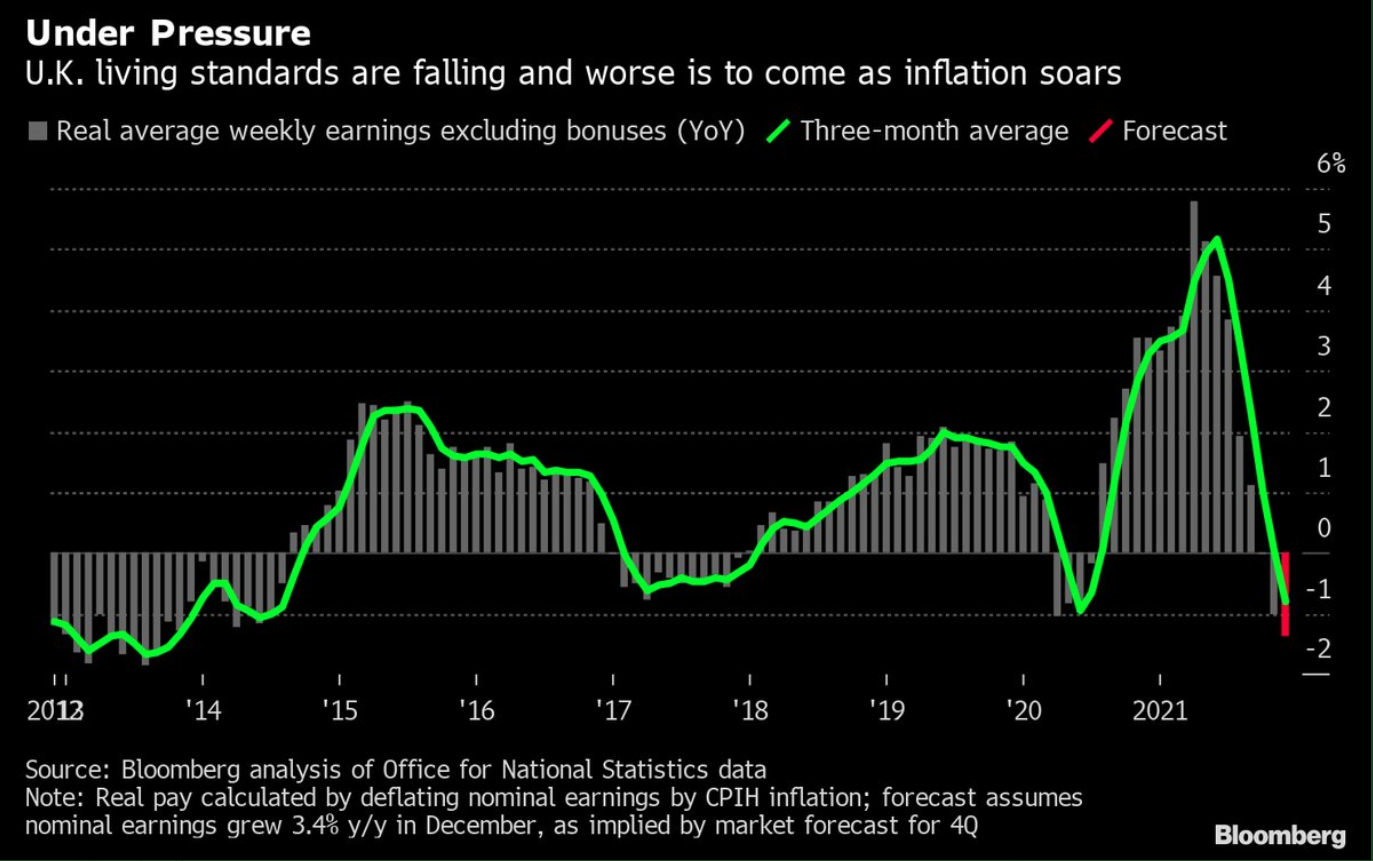
And this week we share the chart below from Bloomberg which sums up in one chart the truth about real wages and the decline of U.K. living standards.
It’s certainly not the workers that benefit from higher inflation!
 UK Living Standard Chart
Moreover, to get a handle on inflation the Bank of England Governor, and other central banks need to change their plea from employees to companies.
Are the Companies Taking Advantage of Inflation?
Meanwhile, companies are not only benefiting from higher inflation but boasting about it!
A February 7 headline from Reuters reads “Tyson Foods shares set a record as high meat prices fatten profits”. The article goes on to say that:
“Tyson Foods Inc (TSN.N) shares climbed more than 11% to an all-time high on Monday after the company reported that first-quarter profits nearly doubled due to soaring U.S. meat prices …
The average price for Tyson’s beef surged 31.7% in the quarter ended on Jan. 1, while the unit’s operating margins jumped to 19.1% from 13.2% a year ago.
Average prices for all of Tyson’s products climbed by 19.6% … Tyson said it raised meat prices to offset higher costs for labor, transportation and grains used for animal feed.
Its cost of goods rose by 18% in the quarter, and King told reporters he expects grain prices will continue to rise.
The bottom-line summary is that Tyson’s costs due to higher labor, transportation, and grain costs rose by 18%, but Tyson raised its prices to consumers on average 19.6%, and as high as 31.7%.
In other words, Tyson ‘padded the inflationary increase to increase its margins.
Grocery Stores Taking Advantage of Inflation
Tyson isn’t the only retailer ‘padding’ its cost increases. An article last year from CNN Business headline read
“Grocery stores are excited to charge you higher prices.” This article went on to say:
“The rising prices for staples like milk and pork affect grocery stores too, as they have to pay more to their suppliers.
But while they are raising prices under the guise of increasing supplier costs, they’re adding a little extra on top of that …
When grocery stores’ costs rise, stores will “mark up the full rate of inflation plus a little bit more,” said Burt Flickinger, the managing director of retail consultancy Strategic Resource Group.
For example, if the price of meat that a store pays to its suppliers goes up 6 cents a pound, the store might raise the price it charges for that same meat by 10 cents Inflation is the “greatest gift the supermarket sector could get,” said Flickinger. “They have not had these inflation benefits in years.”
The CEO of Kroger, a major U.S. grocery chain, told analysts on an earnings call that “our business operates the best when inflation is about 3% to 4%, A little bit of inflation is always good in our business.”
To add to this the CEO of Albertsons, another U.S. Grocery chain states
“customers will be able to afford higher prices because the economy is growing and consumers have cash to spend.
We’ve never had an environment like this with such a strong consumer where inflation goes higher.
And inflation will have to go really high for it to start mattering where the consumer starts clamping down on purchases.”
For their part, central banks are scrambling to tighten policy to try and stave off higher inflation.
With the probability of almost 60% that the Federal Reserve (the U.S. Central Bank) will raise rates 0.50% instead of only 0.25% (the other 40% probability) at its March 16 meeting.
With some Fed watchers calling for an ‘emergency’ interest rate increase before the next scheduled meeting.
Then for an additional 5-6 increases by 2022 yearend. A very aggressive rise in interest rates in other words.
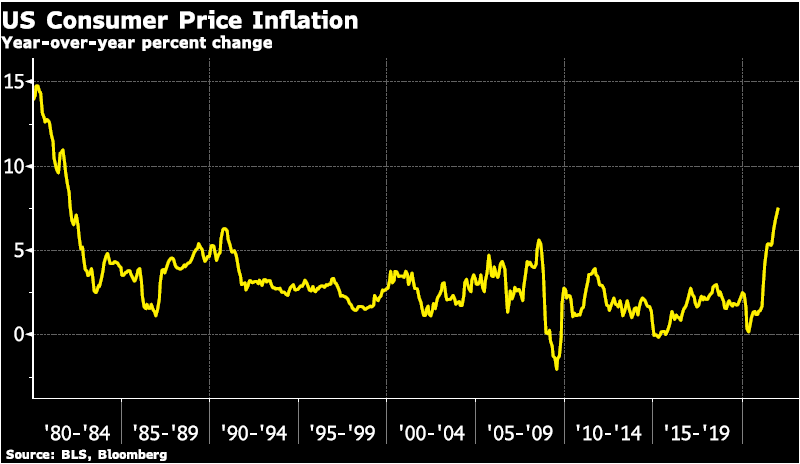
This higher probability of a ‘double increase’ came after U.S. Consumer Price Inflation (CPI) rose 7.5% in January – the highest yearly increase in 30 years.
 US Consumer Price Inflation Chart
Contributing to this 7.5% was rising oil and gas prices. This according to the CPI data release rose 40%+, and used cars and truck prices also rose 40%+ plus from the previous year.
New cars, meats, poultry, fish, and eggs all rose 10%+.
Also, most of the price increases can be attributed to oil price increases, computer chip shortages, and food commodity price increases. This brings us back to the ‘padding’ of price increases discussed above.
Additionally, the question is will central banks be able to raise rates as quickly as markets currently expect.
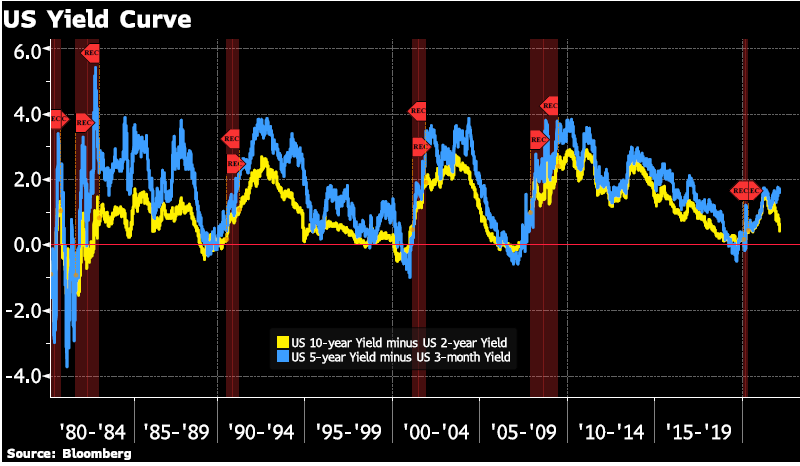
Also, one measure to garner longer-term economic growth expectations is the yield curve, which is longer term government bond yields minus shorter term government bond yields.
The chart below shows the U.S. 10-year bond yield minus the U.S. 2-year bond yield (yellow line) and the U.S. 10-year bond yield minus the U.S. 3-month Treasury yield.
The picture is a bit muddy at the moment with the spread of the 10-year minus 2-year turning down, but the spread of the 10-year minus the 3-month remaining elevated.
This measure is important because if the yield curve becomes inverted, meaning short-term rates are higher than long-term rates, history shows that a recession is soon to follow. Also, no central bank wants a recession, especially the US heading into mid-term elections!
 US Yield Curve
What Will Happen to Gold?
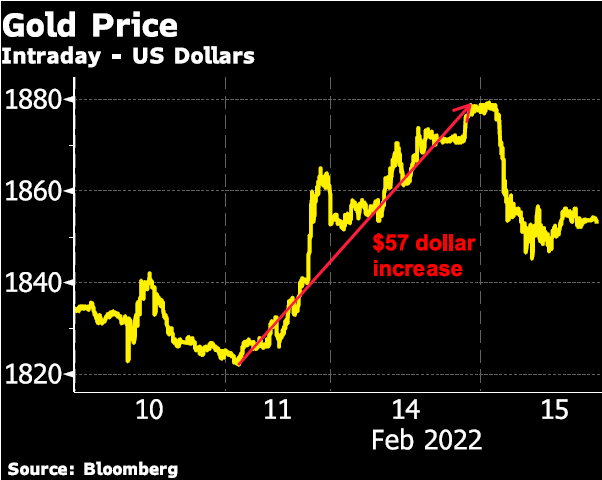
We would be amiss to not discuss the surge in the gold price on Friday (February 11) which continued Monday (February 14) of US$57.
Moreover, this surge was on the increased tension on the Russia/Ukraine border with Russia. These tensions eased somewhat on Tuesday and the gold price declined approximately US$30.
 Gold Price Chart
Looking at a longer-term picture of the gold price – the increase in the gold price hit the top of the 9-month trading range for the gold price but failed to breach it higher.
President Biden’s remarks on February 15 were that the United States is “not seeking direct confrontation with Russia” but that the U.S. and NATO are ready to respond decisively to a Russian attack on Ukraine, which remains very much a possibility”.
The two near-term catalysts that could likely push the gold price past the upper bound of the range are – escalated threats of a conflict with Russia and central banks, notably the Federal Reserve, raising interest rates at a slower trajectory than currently expected by the market.
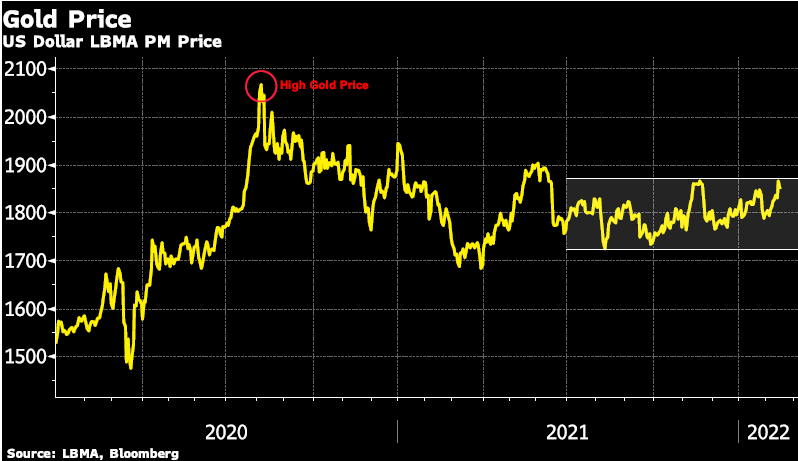 Gold Price: US Dollar LBMA PM Price Chart

GOLD PRICES (USD, GBP & EUR – AM/ PM LBMA Fix)
15-02-2022 1855.10 1848.55 1368.88 1370.33 1634.90 1632.27
14-02-2022 1855.80 1866.15 1372.55 1378.34 1640.90 1649.30
11-02-2022 1826.25 1831.15 1347.22 1349.01 1603.45 1607.75
10-02-2022 1832.30 1835.35 1350.22 1351.00 1602.35 1605.20
09-02-2022 1828.10 1827.80 1345.66 1347.82 1598.67 1598.41
08-02-2022 1821.00 1822.60 1344.63 1345.81 1595.56 1597.69
07-02-2022 1811.15 1813.55 1340.61 1340.76 1584.76 1585.59
04-02-2022 1814.55 1804.70 1338.23 1334.03 1582.11 1580.56
03-02-2022 1803.75 1792.70 1330.99 1318.71 1599.02 1573.09
02-02-2022 1802.00 1803.65 1330.42 1330.37 1594.23 1596.05
Buy gold coins and bars and store them in the safest vaults in Switzerland, London or Singapore with GoldCore.
Learn why Switzerland remains a safe-haven jurisdiction for owning precious metals. Access Our Most Popular Guide, the Essential Guide to Storing Gold in Switzerland here


