When you choose to invest in gold it can be confusing to know the best way to add it to your portfolio. Should you buy gold bullion? Should you buy a gold ETF? Or maybe gold mining shares?
It’s a minefield!
Here at GoldCore, we see it very simply: if you want to get all of the benefits of holding gold then you should own physical gold. Because if you can’t hold it then you don’t own it.
Never before has this philosophy been more pertinent than in the last few quarters. As more and more has come to light about how the paper gold market is managed. We summarise some recent changes below and highlight some significant imbalances.
The End of the Beginning: Paper Gold V/S Physical Gold
Has the ‘end of the beginning’ arrived for paper gold’s dominance over physical gold?
An overdue accounting change sheds a small beam of light on the holders of the Paper precious metal market. This shows once again that the paper market is not the same as the Physical metals market!
Even regulators are starting to realize that the counterparty risk involved in the paper gold market is not similar to holding physical gold. This was very apparent in the latest filing of bank activities in the US.
A short background is important here: Each U.S. commercial bank and savings association (with assets of more than US$5 billion). These are required to file a report with the Office of the Comptroller of the Currency (OCC) each quarter.
This report shows its trading and derivatives (financial contracts that value is based on the underlying security used to manage risk, speculation or leverage a position, examples are futures, option, and swap contracts) activities.
The OCC states its requirement of banks to report this data is to make many markets. This includes the paper gold market, more transparency, addressing infrastructure, clearing, and margining issues in the over-the-counter (OTC) derivatives market.
The first item we note in the report is that – in the first quarter of 2022 the report showed that there are more than 1,291 banks that reported in Q1.
However, the four largest commercial banks represent 89% of the total banking industry notional amounts and 69% of the industry net current credit exposure.
Yes – that is correct, the four banks do 89% of all trading and derivative activity by banks in the U.S. And almost 70% of the total market exposure is those same 4 banks!
The second item of note, and most important to gold and silver investors is the change in the way that gold and silver contracts have to be reported.
This change in reporting is in line with the change that was laid out in the Basel III accord of separating the way physical gold (they call it allocated gold) compared to Paper gold (they call it unallocated) is held on a bank’s balance sheet. For a refresher see our post from last July How will Basel III Impact the Gold Market?
The bottom line of the change is that the counterparty risk of the paper market is now being considered. Said another way – How much money is really on the line if it all goes south?
Precious Metals Contracts as an Exchange Rate Derivative
In other words, as we have stated many times, if you or Goldcore don’t hold the physical gold then you don’t own it and there is too much counterparty risk!
Previous to January 1, 2022 banks could state their precious metals contracts as an exchange rate derivative. However, starting January 1, 2022 banks are now required to calculate their precious metal contacts using the “Standardized Approach for Counterparty Credit Risk”.
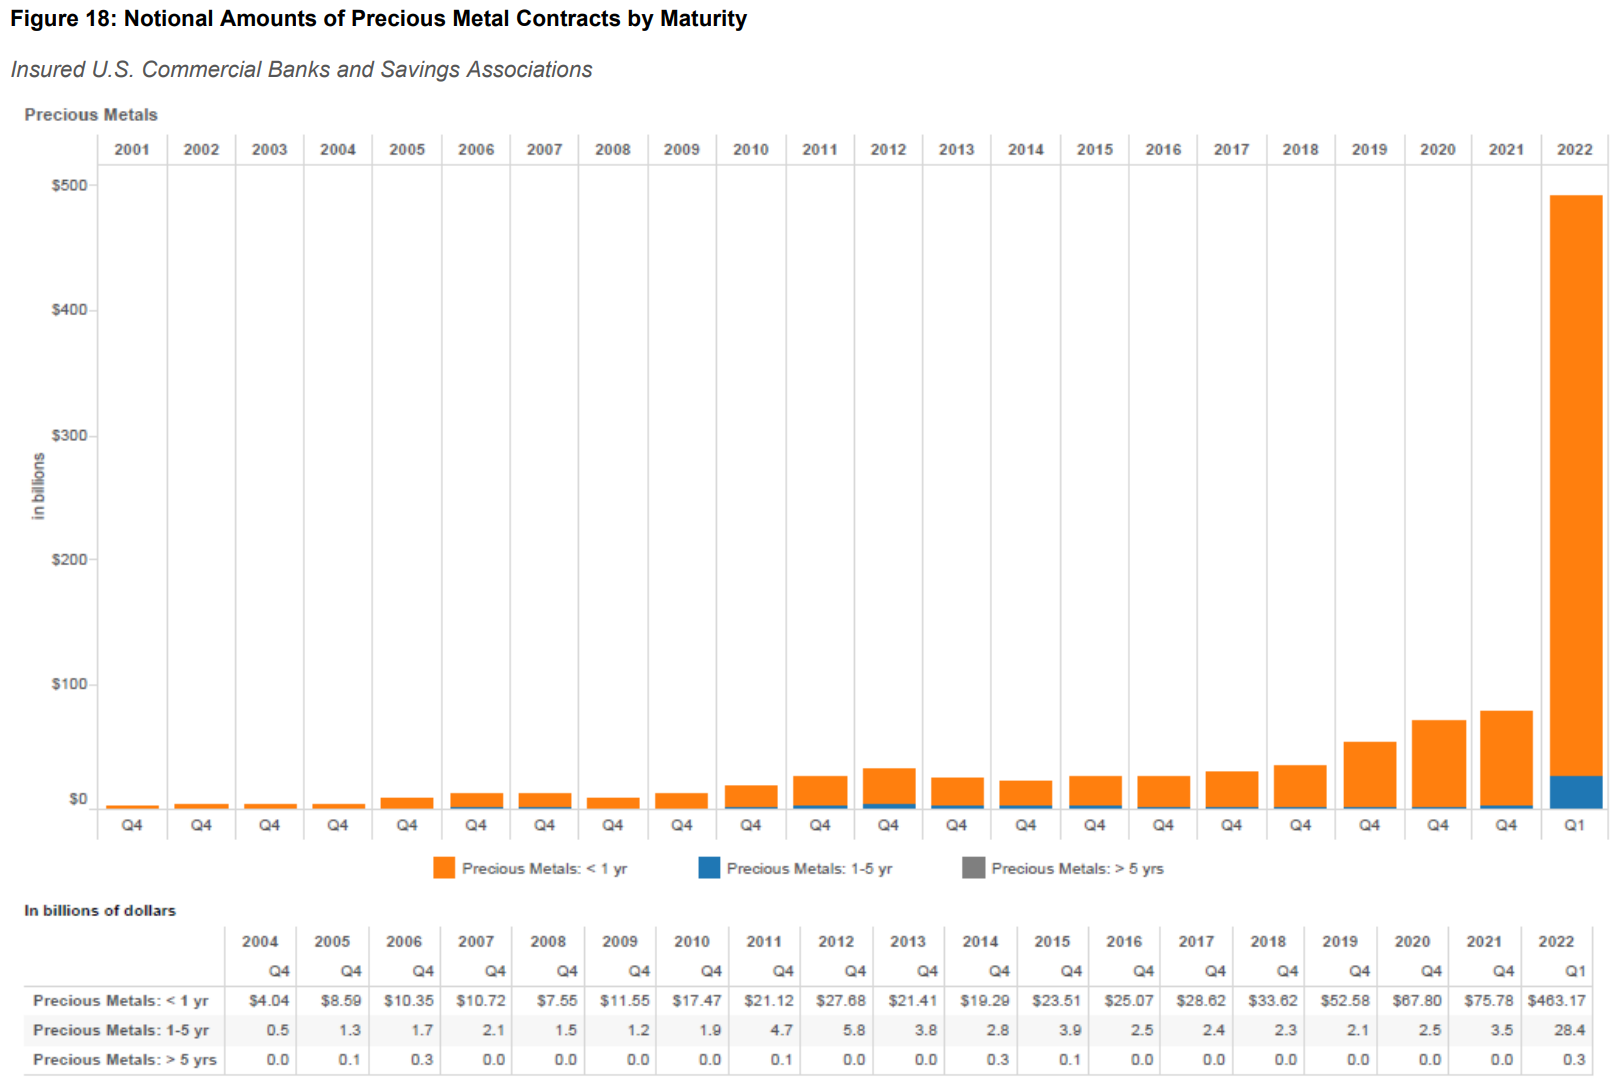
Below is the chart from the very back of the OCC report showing the resulting difference in exposure reported. The amount went from US$79 billion in Q4-2021 to US$492 billion in Q1-2022!

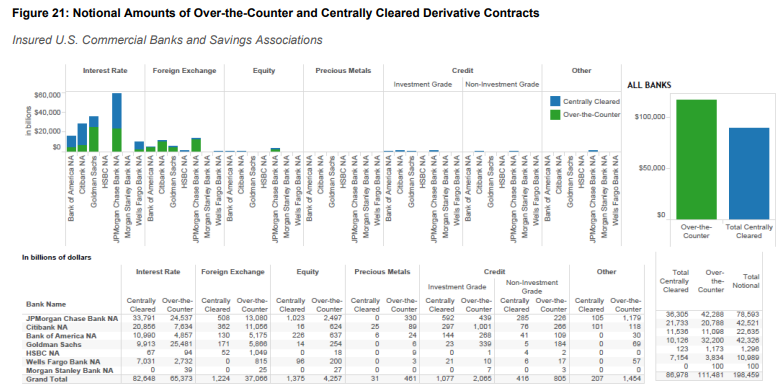
This change also moved contracts hiding in other places to the precious metal contracts bucket. Moreover, the chart below shows the seven U.S. banks’ with the largest derivative contract holdings.
And guess which bank controls the most precious metal contracts …. None other than JPMorgan Chase, second is Citibank.
The change in accounting moved JP Morgan’s precious metal contracts from US$28 billion in Q4 of last year to US$330 billion in Q1-2022 and Citibank’s precious metal contracts from US$6 billion to US$89 billion. These two banks control 90% of the U.S. bank precious metals derivative market!

Moreover, it’s no coincidence that it is JP Morgan Chase traders on trial for manipulation of the gold market. See Gold Traders on Trial: Only Buy Physical.
Changes in Basel III prompted this change. This is to keep European banks and US banks from arbitraging across the Atlantic. Also, the case is strengthened by the sanctions against Russia that increases counterparty risk.
However, it only offers a glimpse into the behind-the-scenes positions of large banks. This is only a glimpse – the main act and true extent of both the manipulation and control by a small few is yet to be fully revealed.
And we leave the final thought as a question: Is it any coincidence that the largest U.S. bank derivative holders are also primary dealers of the Federal Reserve?
Whilst we’ve got your attention do you fancy dragging out this coffee break some more and watching some top chat about gold, silver and markets?
Our new show The M3 Report is now on its second episode and well worth checking out, if you haven’t already. Featuring Marc Faber and a new feature, Trading Places where we asked six experts what they would do if they were in Jerome Powell’s shoes. (No one said they liked the look of his shoes!).
Buy Gold Coins

GOLD PRICES (USD, GBP & EUR – AM/ PM LBMA Fix)
20-07-2022 1712.65 1709.30 1423.90 1426.41 1671.89 1672.89
19-07-2022 1712.95 1713.05 1426.37 1425.77 1674.58 1673.14
18-07-2022 1723.65 1719.05 1442.01 1432.48 1699.00 1692.40
15-07-2022 1702.55 1706.15 1439.85 1438.63 1696.08 1693.87
14-07-2022 1716.15 1700.70 1447.06 1441.51 1710.66 1705.46
13-07-2022 1728.90 1724.60 1454.70 1452.63 1723.02 1718.56
12-07-2022 1734.35 1730.70 1466.39 1457.60 1733.66 1722.05
11-07-2022 1737.40 1740.00 1452.99 1462.82 1717.25 1728.34
08-07-2022 1737.05 1738.20 1454.08 1451.57 1717.42 1714.56
07-07-2022 1743.45 1747.95 1455.96 1456.04 1711.20 1716.84
Buy gold coins and bars and store them in the safest vaults in Switzerland, London or Singapore with GoldCore.


