
- How do investors view yesterday’s wild metals market action? That depends on whether they live in the West or the East.
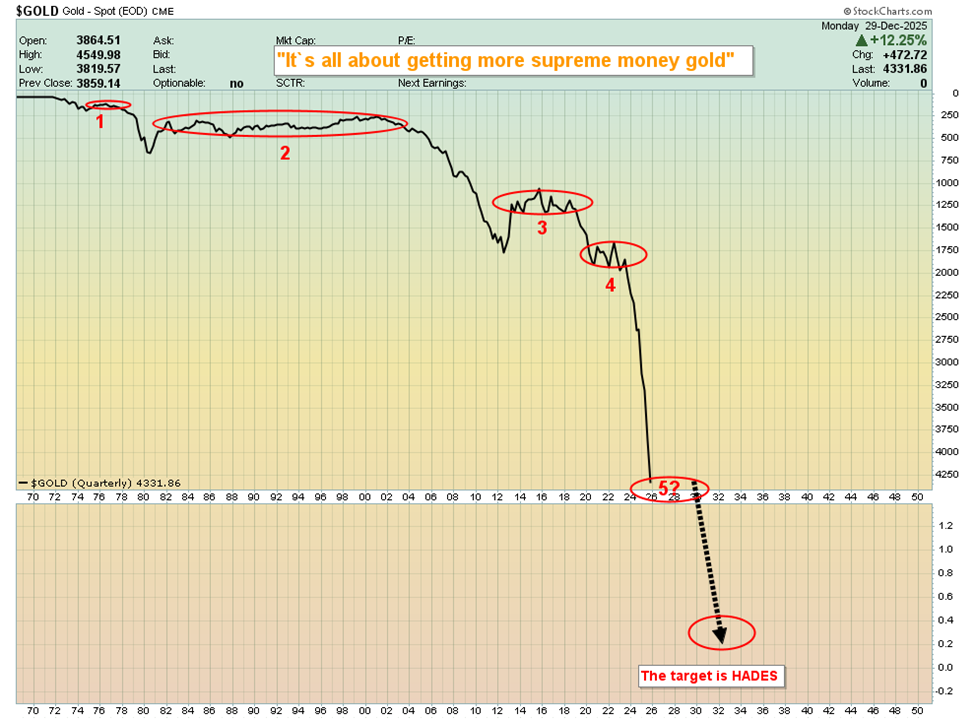 In the West, it’s all about getting more fiat and trying to make it great.
- In the East, the big focus is on getting more gold.
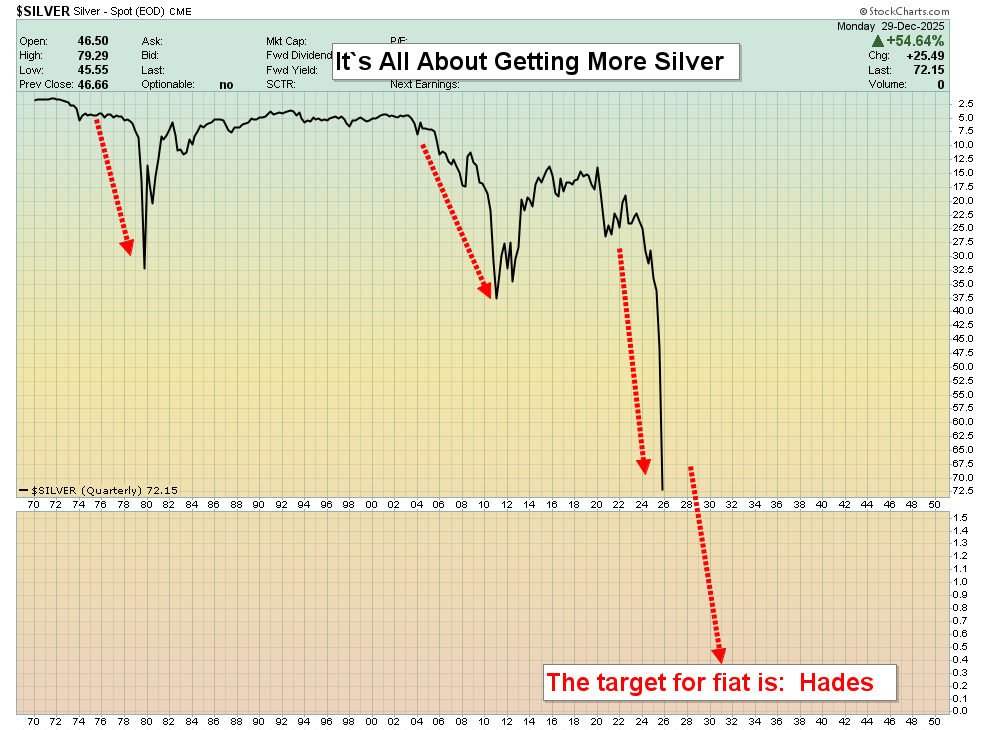
- Please click here now. Double-click to enlarge. The situation is the same for silver as it is for gold.
- Can fiat rally against these metals now? It can and savvy currency bugs will use the rally to get more metal.
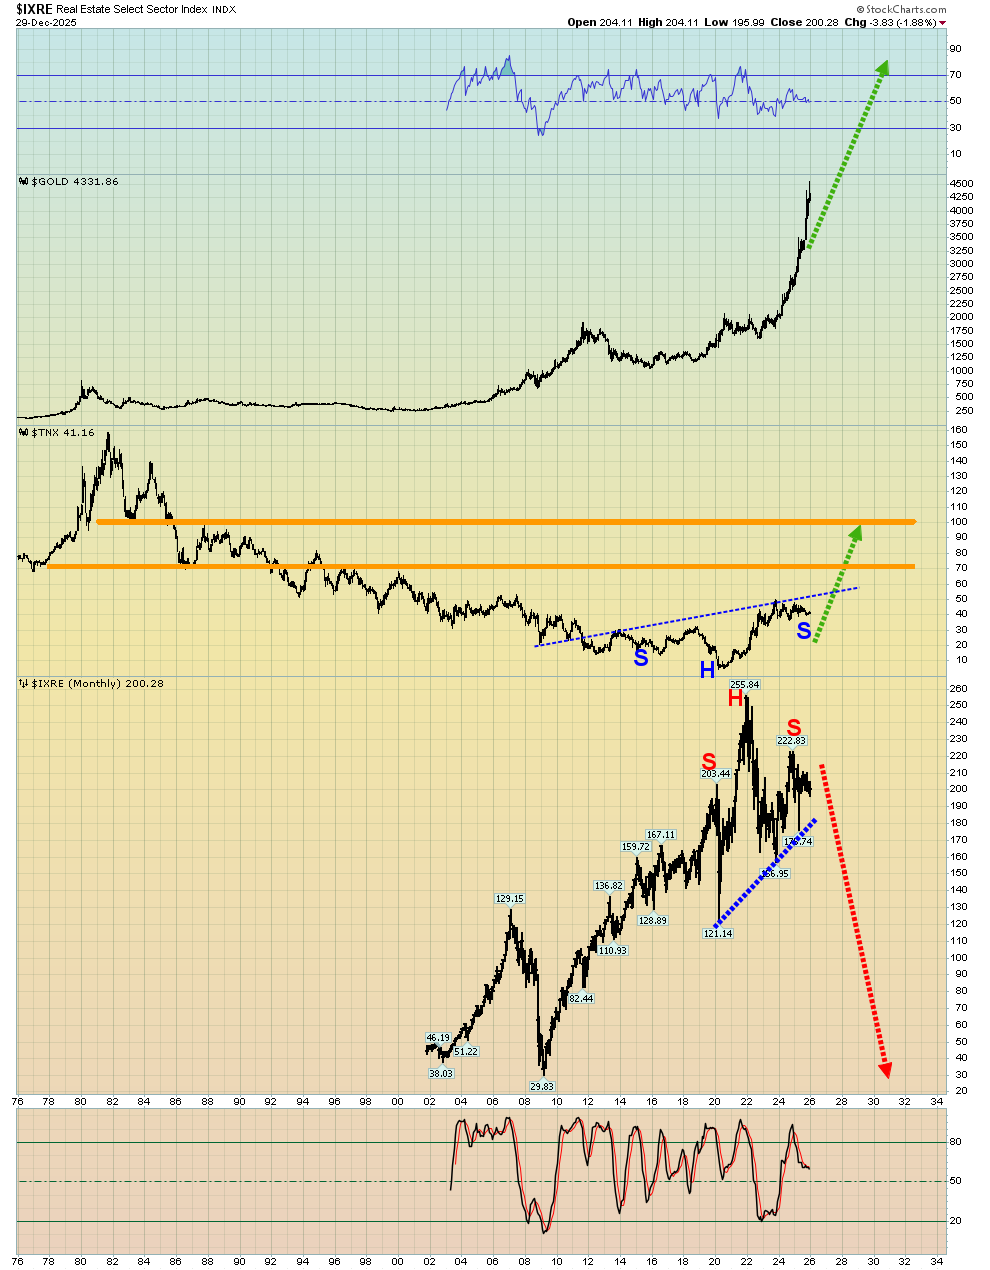
- What about rates? Please click here now. Double-click to enlarge this US rates and real estate chart. Most gold analysts believe that if inflation surges now, the Fed can’t raise rates like it did in the 1970s because the debt situation is so much worse.
- Unfortunately, history begs to differ. Governments will fight hard to avoid reducing spending but eventually they must do it, or rates will surge.
- If the mid-term elections are a flop for President Donnie (and current polls suggest that will be the case), the debt-loving democrats will have a big say in how much more fiat the government recklessly spends than it’s spending now. In a very exciting nutshell:
- The door will then be wide open for the next leg higher for US government bond rates and if it happens… institutional investors will balk at the rates offered to them. To get them interested, rates would have to rise and probably quite significantly.
- Gold surged against fiat during the last hiking cycle, and it’s likely to surge even more this time… probably towards the $10,000 area.
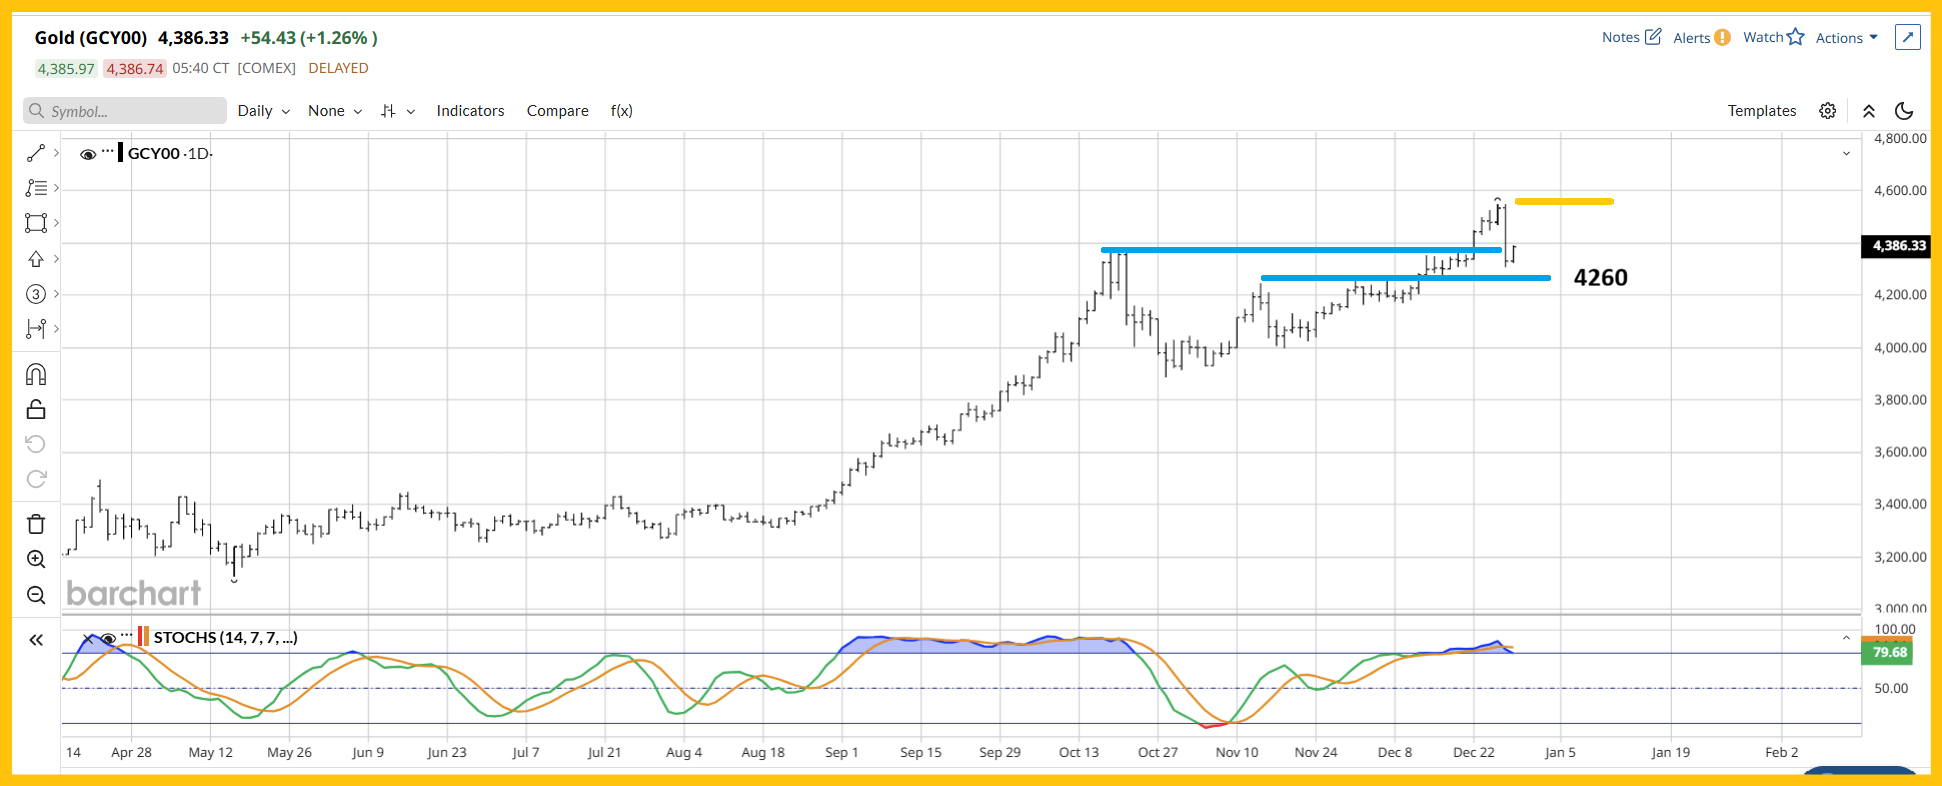
- Please click here now. Double-click to enlarge. The wild action in the metals is being created by the battle of the technical bears versus the fundamental bulls.
- The bears are focused on the overbought situation of gold and supposed parabolic price action of the white metals (silver, platinum, and palladium).
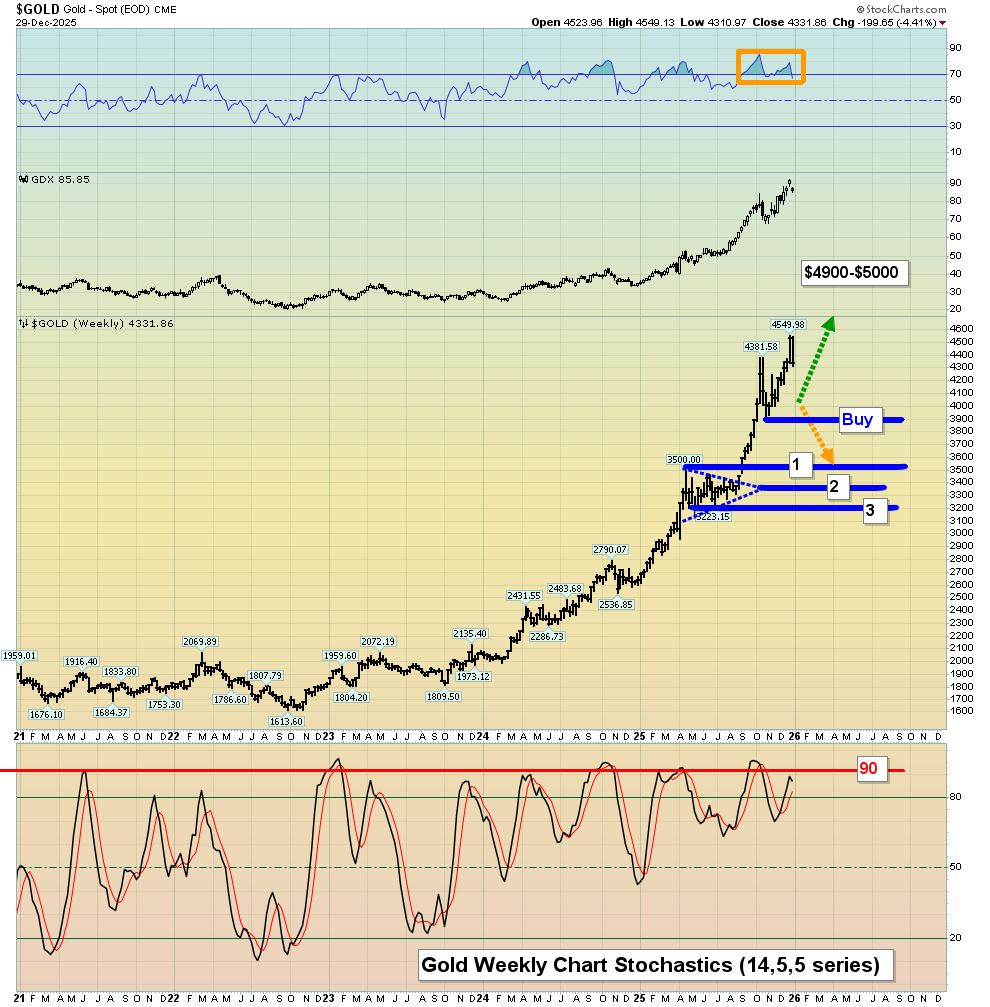
- For gold in the near term, there’s modest support around $4400, $4350, and $4260. It’s possible that all that’s happening now is a margin-induced shake-out.
- Regardless of whether there’s a deeper pullback now or not until my April timeframe, that pullback should be used as it is in the East… to get more gold.
- To view the weekly chart, please click here now. Double-click to enlarge. Most Western gold bugs are obsessed with what’s potentially next for the price, but to really do well with gold, the key is to lay out buy zones on the weekly chart… and not worry about whether the price is going there or not.
- The US Department of War has nuclear weapons in case there is a war, not because they predict one will occur. Savvy gold bugs need to act the same way; $3900 (or round number $4000) and $3500 are big zones to buy with size… if the price goes there.
- If an investor is prepped to take action at these buy zones, they are in great (and arguably perfect) shape.
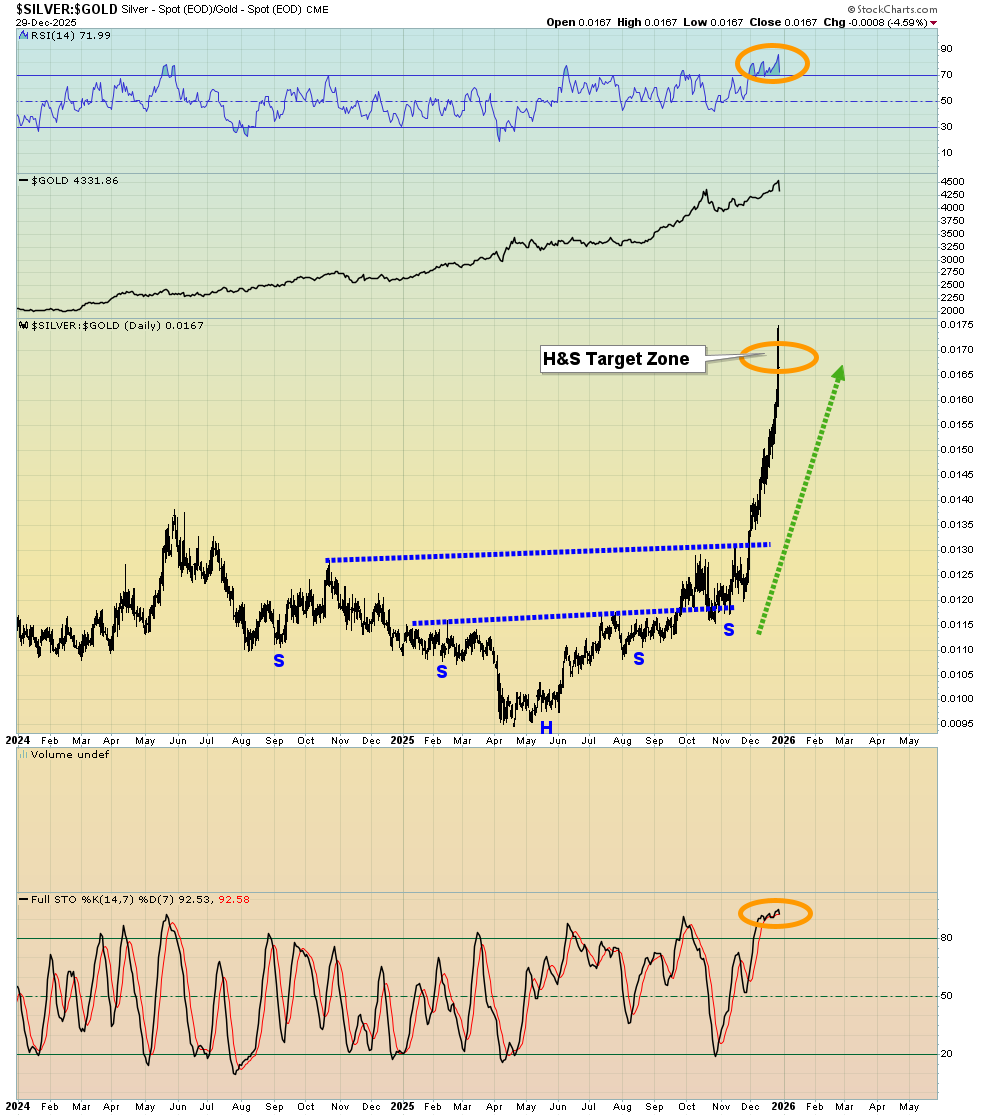
- Silver? For a look at the supposed silver price parabola, please click here now. When priced in supreme currency gold, there has been some powerful upside action for silver… expected action; the inverse H&S bottom projected the current move and now silver is in the target zone.
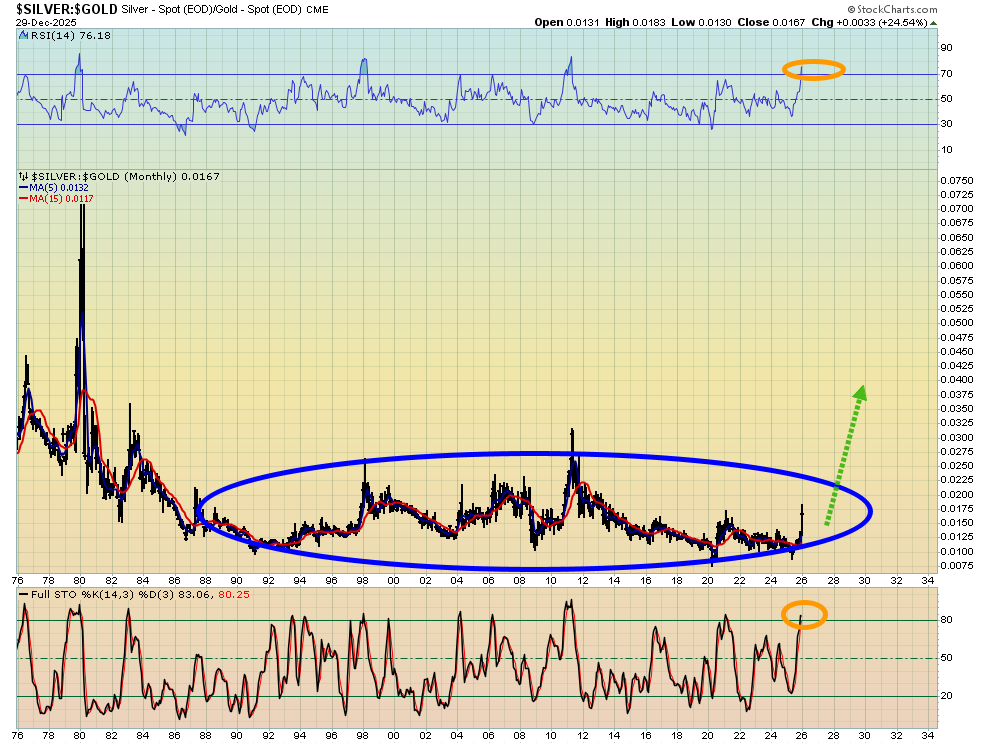
- For a look at the long-term chart, please click here now. Double-click to enlarge. Against failed fiat, there might be parabolic action, but that should be largely irrelevant to any serious silver bug. Against gold, silver is in a huge base pattern that projects years (and perhaps decades) of great bullish action to come. Dips need to be bought.
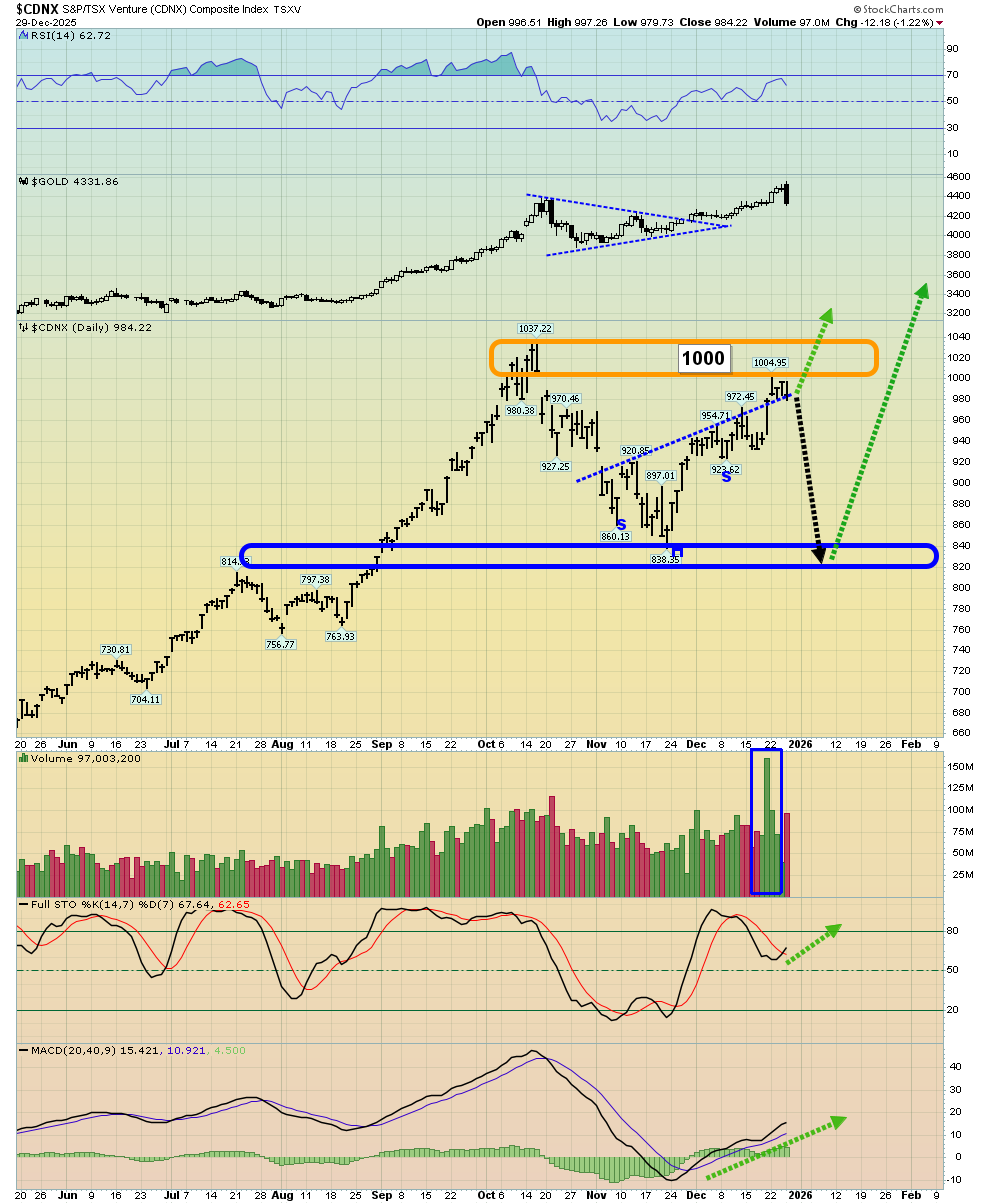
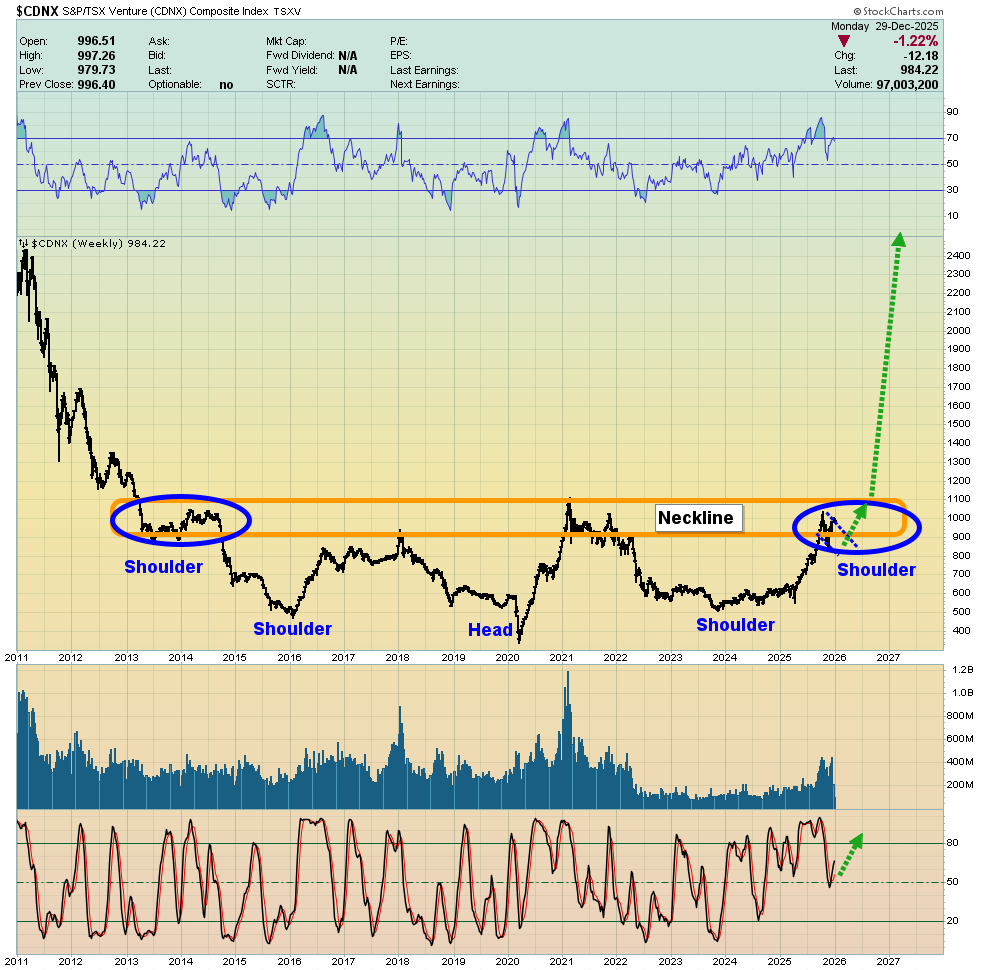
- What about the miners? Please click here now. Double-click to enlarge. While gold, silver, and senior miners took a significant hit yesterday, the CDNX was barely down!
- Please click here now. Double-click to enlarge this long-term chart. Additional symmetry has been added to the chart with a new right shoulder. The massive inverse H&S pattern suggests decades of upside action lie ahead for all mining stock enthusiasts.
- Junior mine stock investing isn’t for everyone, especially with size, but as this gargantuan gold bull era rollout continues, these miners look set to outperform everything! At $199/year, my junior resource stocks newsletter is an investor favourite, and I’m doing a special pricing this week of $169 for 14mths! Send me an email or click this link if you want the special offer and I’ll get you onboard. Thanks!
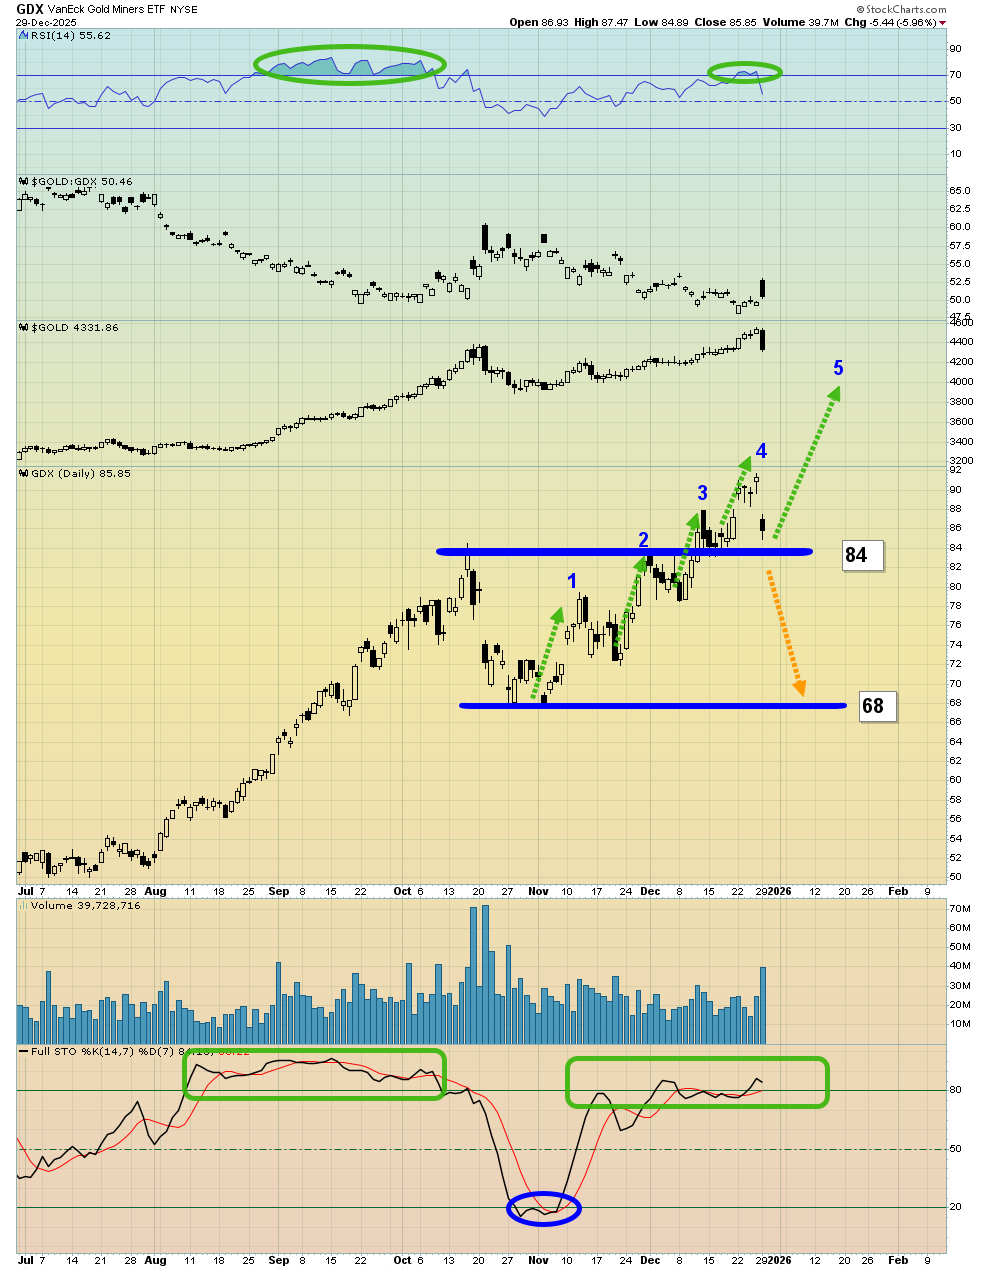
- For a look at the seniors, via GDX, please click here now. Double-click to enlarge this stunning daily chart. Rather than a “top”, there could a fifth minor wave higher… and it would be the biggest of the five, potentially taking GDX to $100!
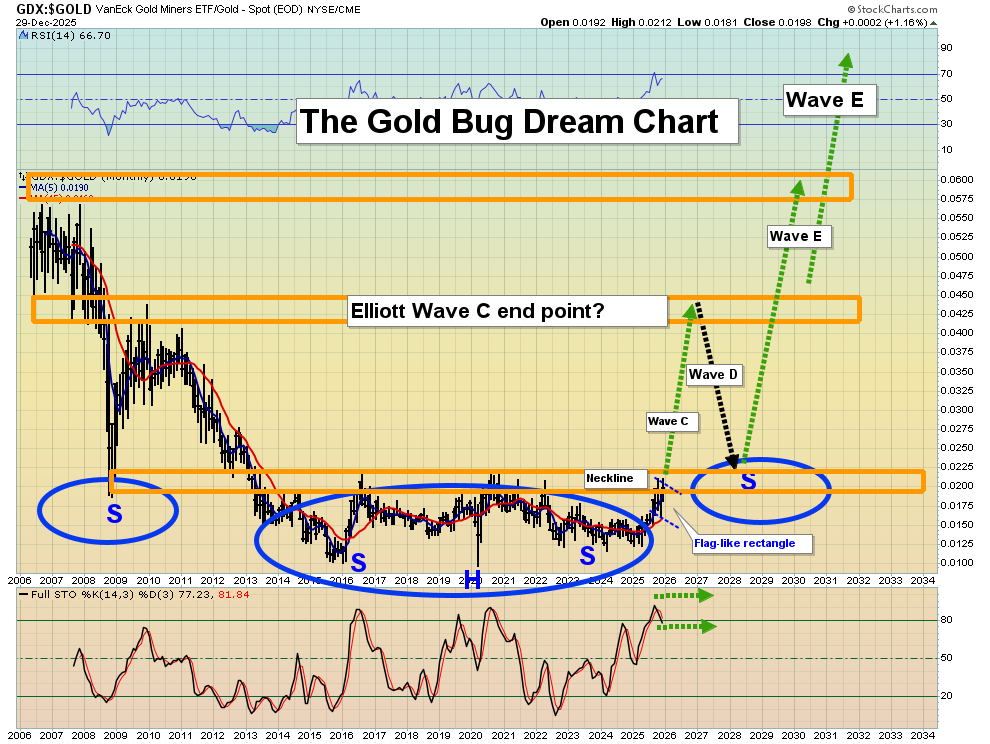
- Please click here now. Double-click to enlarge this phenomenal long-term chart of GDX versus gold. A flag-like drifting rectangle has appeared on the chart. When the breakout over the neckline does occur, investors need to open to GDX hitting a fiat price of $200 and more. The bottom line: It’s going to be a golden 2026… especially for the miners!
Special Offer For Website Readers: Please send me an Email to freereports@galacticupdates.com and I’ll send you my free “Hi Ho Silver Stocks!” report. I highlight some of the hottest sub $1 junior silver miners, with buy and sell tactics included in the report!
Thanks!
Cheers
About the author
