Gold has rallied to a four-month high – rising in US dollar terms by $100 in the first 18 days of May, and more than $200 since the low this year set on March 30th. On a technical positive gold moved decisively above its 200-day moving average! The decline in the US dollar is one of the reasons behind the recent rally in gold. But as the chart below shows gold is also rallying in other currencies as well. This rally in gold has three key factors that will support it further.
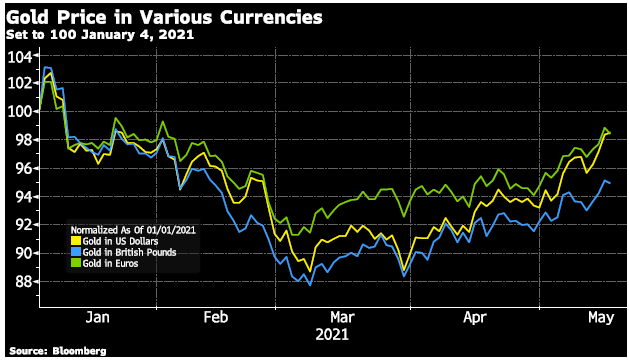 Gold Price in Various Currencies Chart
The first is the rise in inflation expectations. The breakeven rate, the difference between the nominal bond yield and the Treasury Inflation Protected Security yield for the same duration, is one widely used indicator of inflation expectations. The chart below shows that the US 2-year breakeven rate has increased to the highest level. Since before Lehman Brother’s failed in September 2008, arguably the catalyst to the worse part of the Great Financial Crisis.
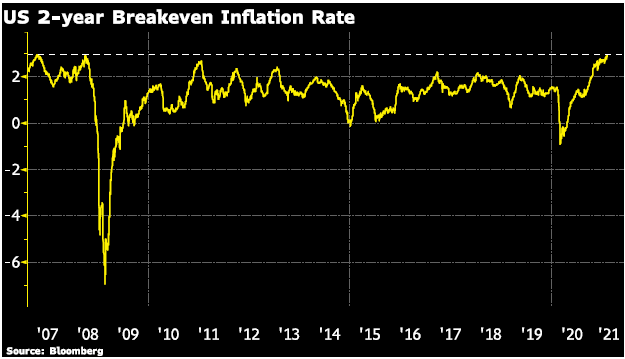 US 2- year Breakeven Inflation Rate Chart
Inflation is Here!
Coupled with the higher inflation expectations is central banks commitment, namely the Fed, to hold interest rates at low levels. Until the temporary and base-effects of the inflation data works out of the ‘actual inflation’ readings. This policy is markedly different than before when the Fed and other central banks relied more on inflation expectations than waiting for the actual data to meet, or in the case of the Fed rise ‘slightly’ above, their 2% goal.
Remember, it takes monetary policy between 4 to 6 quarters to work through the economy – so if they wait until ‘permanent’ inflation takes hold it could prove challenging to maintain inflation around 2% before it shoots higher. Debasing the US dollar further along the way.
Equity Markets on the Edge
The second reason gold is set to rally is that equity markets are on edge, and pulling back from recent highs and bonds are increasingly expensive. Not to mention the pullback in bitcoin, which stole some of the shine from gold in the first quarter of 2021. Gold is relatively cheap compared to other assets, such as stocks and bonds.
The chart below shows the ratio of the gold price to the S&P 500 as an example of the historical relationship between the two assets over the last 40 years. During the run up to the dot.com bubble in the late 1990s, the gold/S&P 500 ratio was lower. The equity market bubble burst in 2000, gold started its bull market run soon after!
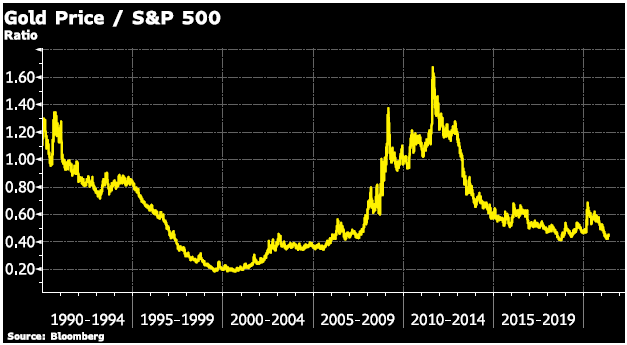 Gold Price/ S&P 500 Chart
Gold (and silver) have indeed underperformed equity markets since the beginning of 2021. The historical relationship of gold with equity markets shows that gold and equity markets often do not move in the same direction in the long-run, which is what makes gold such a great portfolio diversifier – or insurance against equity market declines!
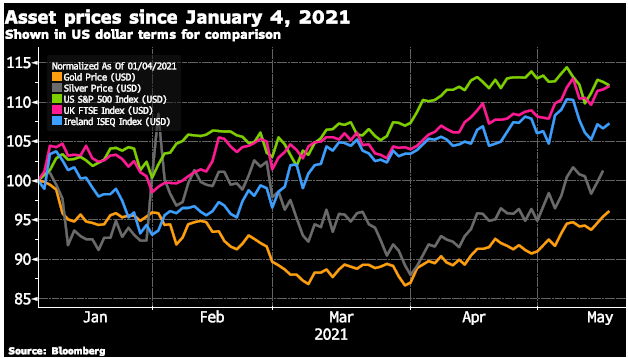 Asset prices shown in US dollar terms for comparison
Rising Commodity Prices
The third reason the rally in gold is likely to move higher is the historic relationship with other commodity prices, namely energy and base metals. Gold (and silver) have also lagged these commodities and are ‘relatively inexpensive’ in comparison. Plus, the continued climb in these commodity prices also contributes to higher inflation expectations, which brings us full circle back to point one!
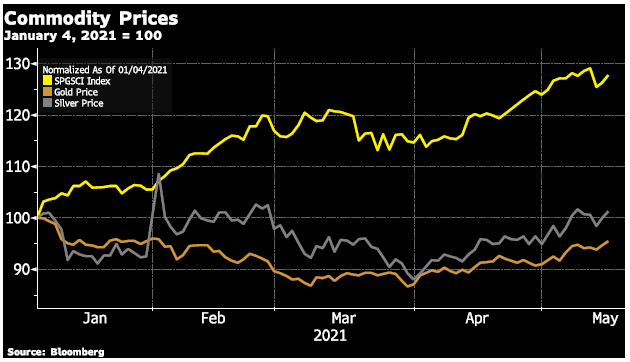 Commodity, Gold and Silver Prices Chart
Learn why Switzerland remains a safe-haven jurisdiction for owning precious metals. Access Our Most Popular Guide, the Essential Guide to Storing Gold in Switzerland here


