
If I had to distill the stock market down to two primary words, I would likely choose “emotion” and “risk.”
Whenever you approach the market, one of the main factors which should drive any decision you make is the question of how much risk you want to take at any given time. Is the market in a posture where it is reasonable to take more risk? Or is the market in a posture where you want to reduce your risk until it clarifies its intention? Moreover, there are other factors which are taken into account in this determination, such as your age, comfort level, goals, and time until retirement.
Furthermore, one of the most difficult aspects of trading or investing is being able to manage your emotions. When everyone around you becomes emotional (whether that means overly bullish or overly bearish), you have to learn to tune that out and be able to conduct your analysis of the market with as little emotion as humanly possible.
With these two perspectives in mind, let’s discuss how you should approach these two concepts within our current market environment.
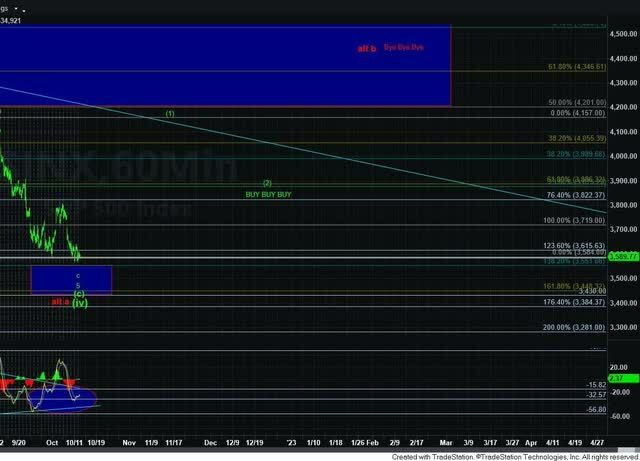
I have attached the chart we were using in real time back in October when the market was overly bearish.
Elliottwavetrader.net
As you can see, we were expecting a bottom in the market, with a further expectation of a rally that would first take us to the 4150/4200SPX region, followed by a pullback towards the 3800/3900 region, ultimately taking us back up towards the 4300+ region. And, that is exactly what we have seen ever since we caught the bottom back in October. But you had to fight your emotions to be able to see this potential at that time.
As one of my members noted:
“Slowly but surely i've become less and less concerned/interested in seeing if other factors align with waves (fundies/techs), and becoming more absorbed simply into the waves. It's been hard, as it's human nature to try to correlate just about anything. When I just follow directions/waves, my success is as good or better than Avi's noted 70% rate.”
Yet, when I published my perspective about my target many months ago, this comment I received seems to represent the general comments I received from many readers:
“4300 is not happening”
Yet, here we are.
Also, a number of months ago, I outlined my ideal target for this rally to the members of ElliottWaveTrader. And, my current assumption is that we will likely strike that target within the next few weeks.
As we are approaching our target for this rally, it seems that many in the media and investing community are now turning quite bullish. In fact, with the market now rallying 20% off the October lows, many are declaring the end to the bear market and proclaiming the start of a new bull market.
First, I want to address this 20% mark for determination of market context. It is a completely nonsensical, contrived and arbitrary mark, which has no support in historical market context. A number of years ago, I wrote an article discussion this perspective, and you can choose to read it here:
Sentiment Speaks: Watch Out For The 'Bear Market'
But I digress. The point is that I am not quite as confident that a bull market has begun, and I am certainly paying no heed to the 20% arbitrary perspective. But, if you have been following my analysis these last few months, you would know that I am keeping an open mind as to whether we still can rally over 5000SPX, especially since the top struck at the end of 2021 has left a lot to be desired as a completed bull market structure, (which I have explained in prior articles).
Therefore, with emotion now seemingly turning quite bullish, I am going to ask you to strongly consider how much risk you want to take as we look towards the next few months. You see, in my primary perspective in the SPX, the market is likely going to complete a rally structure over the coming weeks. Moreover, should the market begin a decline in an impulsive fashion after we complete this rally, we may be starting a decline that can point us down to the 2700-2900SPX region. While this may seem unlikely to the many who are proclaiming the start of a new bull market, this potential has been on our radar for many months.
Of course, if the market is able to decline in a corrective fashion, then I would be looking up next to the 4500-4600SPX region, with potential to even rally up to the 5000+ region over the coming year or two. Again, I am keeping an open mind and allowing the market action to direct me over the coming months.
However, at this point in time, we are facing a significant amount of uncertainty. The S&P 500 has been rallying in a very corrective looking fashion, and strongly supports the potential that we will likely be topping in the coming weeks. Yet, there are some charts that suggest we can go much higher, such as the DOW and a few other charts. And, even so, when I spoke to Zac Mannes, who runs our Stockwaves service, he noted that most of the DOW individual charts do not really support the bullish structure being displayed by the DOW itself, which adds to the uncertainty of the region within which we now find ourselves.
To add further to the uncertainty, most of the stocks we track seem to align with a near-term topping structure, and a larger decline to follow. Yet, there are a number of stocks that are still pointing higher over the coming weeks (as outlined in our Stockwaves service), which may be what continues to keep us pushing towards the upper end of our target zone, and maybe even a bit past it.
If you have been following our work since October, then you have enjoyed some nice gains since we caught the bottom of this 20% rally. But, the most important question you are going to have to ask yourself right now is how much risk do you want to take as we are now approaching our target zone set out many months ago? And, to be honest with you, there is no one right or wrong answer.
I am often asked the question “is now a good time to buy?” And, my answer to that question is that it depends on your risk profile and time frame. Today, the question should be “is now a good time to sell?” And, again, I would answer that question in similar fashion.
Those of you that are risk averse will gladly raise cash as we move into our resistance region. And, should the market prove more bullish, then you can always get back in and ride a move higher. Alternatively, there are those who like to take more risk, and will try to ride it out. I would strongly suggest those of you that find yourself in the latter camp to continue to raise the stops on your positions, and ride the market higher until it takes you out of your positions when the stops are triggered.
And, guess what . . . neither process is wrong! Both are right for each one of the respective risk profiles.
So, based upon the title of this article, I am going to implore you to make a determination as to which one of these processes fits your personal risk profile best. And, it can even be something in between. For example, I am going to be raising cash in many of the positions I own which are now heading into those resistance regions that look like topping structures based upon their specific chart patterns. Moreover, for those charts that do seem to have more bullish potential, I am raising stops to allow room for the market to prove a bit more bullish intent. And, should we continue higher, I will continue raising those stops to lock in more and more of the profit.
Some people may be much more aggressive, and rotate what they cash out in the topping charts, and move them into more bullish looking charts, thereby keeping their risk high, but also raising the probability of earning more money by riding a better looking horse.
Again, there are many ways to skin the cat (my apologies to cat lovers), and there is no one right or wrong answer. It all depends upon your own personal risk profile. But, I strongly urge you to have some plan to manage risk as we move into a potential topping structure in many charts.
Avi Gilburt is founder of ElliottWaveTrader.net.
About the author
