
Another wild volatile week but stock markets ended up after hitting new 52-week lows. A reversal? A technical temporary bottom is most likely in and it should be helped further with the announcement that smartphones and computers are exempt from the punishing tariffs on China. It's an ever-changing world of tariffs. What's on one minute is off the next.
There was so much going on that we are not putting out our usual full report this past week. We highlight the past week. A number of charts are provided, any one of which could be considered the chart of the week.
With markets tanking It sparked margin calls for big funds and the instrument of choice to dump was bonds. Bond yields rose sharply. Not what the Trump administration wants. So another reversal in the tariff wars as they announced a 90-day pause for everyone but China. Stock markets roared. But bonds stayed up as rumors came foreign central banks could be dumping U.S. bonds as well. Bond yields were down because of fear of recession. Then they reversed and bond yields were up because of margin calls and punishing the U.S. by dumping them. Oh yes, and the Titans of Wall Street are getting nervous and could be reading the riot act to Trump. The Fed stands by and watches carefully. But with $9 trillion in debt to refinance this year, rising interest rates are not going to help.
But the past week was golden as a buying frenzy was coming into the gold market sparked by buying out of Shanghai. Gold made new all-time highs again over $3,200. The gold stocks roared and the TSX Gold Index (TGD) also made all-time highs again. Lundin Gold Inc., for example, which is held in the Enriched Capital Conservative Growth Strategy* and pays a dividend, reported increased gold ounces produced and a greater number of ounces sold. Noticeably the U.S. dollar was getting pummeled and the US$ Index closed under 100. But gold is approaching overbought and the US$ Index is oversold so in this volatility it all can reverse again.
This coming week Canada releases its inflation numbers. There are a few manufacturing indices out as well as March retail sales and housing starts. Otherwise a quiet week for numbers.
Next weekend is Easter with markets closed Monday, April 21. April 18 is Good Friday but with a long weekend, markets will be quiet. To take advantage of the long weekend a shorter report will be put out.
Great market for traders. If they get it right. For everyone else, it's best to just watch.
Have a great week!
DC
* Reference to the Enriched Capital Conservative Growth Strategy and its investments, celebrating a 7-year history of strong growth, is added by Margaret Samuel, President, CEO, and Portfolio Manager of Enriched Investing Incorporated, who can be reached at 416-203-3028 or msamuel@enrichedinvesting.com
“Blessed are the young for they shall inherit the national debt.”
—Herbert Hoover, 31st president of the United States 1929–1933, wealthy mining engineer, Republican party, Secretary of Commerce 1921–1928; 1874–1964
“The United States can pay any debt it has because we can always print money to do that. So, there is zero probability of default.”
—Alan Greenspan, American economist, 13th chairman of the Federal Reserve 1987–2006, private advisor and consultant through his firm Greenspan Associates LLC; b. 1926
“The capitalist system is about taking from the Earth and from the other great commodity, labor. What's happening with this system is that the rich are getting richer and the poor are getting poorer, and the only way out of it is supposed to be growth. But growth is debt. It's going to make the situation worse.”
—Vivienne Westwood, English fashion designer and businesswoman, specialized in bringing modern punk and new wave fashions into the mainstream, ranked as the fourth most influential artist in Britain over the past 50 years; 1941–2022
Whiplash
Is your neck feeling a little sore? This past week’s action in the Dow Jones Industrials (DJI) saw plunges, followed by huge upswings (a record day), followed again by a sharp down, and finishing with a sharp up. Trump’s on-again, off-again tariffs, often happening in the same breath, spark nothing but confusion, uncertainty, and whipsaw markets. The Economist, in its headline for April 5–11, 2025 called “Liberation Day” Ruination Day. At the rate we are going, the headline might become Ruination Week, Ruination Month, and Ruination Year. Never have we, nor anyone else for that matter who is alive today (okay, some nonagenarians and centenarians when they were young), seen such destruction as we are witnessing sparked by the economic war that the U.S. under President Trump has launched on the world. It’s a game of economic chicken where no one wins. Or it’s like playing whack-a-mole with on-again, off-again tariffs. A recession is a certainty. A depression is possible.
Trump has said that America is being “looted, pillaged, raped, and plundered by nations near and far.” We’re searching for the Mongol Hordes (with apologies to the people of Mongolia) who actually did loot, pillage, rape, and plunder during the 13th and 14th centuries. The safest thing to have done this past week was to do nothing. Markets plunged, making 52-week lows, but by the week’s end, the stock markets finished to the upside. Is that it? We’ve bottomed?
This past week, just as you thought everything was going to pieces, President Trump reversed his stance by announcing a 90-day pause on tariffs—but only for nations who haven’t put reciprocal tariffs on the U.S. They have a 90-day window to negotiate a new trade deal with the U.S. Will it happen? Don’t hold your breath.
China was the exception as the U.S. upped the tariffs to 125%. Then China upped theirs. A game of I’ll see you and then raise you more. Neither side, it seems, is poised to blink. The markets exploded to the upside on Wednesday, April 9 with the DJI putting in its biggest one-day point move on record. Hallelujah, happy days are here again. It’s interesting how earlier, before the reversal announcement, Trump was recommending everyone to buy. Arguably, however, markets were so on the edge of fear that making a rebound was almost inevitable. Trump’s penchant for an on-again, off-again, on-again, etc. approach to dealing with the world has invited extreme moves in both directions. For the record, April 4, 2025, saw the third biggest down move for the DJI.
According to the best estimates, some $11 trillion of wealth has been wiped out since Inauguration Day on January 20, 2025. Over half of that has occurred in April since “Liberation Day” on April 2. A number of indices are entering an official bear market. The NASDAQ is leading the way. Joining the NASDAQ so far are the NDX 100, the S&P 400 (Mid), the S&P 600 (Small), the Russell 2000 (Small), and the AMEX. Some such as the S&P 500 briefly entered bear market territory and then reversed closing once again in correction territory.
But then by week’s end, the markets were in the green, finishing what had been a volatile week. The odds now favor at least a temporary bottom for the markets. That will bring some relief. But is it the end? Not likely. Rebounds can take on a life of their own. If for some reason the S&P 500 were to regain above 5,875, then we could be looking once again at new all-time highs. That seems improbable; however, in this whiplash world, anything is possible.
The Rebound
The NASDAQ, pictured on the next page (monthly chart), came perilously close to breaking down under that uptrend line from the 2020 pandemic low. If that breaks, then the next stop could be near 10,000. That would put the NASDAQ down some 50%. In a worst-case scenario, the NASDAQ could fall to that next line near 5,000. That line is drawn from the onset of the NASDAQ in 1971. It starts with the low in 1974 and connects to the financial crisis low in 2009. At that point, the NASDAQ would be down 75% from its high. That collapse is similar to the one that occurred during the dot.com crash in 2000–2002. The NASDAQ was hit the hardest, thanks to the unraveling of the AI bubble and the MAG7. For the record, the Dow Jones Industrials (DJI) fell 38% while the S&P 500 was down 49% during the same period. Since 2009, the NASDAQ has been forming a huge ascending wedge triangle. It breaks around 14,000 and potentially suggests a drop to nearly 5,000. Interim support is near 10,000.
However, we had that huge rebound rally on April 9, thus saving the day. Sharp rebound rallies are not a surprise in deeply oversold markets. The CNN Fear and Greed Index had fallen to extreme fear at 4. These rebounds are often meant as bear hooks or bull traps. We could even make new highs. But would it be a confirmation of a big reversal? The NASDAQ needs to regain above 20,200. Notably, on the daily charts, the NASDAQ and the Dow Jones Transportations (DJT) have given us a death cross: the 50-day MA crossing over the 200-day MA. That’s normally a sign that the bull is over and we are entering a bear. Panic buying is the opposite of panic selling. On April 4, it was panic selling. April 9 panic buying. As a reminder, this is not over. It’s only in its early stages. Even a rush to new highs could merely be a hook. The fundamentals have not changed, only the reaction.
NASDAQ (monthly) 2015–2025
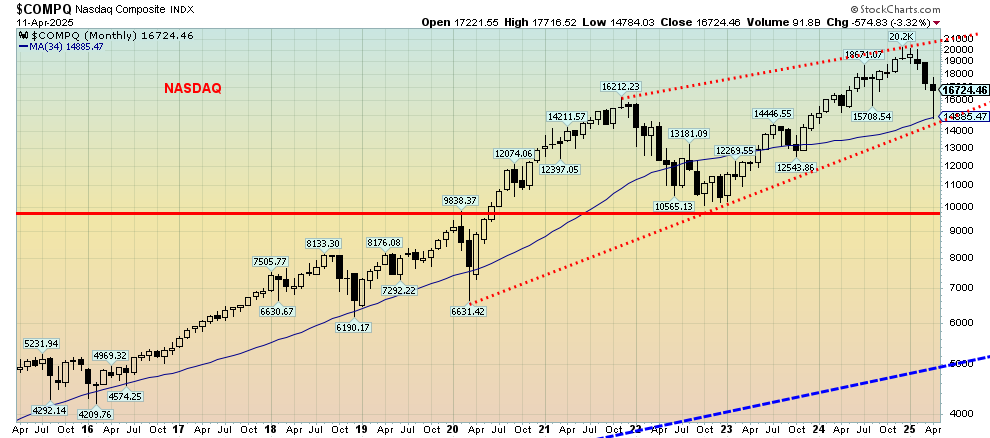
Source: www.stockcharts.com
The Pause
So, what sparked Trump’s reversal of tariffs on other countries? A reminder that it’s a 90-day pause; it doesn’t mean that this is the end of them. It’s to give everyone a chance to negotiate. But what if negotiations prove fruitless? Apparently, Trump listened to all those calls from the Wall Street titans saying if we don’t do something the world will collapse. Not only was the stock market tanking, but the bond market was tanking as well. The bond market tanking was not on Trump’s agenda. From April 4 to April 11, the yield on the U.S. 10-year treasury note soared to 56 bp.
Trump wants lower, not higher, interest rates. Rumors had it that selling was emanating from margin calls and China dumping U.S. treasuries as a part of their retaliatory measures against the U.S. As of January 31, 2025, it was reported by the U.S. Treasury Department that China held $760.8 billion of U.S. treasuries out of a total of $8.5 trillion held by all foreign entities (primarily central banks). China’s total had fallen already $37 billion in the past year. At one time China held over $1 trillion of U.S. treasuries. Apparently, Canada got in on the act as well despite only holding $350 billion of U.S. treasuries. Coordinated with the EU the warning was that a slow bleed of selling U.S. treasuries as well as putting downward pressure on the U.S. dollar would not just push up U.S. interest rates but also challenge the supremacy of the U.S. dollar as the world’s reserve currency.
Whatever the reason, it did put the White House in panic mode. The tariff pause calmed the markets. The stock market rallied. Bonds? Not so much.
Next, we show a long-term chart of the NASDAQ from its beginnings in 1971. What caught our eye was that huge ascending wedge triangle that appeared to be forming. Since 2009, the NASDAQ has been forming this wedge triangle. It breaks around 14,000 and suggests a drop to nearly 5,000. Interim support is near 10,000.
NASDAQ 1971–2025
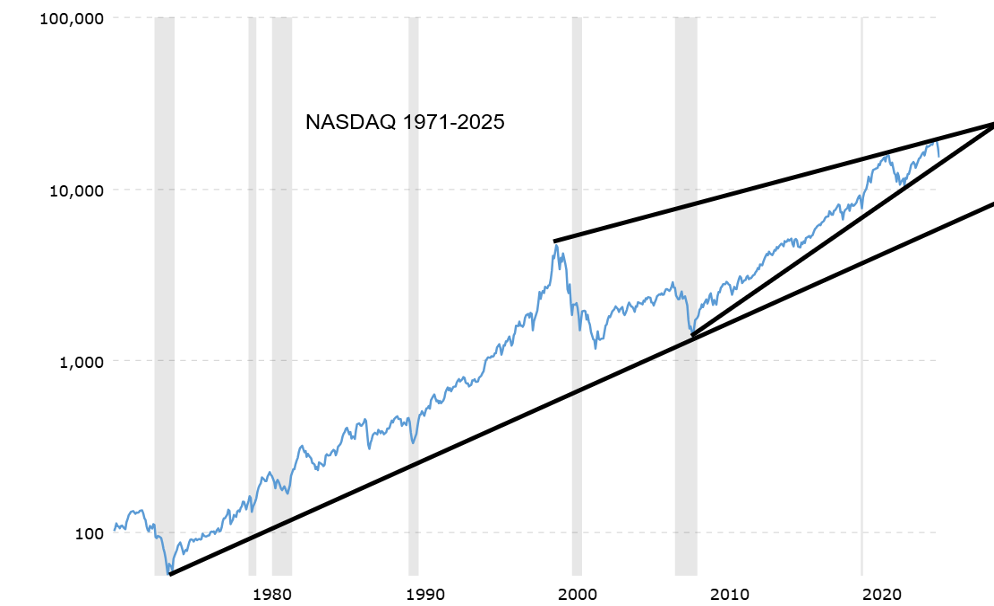
Source: www.macrotrends.net
The Sinking Bond Market
As we had noted, from April 4 to April 11 the yield on the 10-year U.S. treasury note jumped 56 bp. President Trump was looking for yields to fall. Instead, the chaos, continued inflation, the fear of more inflation from the tariffs, and a sinking US$ Index all conspired to push bond yields higher, not lower. Trump wants the Fed to lower interest rates. The Fed is an independent agency that responds to data and is not easily pressured into making rash moves pushed by those not a part of the Fed. The Fed does not report to the president nor is it owned by the government. However, it does provide updates to Congress. The potential for a clash between Fed Chair Jerome Powell and Trump is quite possible. It wouldn’t be the first time. The U.S. has a long history of presidents bashing the Fed chair. Famous clashes were between President Harry Truman and Fed Chair Thomas McCabe, and between President Lyndon Johnson and Fed Chair William McChesney Martin. However, at no time did any of these clashes cause the Fed to change course.
U.S. 10-year Treasury Note, Canada 10-year Bond CGB
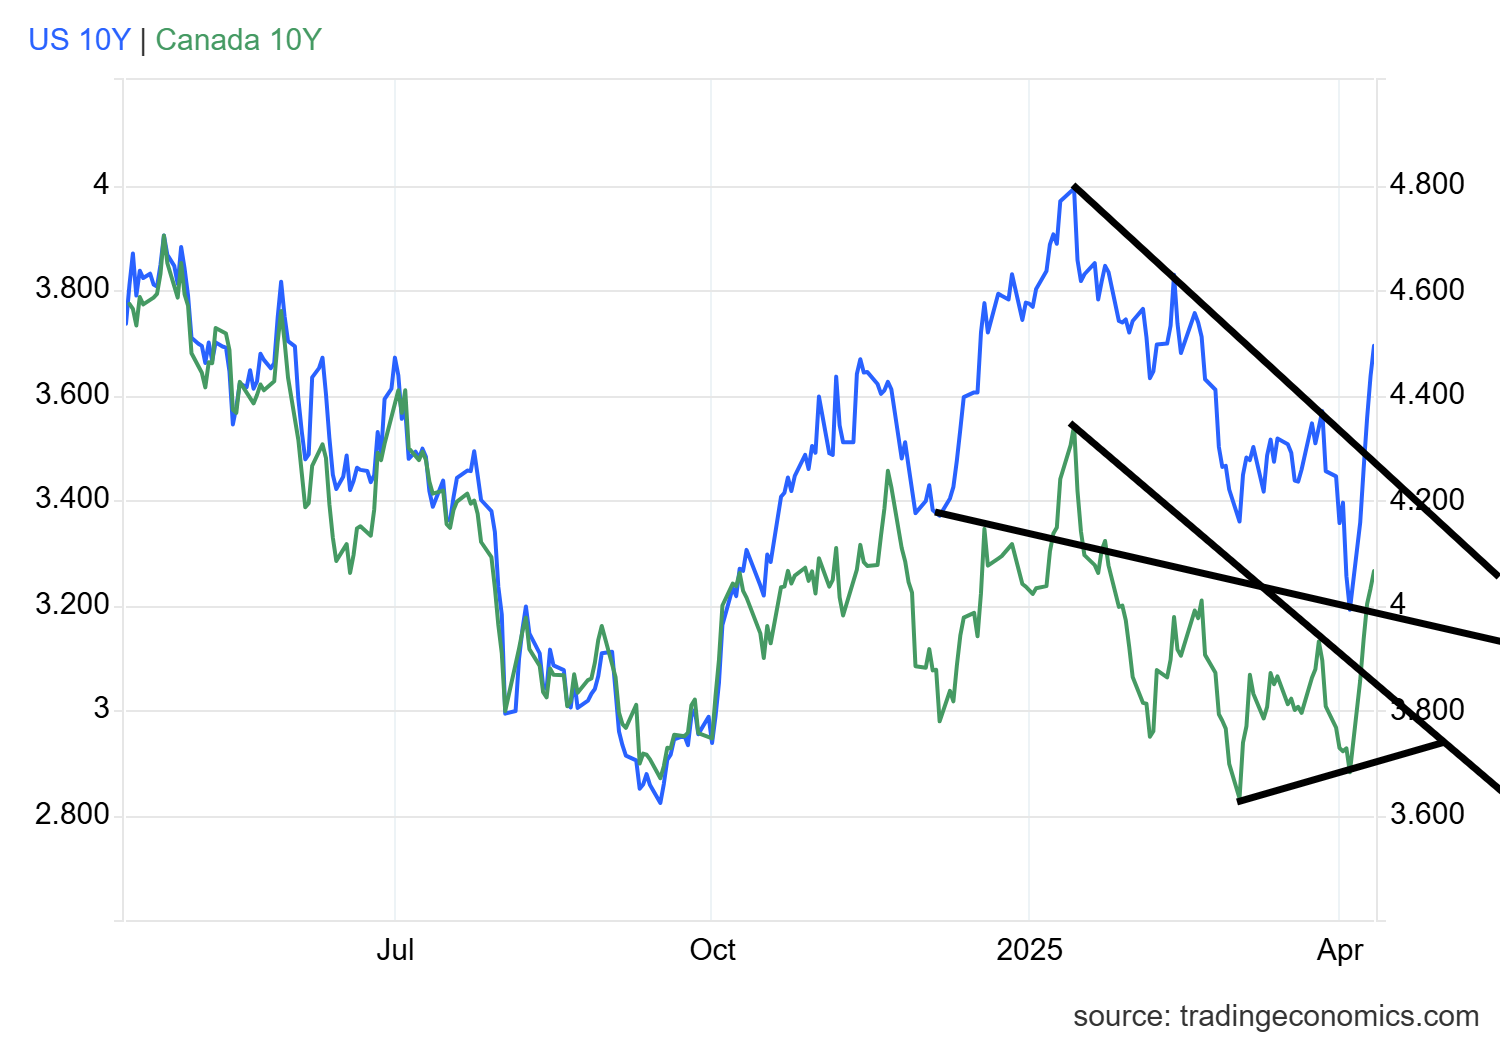
Source: www.tradingeconomics.com, www.home.treasury.gov, www.bankofcanada.ca
The Trade War
One of the big questions on everyone’s mind is, who could win this trade war between the U.S. and China? The arguments on both sides are many. However, the following chart from Visual Capitalist (www.visualcapitalist.com) suggests that the advantage may belong to China. In 2000, U.S. trade totaled some $2 trillion vs. China’s $474 billion. But by 2024 the trade advantage had reversed. U.S. trade was $5.3 trillion vs. $6.2 trillion for China. Countries that were dominated by the U.S. in trade are now dominated by China. China’s trade has diversified considerably since 2000. Note that the U.S. hasn’t ended its trade advantage but, instead, China has surpassed it. In a trade war between the U.S. and China, the advantage shifts to China, which has diversified its trade far more than the U.S. China dominates with its imports of fuel, minerals, and agricultural goods while exporting manufactured goods. Note that even Australia now trades with China more than the U.S. Proximity helps.
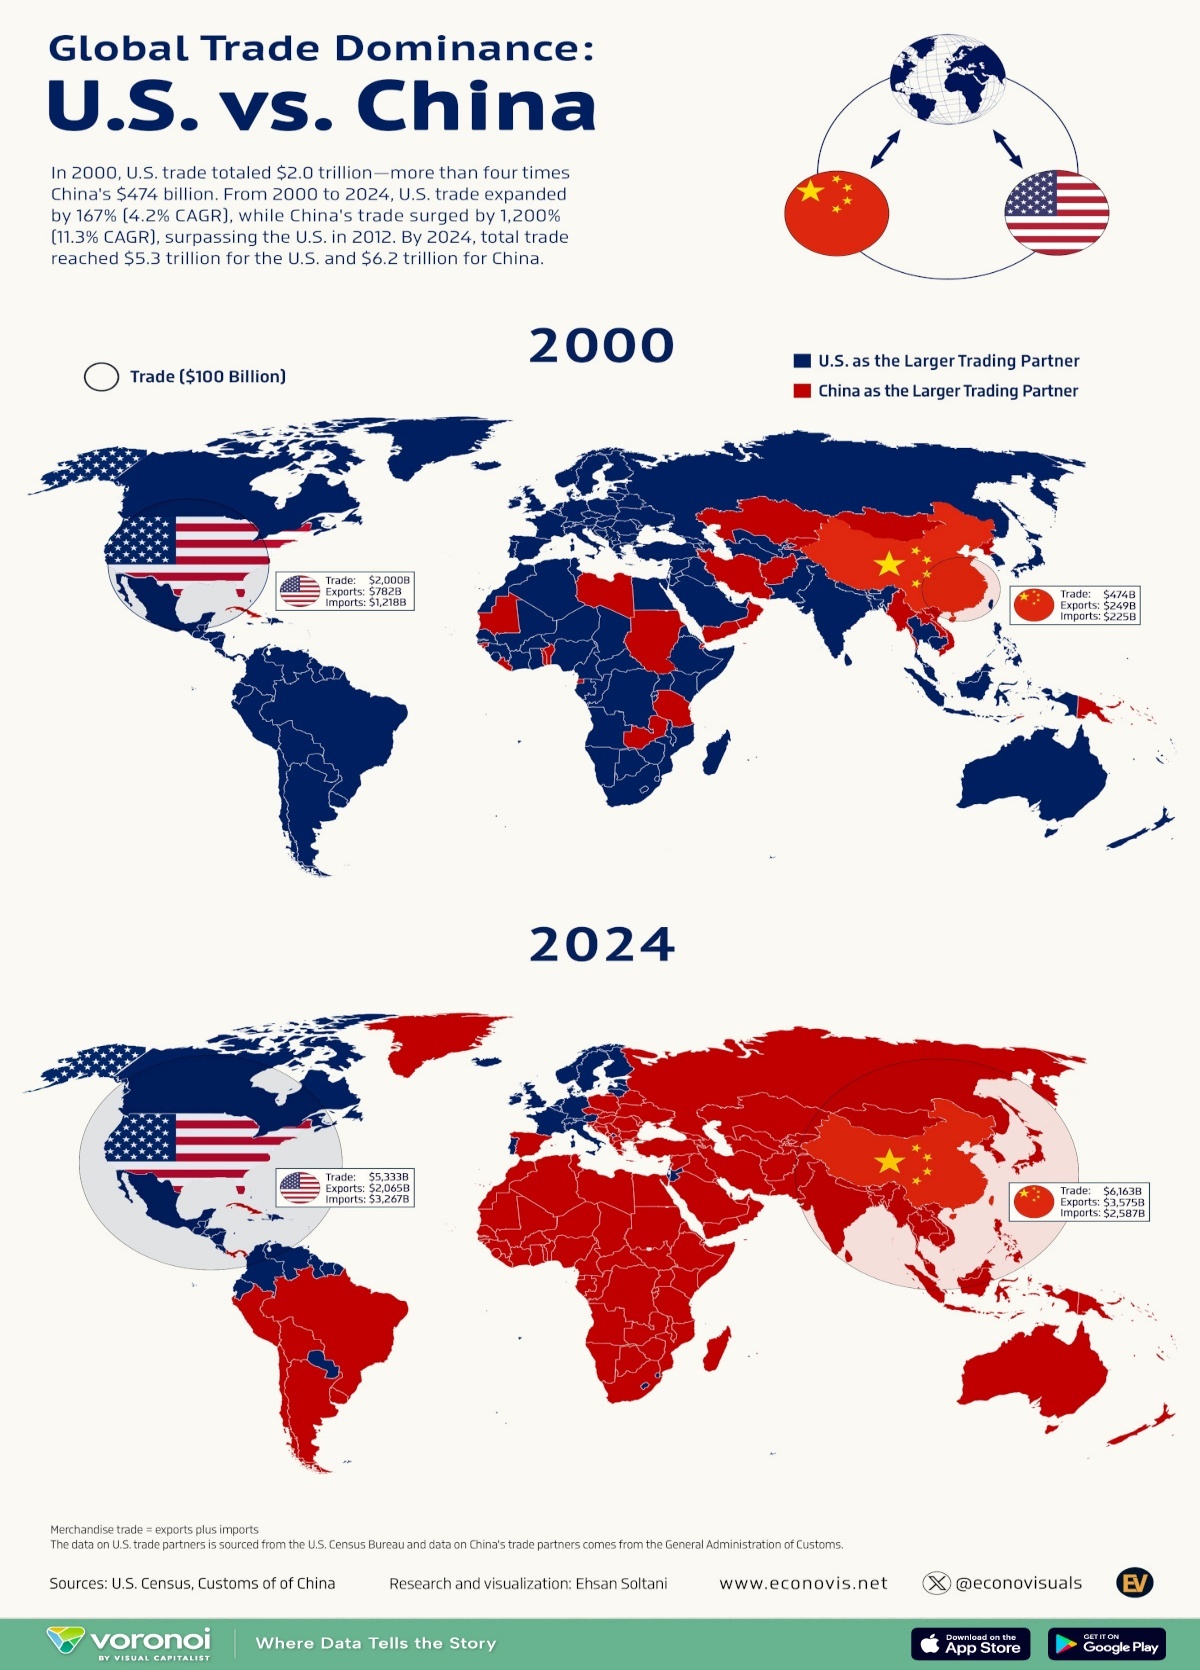
Source: www.visualcapitalist.com
“There are no winners in a trade war; only varying degrees of loss.”—John Maudlin, “Thoughts from the Frontline,” April 12, 2025 (www.maudlineconomics.com)
58% of China’s exports to the U.S. are consumer electronics, household appliances, and textiles and clothing. 50% of U.S. exports are aircraft and parts. In 2024, the U.S. exported $144 billion of goods to China while China exported $439 billion to the U.S. The goods trade deficit with China is $295 billion. It does not consider services. It’s the trade deficit that rankles the U.S. Tariffs on goods back and forth are now at 125%. It would be pointless raising them further. There is no one sector that dominates China; consumer electronics represents the biggest, with only 20%. Having tariffs on goods would be a blow to some Chinese companies. But in a world of competitive currencies, China could devalue the yen to make their goods cheaper again. China would have a difficult time replacing the aircraft and parts that make up their largest import from the U.S. The U.S. wants to replace the imports with plants in the U.S.—except that they don’t get built overnight. Then there are wages. Chinese manufacturing wages are roughly US$15,000/year. For the U.S. it’s US$50,000. Then there is the hiring problem. One company trying to relocate to the U.S. says finding qualified people is difficult.
Yes, China has its difficulties most notably in its over-leveraged real estate market but they have greater fiscal and monetary room than does the U.S. at this time. Their society is also more geared to weather economic storms.
Inflation
Inflation is moderating, as suggested by the release of the March CPI Index. Month over month (m-o-m), the CPI actually fell 0.1%, thanks to oil prices coming down. The market had expected a rise of 0.1%. Year over year (y-o-y), the CPI was up 2.4%, below the expected 2.5% and February’s 2.8%. With yields on the 10-year U.S. treasury note rising, the spread between inflation and the 10-year widened. As well, with the rise in the 10-year, the 2-year–10-year spread also widened to 42 bp from 35 bp. That suggests that the risk of recession is rising. The next day the PPI came out and it too came in below expectations, down 0.1% m-o-m vs. expected up 0.2%. The PPI was up 3.3% y-o-y, vs. the expected 3.5%.
While the drop in inflation is most likely welcome, the warning is this could be temporary. The full impact of tariffs is not yet calculated into inflation. As well, oil prices have been falling, even as threats in the Middle East primarily directed at Iran remain. Falling oil prices are great for the pump, but especially as we fall below $60 it begins to make a lot of production unprofitable and costly. As capital spending slows, “drill, baby, drill” would slow to a crawl. While oil prices are currently down, they won’t stay that way for long. Alberta in particular would also be negatively impacted by falling oil prices, given the higher costs of production to extract the heavy oil from the oil sands.
U.S. CPI, Core CPI, and 10-year Treasury Note 2015–2025
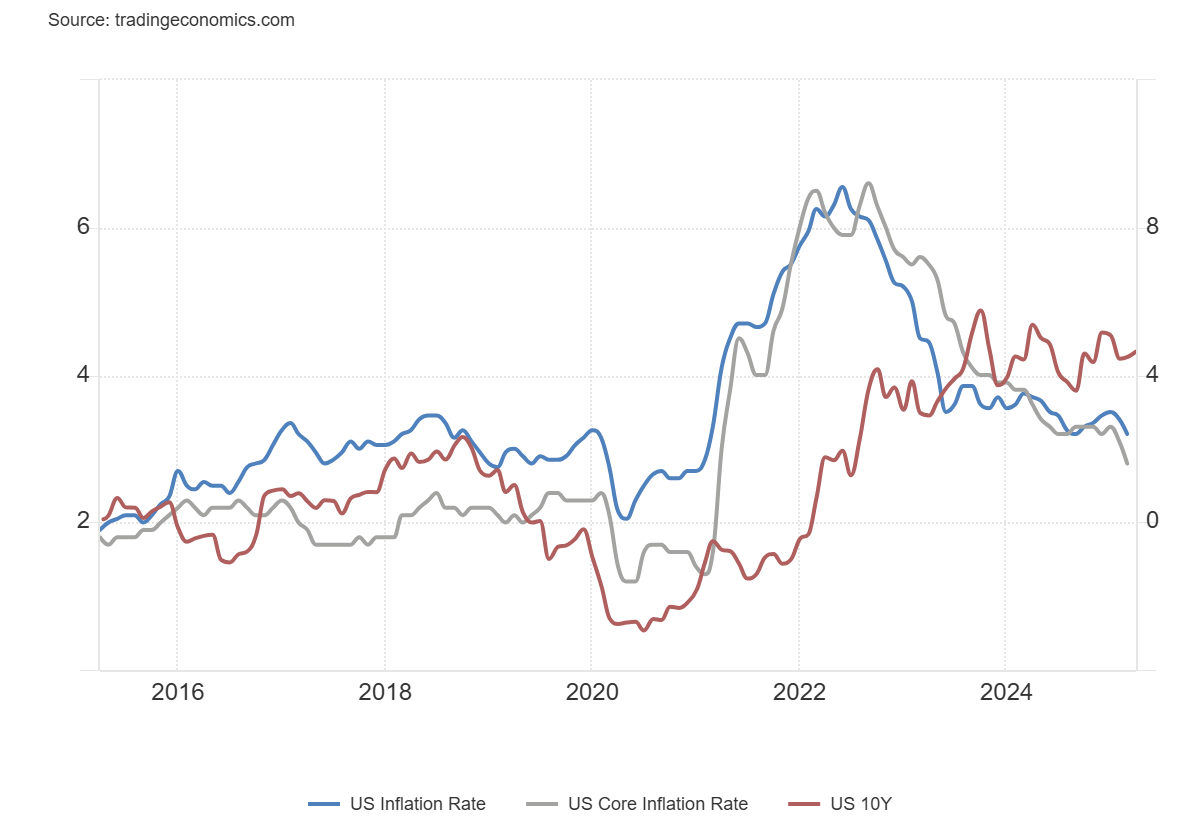
Source: www.tradingeconomics.com, www.bls.gov
The Debt
Then there is the real elephant in the room. The world is hooked on debt and this is a big problem. The U.S. is the biggest debtor in the world, with $36.7 trillion in federal debt outstanding. No one else is even close. China comes in second at around $16.0 trillion. Add in the U.S. states and municipalities plus household debt, and all U.S. debt rises to $103.0 trillion, representing one-third of all the debt in the world. The following chart from Visual Capitalist suggests $315 trillion outstanding. Some others have pegged it closer to $355 trillion. No matter, it has more than doubled from the time of the financial crisis in 2007–2009. This unsustainable rise suggests the debt can never be repaid. But it can default.
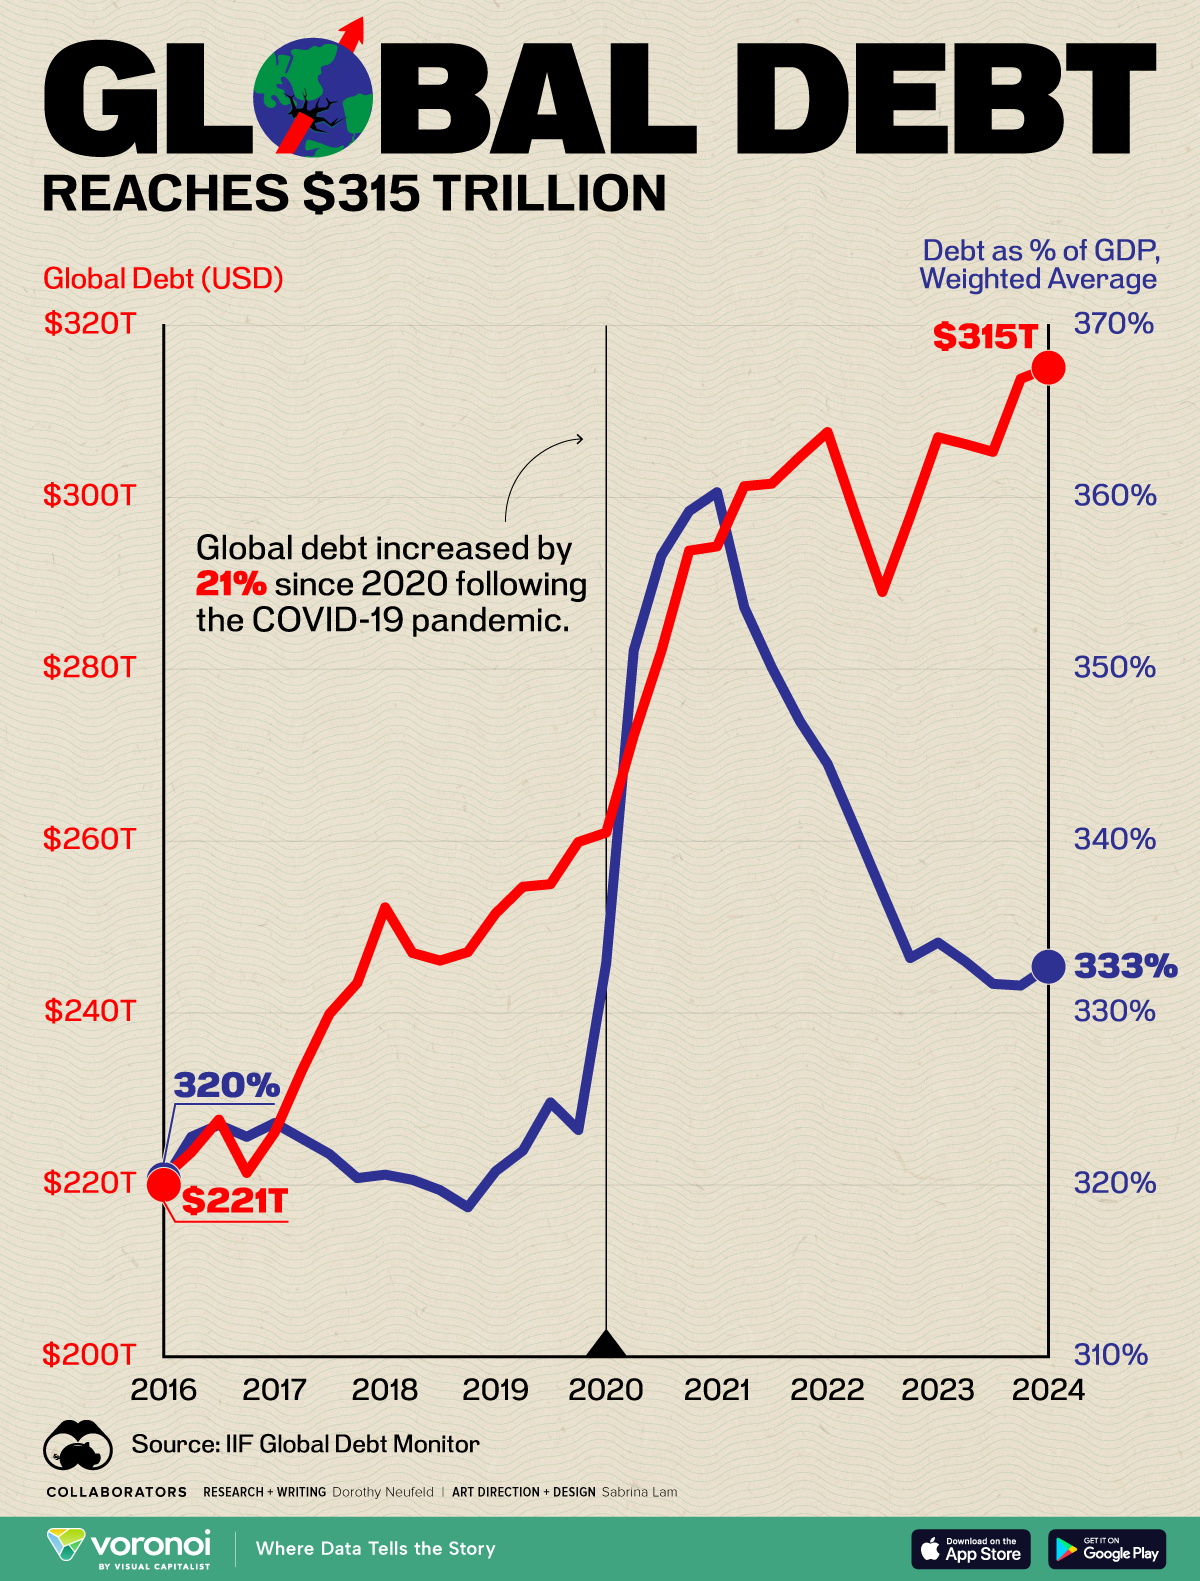
Source: www.iif.com, www.visualcapitalist.com
Debt default has a long history. Over the past forty years, we have seen debt defaults from Argentina, Greece, Lebanon, Venezuela, Ecuador, Ukraine, and Russia. Although Russia was artificially put into debt default by the U.S. due to sanctions. None of this even touches the debt defaults of corporations and banks and the bankruptcy of individuals that have also occurred. An astounding $8.5 trillion of U.S. debt is held by foreigners. That’s almost 25%. China holding U.S. debt was a quid pro quo as China sold them goods, then bought U.S. treasuries. Not anymore. While the U.S. treasury market may be the biggest and deepest in the world, even it cannot withstand sustained selling if nervousness about the current economic approach prevails and there is a loss of faith in the U.S. government. Already the U.S. dollar is falling. The US$ Index has fallen below 100, a demarcation point that saw past plunges go to 80. Witness, as well, the euro that appears to be breaking out.
Euro 2020–2025
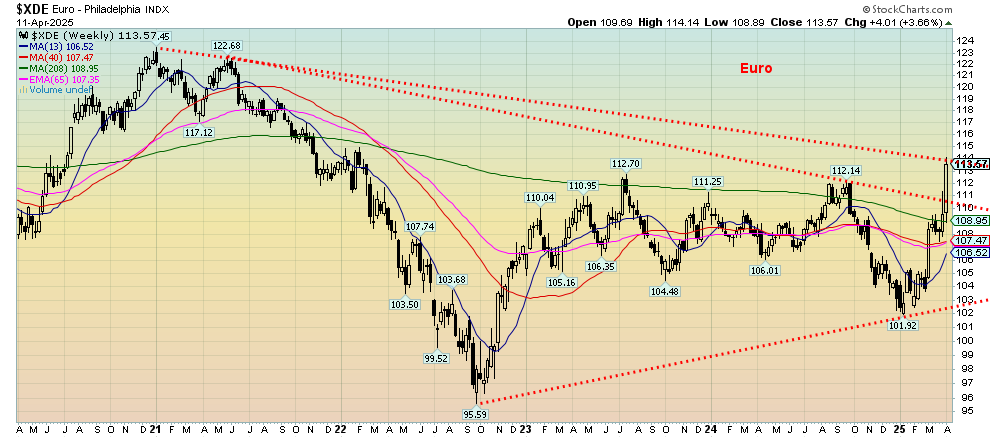
Source: www.stockcharts.com
A fall in the value of the U.S. dollar is also inflationary as imported goods become more expensive. Tariffs, a falling U.S. dollar, rising bond yields, a falling stock market—all are destined to put not only the U.S. into a recession but the world as well. And everyone becomes poorer. The US$ Index is in freefall and has broken under 100. It is interesting to note that not only do foreigners hold almost 25% of U.S. Federal debt, but they also hold roughly 16% of U.S. equities. Nervous about the U.S.? Sell!
If there is at least some good news near term, the US$ Index is quite oversold and the euro is overbought. So, reversal and counter rally are possible. The euro has not fully broken out and needs to break over 114 to confirm. Nonetheless, currencies have been plunging in purchasing power for years.
Five of the G7 countries have a federal debt-to-GDP ratio over 100%—four, if you remove Canada. Typically, Canada is reported currently at a debt-to-GDP ratio of 107.5%; however, that includes both federal and provincial debt. Federal debt to GDP alone is only 54.8% (www.statcan.gc.ca). All the others are federal debt to GDP. A ratio in excess of 100% means the country has more debt than its economic output. That risks economic instability, reduced growth, higher interest costs, especially if bond yields rise, constraints on borrowing, and potential default.
While none of the countries of the G7 face imminent default, the same can’t be said of the remainder of the countries of the G20. Argentina alone is a serial defaulter. Given the growing instability, could a sovereign default crisis occur? The Greek crisis in the 2010s came as a surprise. There are other European countries that are also shaky, including France. Interestingly, only 11 countries maintain an S&P rating of AAA, including Canada and Germany. Canadian provinces are rated separately from the federal government. All Canadian provinces have a credit rating ranging from A to AA+.
Debt to GDP By Country
|
Country |
Last reported 2023 |
Forecast 2025 |
|
G7 |
|
|
|
Japan |
255.2 |
252.0 |
|
Italy |
135.3 |
139.0 |
|
United States |
122.3 |
124.4 |
|
Canada |
107.5 (54.8)* |
106.0 |
|
EU |
80.8 |
81.2 |
|
France |
110.6 |
112.0 |
|
U.K. |
95.3 |
96.9 |
|
Germany |
62.9 |
62.7 |
|
|
|
|
|
G20 |
|
|
|
Argentina |
155.4 |
78.0 |
|
Australia |
43.8 |
43.5 |
|
Brazil |
84.7 |
92.0 |
|
China |
83.4 |
88.0 |
|
India |
81.6 |
81.0 |
|
Indonesia |
39.3 |
39.0 |
|
Mexico |
49.7 |
58.0 |
|
Russia |
14.9 |
19.0 |
|
Saudi Arabia |
26.3 |
31.0 |
|
South Africa |
72.2 |
76.2 |
|
South Korea |
51.5 |
54.0 |
|
Turkey |
29.5 |
30.0 |
Source: www.tradingeconomics.com, www.imf.org
Note: *Statistics Canada (www.statcan.gc.ca) and the Canadian Taxpayers Federation (www.debtclock.ca). Canada’s federal debt to GDP is 54.8%, making it the lowest in the G7.
Credit Spreads Widening
We are also witnessing credit depreciation. Note that the credit spread of U.S. CCC and lower to U.S. treasuries has broken out to the upside. The last time this happened was during the pandemic and before the 2007–2009 financial crisis. It is not a particularly good sign. The credit spread has gone from 99 bp to 148 bp (+49 bp) since mid-February. For the record, the BBB credit spread is up 45 bp and the AAA spread is up 19 bp in the same time period. Notably, all have broken their downtrend, along with the CCC spread. It’s another warning sign.
Credit Spreads CCC & Lower to U.S. Treasuries
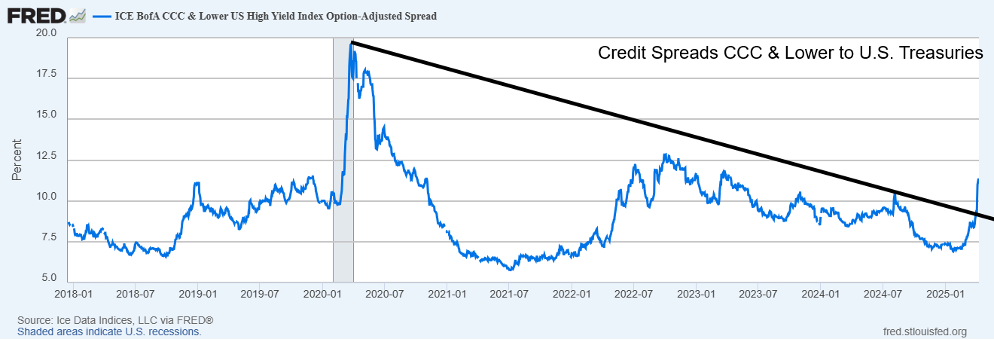
Source: www.stlouisfed.org
As well, delinquencies and defaults are rising in all sectors in both Canada and the U.S. That includes mortgages, credit cards, student loans, auto loans, credit lines, and commercial real estate, especially commercial mortgage-backed securities (CMBS). Not only has inflation eroded purchasing power but rising interest rates have made it harder for many to keep up with their loans. As unemployment rises, this will get worse. Other risks include a housing market crash and commercial real estate crash, putting increased pressure on banking institutions and raising the specter of a banking crisis.
Consumer Confidence
Consumer confidence, according to the Michigan Consumer Confidence Sentiment Index is sinking. It fell to the lowest since 2022 and it is now equaling or close to equaling the lows of the early 1980s recession and the pandemic recession of 2020. And we are not even in an official recession. At 50.4, it was below March’s 57 and below the expected 54.5. Inflation expectations came in higher than expected and consumer expectations came in lower than expected. This is not a rosy picture. However, we need to see retail sales and other consumer indicators along with rising unemployment to confirm the gloom.
University of Michigan Consumer Sentiment Index 1953–2025
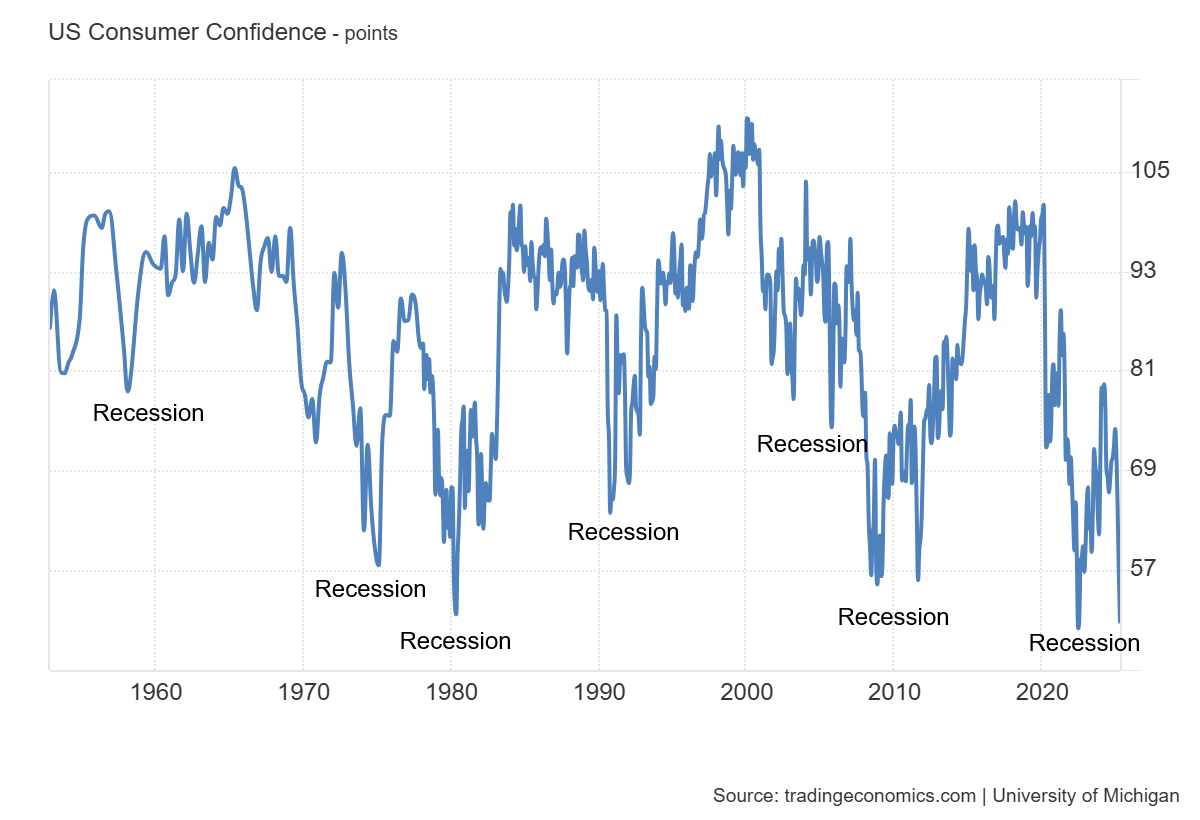
Source: www.tradingeconomics.com, www.umich.edu
Gold!
Amongst all this gloom, one thing has been shining. Gold! It gives credence that when everything else seems to be coming apart, the one thing that goes up is gold. Gold is the safe haven in times of geopolitical tensions, economic uncertainty, and loss of faith in government. It is also a hedge against currency gyrations as gold, unlike equities, bonds, and currencies, has no liability. Our 100-year chart of the Dow Jones Industrials (DJI)/Gold ratio shows that we are barely below the peak of 1929. The odds would appear to favour this ratio declining further in favour of gold. Bottoms were seen in 1933 (Great Depression), 1980 (the inflation 1970s), and more recently in 2011 (Great Recession).
No, gold does not go straight up. Indeed, we continue to be concerned about the fact that silver, which should be leading, is lagging badly. Not only is it nowhere near its all-time highs, but it remains below the highs of the past few months. The gold stocks, as represented by the Gold Bugs Index (HUI) and the TSX Gold Index (TGD), are finally breaking out to new highs and for the TGD new all-time highs. Overall, however, gold stocks remain cheap when compared to gold, and the junior miners, as represented by the TSX Venture Exchange (CDNX), are at depressive levels. This situation shouldn’t remain for much longer. The note of caution, at least in the near term, is that the divergence between gold and silver is of concern. We noted that as well with the divergence between the DJI and DJT. The DJI and DJT are resolving that divergence, as both made 52-week lows this past week. Heavy buying of gold has particularly been seen in China.
Overall, commodities should be rising over the next few years, even as economic activity is disrupted and shortages develop. Commodities shone during the period of the Great Depression and the inflationary 1970s and more recently during the 2000s as we suffered through the dot.com crash and the financial crisis. The chart of the Dow/Gold ratio is breaking down in favor of gold. With both bonds and equities falling, along with housing prices and other assets, it is a matter of when, not if, the broader population including portfolio managers starts paying attention to the rise in gold. From a low in 1976 to a high in 1980, gold soared some 800%. A comparable run today could in theory take gold to around $8,000. There is too much debt in the world and one way to deal with it is a revaluation of gold. The U.S., with some 261 million ounces of gold, would need to revalue its gold holdings to at least around $14,000 to equal roughly 10% of its current debt of $36.7 trillion.
Dow/Gold Ratio 1925–2025
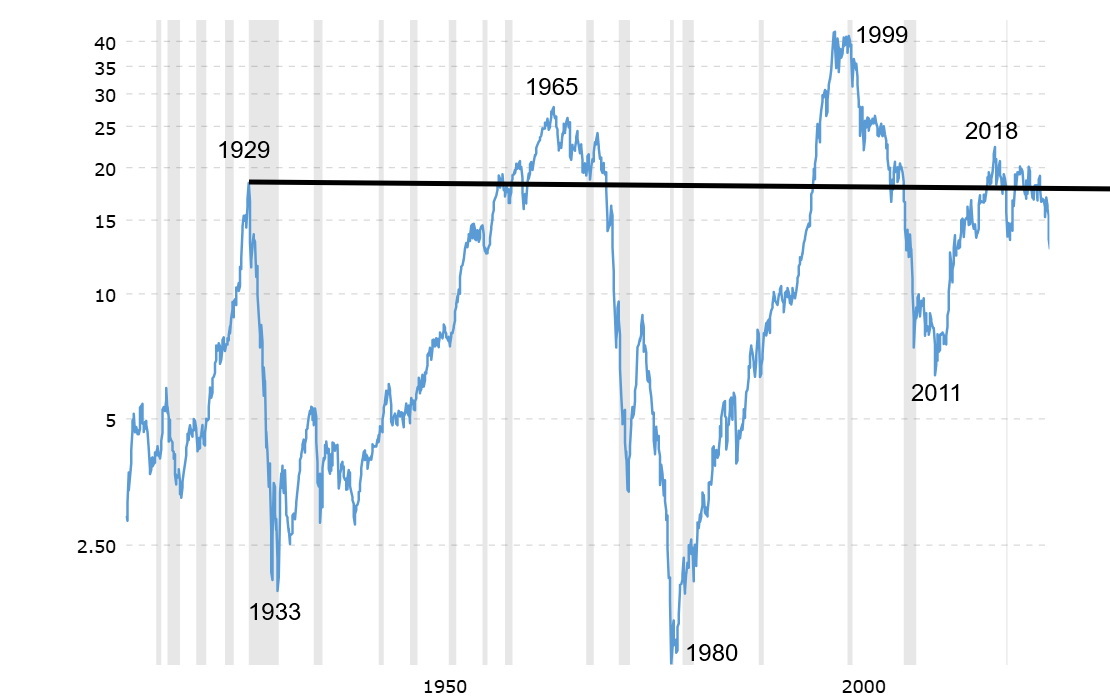
Source: www.macrotrends.net
Our note of caution on gold is it may be getting a bit frothy. A lot more attention is coming its way. We do appear to have overthrown that upper trendline. Is it a real breakout? Or a false move? We are not quite overbought, but we could be diverging from the previous high with a higher price but lower RSI. These divergences are not unusual, but one should proceed with caution from here. As we saw in the past week alone, we had a sharp down in the early part of the week but whipsawed back up over the past few days. There is a lot of uncertainty in the market and a lot of fear. A reversal again on tariffs could spark the stock market higher, but gold might react the opposite way, especially if the US$ Index were to rally from its current oversold condition. Regardless of any short-term gyrations, gold is going higher.
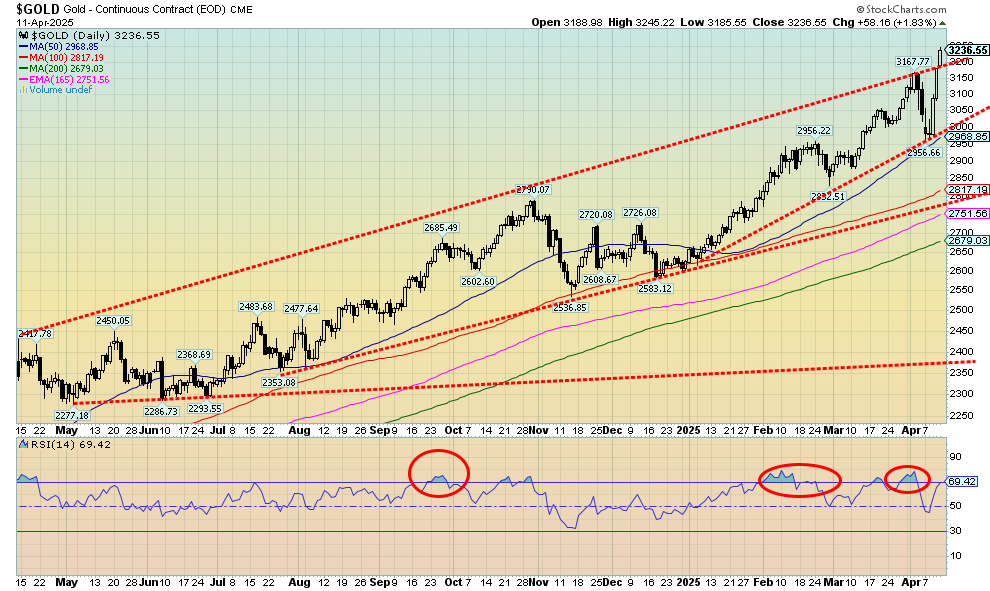
Source: www.stockcharts.com
We promised chaos and volatility in our forecast edition in December 2024. So far, we have not been disappointed. Batten down the hatches but own a bit of gold.
The Scorecard
We continue to monitor performance from the November 5, 2024 election. Gold remains solidly in the lead up 18.3%. As to rest? The S&P 500, US$ Index, WTI oil, momentum stocks, and emerging market stocks are now all down in 2025. Yes, Bitcoin remains up but it's slowly fading.
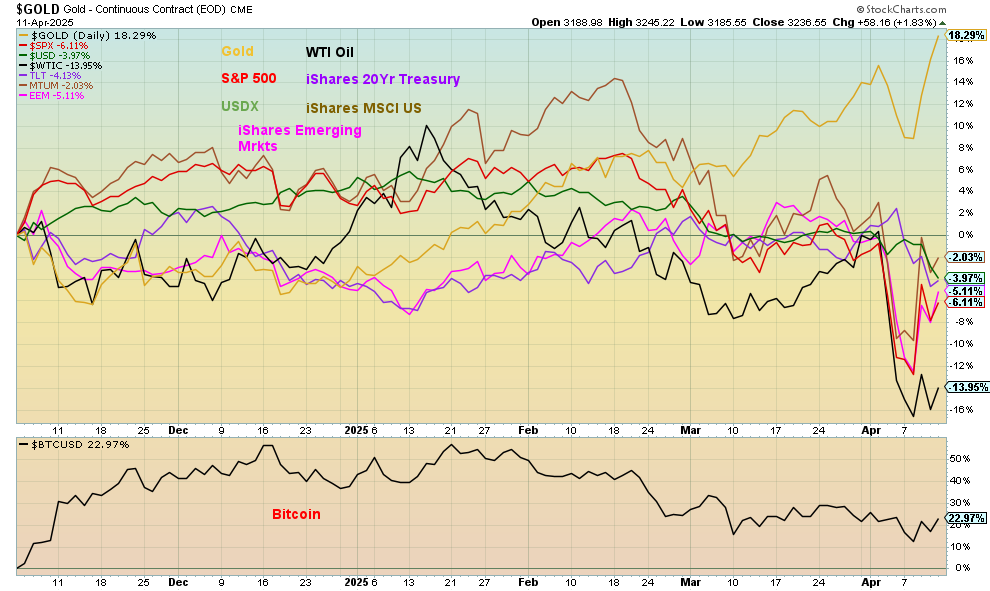
Source: www.stockcharts.com
Our Markets & Trends follow—a lot of red ink and new lows and highs. No stock markets were spared this past week, including in the EU and Asia. If the U.S. sneezes, the rest of the world catches a cold.
Markets & Trends
|
|
|
|
% Gains (Losses) Trends |
|
||||
|
|
Close Dec 31/24 |
Close Apr 11/25 |
Week |
YTD |
Daily (Short Term) |
Weekly (Intermediate) |
Monthly (Long Term) |
|
|
ne |
|
|
|
|
|
|
|
|
|
S&P 500 |
5,881.63 |
5,363.36 (new lows) |
5.7% |
(8.8)% |
down |
down |
up |
|
|
Dow Jones Industrials |
42,544.22 |
40,212.71 (new lows) |
5.0% |
(5.5)% |
down |
down |
up |
|
|
Dow Jones Transport |
16,030.66 |
13,409.39 (new lows) |
1.9% |
(15.6)% |
down |
down |
down |
|
|
NASDAQ |
19,310.79 |
16,724.26 (new lows) |
7.3% |
(13.4)% |
down |
down |
up (weak) |
|
|
S&P/TSX Composite |
24,796.40 |
23,587.80 |
1.7% |
(4.6)% |
down |
down (weak) |
up |
|
|
S&P/TSX Venture (CDNX) |
597.87 |
615.80 |
6.9% |
3.0% |
down |
neutral |
neutral |
|
|
S&P 600 (small) |
1,408.17 |
1,164.74 (new lows) |
0.8% |
(17.3)% |
down |
down |
down (weak) |
|
|
MSCI World |
2,304.50 |
2,319.02 |
(1.1)% |
0.6% |
down |
down (weak) |
up |
|
|
Bitcoin |
93,467.13 |
83,710.23 |
0.3% |
(10.4)% |
down |
neutral |
up |
|
|
|
|
|
|
|
|
|
|
|
|
Gold Mining Stock Indices |
|
|
|
|
|
|
|
|
|
Gold Bugs Index (HUI) |
275.58 |
390.21 (new highs) |
19.8% |
41.6% |
up |
up |
up |
|
|
TSX Gold Index (TGD) |
336.87 |
482.81 (new highs) * |
16.8% |
43.3% |
up |
up |
up |
|
|
|
|
|
|
|
|
|
|
|
|
% |
|
|
|
|
|
|
|
|
|
U.S. 10-Year Treasury Bond yield |
4.58% |
4.49% |
12.3% |
(2.0)% |
|
|
|
|
|
Cdn. 10-Year Bond CGB yield |
3.25% |
3.28% |
13.1% |
0.9% |
|
|
|
|
|
Recession Watch Spreads |
|
|
|
|
|
|
|
|
|
U.S. 2-year 10-year Treasury spread |
0.33% |
0.51% |
45.7% |
54.6% |
|
|
|
|
|
Cdn 2-year 10-year CGB spread |
0.30% |
0.59% |
11.3% |
96.7% |
|
|
|
|
|
|
|
|
|
|
|
|
|
|
|
Currencies |
|
|
|
|
|
|
|
|
|
US$ Index |
108.44 |
99.88 (new lows) |
(3.0)% |
(7.9)% |
down |
down |
up |
|
|
Canadian $ |
69.49 |
.7202 |
2.6% |
3.6% |
up |
neutral |
down |
|
|
Euro |
103.54 |
113.47 (new highs) |
3.6% |
9.6% |
up |
up |
up |
|
|
Swiss Franc |
110.16 |
122.71 (new highs) |
5.7% |
11.4% |
up |
up |
up |
|
|
British Pound |
125.11 |
130.79 |
1.6% |
4.5% |
up |
up (weak) |
neutral |
|
|
Japanese Yen |
63.57 |
69.62 |
2.2% |
9.5% |
up |
up |
down (weak) |
|
|
|
|
|
|
|
|
|
|
|
|
|
|
|
|
|
|
|
|
|
|
Precious Metals |
|
|
|
|
|
|
|
|
|
Gold |
2,641.00 |
3,234.06 (new highs) * |
6.4% |
22.5% |
up |
up |
up |
|
|
Silver |
29.24 |
32.19 |
8.6% |
10.1% |
down |
neutral |
up |
|
|
Platinum |
910.50 |
937.70 |
3.6% |
3.0% |
down |
down |
up (weak) |
|
|
|
|
|
|
|
|
|
|
|
|
Base Metals |
|
|
|
|
|
|
|
|
|
Palladium |
909.80 |
891.00 |
(0.5)% |
(2.1)% |
down |
down |
down |
|
|
Copper |
4.03 |
4.52 |
3.4% |
12.2% |
down |
neutral |
up |
|
|
|
|
|
|
|
|
|
|
|
|
Energy |
|
|
|
|
|
|
|
|
|
WTI Oil |
71.72 |
61.50 (new lows) |
(0.8)% |
(14.3)% |
down |
down |
down |
|
|
Nat Gas |
3.63 |
3.55 |
(7.3)% |
2.2% |
down |
up |
neutral |
|
Source: www.stockcharts.com
* New All-Time Highs
Note: For an explanation of the trends, see the glossary at the end of this article.
New highs/lows refer to new 52-week highs/lows and, in some cases, all-time highs.
GLOSSARY
Trends
Daily – Short-term trend (For swing traders)
Weekly – Intermediate-term trend (For long-term trend followers)
Monthly – Long-term secular trend (For long-term trend followers)
Up – The trend is up.
Down – The trend is down
Neutral – Indicators are mostly neutral. A trend change might be in the offing.
Weak – The trend is still up or down but it is weakening. It is also a sign that the trend might change.
Topping – Indicators are suggesting that while the trend remains up there are considerable signs that suggest that the market is topping.
Bottoming – Indicators are suggesting that while the trend is down there are considerable signs that suggest that the market is bottoming.
Disclaimer
David Chapman is not a registered advisory service and is not an exempt market dealer (EMD) nor a licensed financial advisor. He does not and cannot give individualised market advice. David Chapman has worked in the financial industry for over 40 years including large financial corporations, banks, and investment dealers. The information in this newsletter is intended only for informational and educational purposes. It should not be construed as an offer, a solicitation of an offer or sale of any security. Every effort is made to provide accurate and complete information. However, we cannot guarantee that there will be no errors. We make no claims, promises or guarantees about the accuracy, completeness, or adequacy of the contents of this commentary and expressly disclaim liability for errors and omissions in the contents of this commentary. David Chapman will always use his best efforts to ensure the accuracy and timeliness of all information. The reader assumes all risk when trading in securities and David Chapman advises consulting a licensed professional financial advisor or portfolio manager such as Enriched Investing Incorporated before proceeding with any trade or idea presented in this newsletter. David Chapman may own shares in companies mentioned in this newsletter. Before making an investment, prospective investors should review each security’s offering documents which summarize the objectives, fees, expenses and associated risks. David Chapman shares his ideas and opinions for informational and educational purposes only and expects the reader to perform due diligence before considering a position in any security. That includes consulting with your own licensed professional financial advisor such as Enriched Investing Incorporated. Performance is not guaranteed, values change frequently, and past performance may not be repeated.
About the author


Website: https://www.enrichedinvesting.com
Disclaimer: David Chapman is not a registered advisory service and is not an exempt market dealer (EMD) nor a licensed financial advisor. We do not and cannot give individualised market advice. David Chapman has worked in the financial industry for over 40 years including large financial corporations, banks, and investment dealers. The information in this newsletter is intended only for informational and educational purposes. It should not be considered a solicitation of an offer or sale of any security. The reader assumes all risk when trading in securities and David Chapman advises consulting a licensed professional financial advisor before proceeding with any trade or idea presented in this newsletter. David Chapman may own shares in companies mentioned in this newsletter. We share our ideas and opinions for informational and educational purposes only and expect the reader to perform due diligence before considering a position in any security. That includes consulting with your own licensed professional financial advisor.