
- Mandatory Madness
- Who Holds the Debt?
- Spending Growth
- Where Did All My Travel Go?
“Diamonds are forever,” according to the jewelry industry. That may be a slight exaggeration, yet diamonds will certainly outlive you and whomever you give them to.
Debt isn’t forever but can definitely seem like it. That feeling is a clue you have too much debt. Wisely used, debt helps build income-generating assets that pay for themselves. The payments are manageable because you’re also getting something else of value.
On a national level, though, we’re not investing in the future. We use debt to fund routine government services, long-promised benefits like Social Security and interest on all of it at the highest rates in decades.
Anyone who has ever been over their head in debt can testify how paralyzing it is. You become ultra-cautious, unwilling to take risks because even a small mistake can be catastrophic. The same can happen (and has happened) to entire countries when the government gets over its head. Sovereign defaults—or the fear of them—lead to austerity for everyone.
The United States has so far avoided that fate because we have unique advantages: the largest economy, the global reserve currency, military strength. Yet even with those, we face limits. No one is going to foreclose on the US Treasury but at some point, they will become less willing to lend it more cash.
Long before then, the debt will suppress economic activity enough to force the changes voters and politicians have been unwilling to make. Today we’ll look at the latest federal budget data and see how much time we have.
In the event you missed the interview with Keith Fitz-Gerald I mentioned last week, you can still click here to watch (transcript version also available at the link).
In this wide-ranging interview with Ed D'Agostino, Keith discussed his 2023 market thesis, inflation, Fed policy, as well as big picture risks and opportunities he sees. It's a great primer on Keith's current thinking.
Two weeks ago in Assumptions Have Consequences, I talked about the Congressional Budget Office’s debt projections. The CBO has since released new data, so let’s look again.
Here is an updated version of the budget chart I’ve been sharing occasionally since 2016. It uses data from CBO’s 10-year spending and revenue projections.
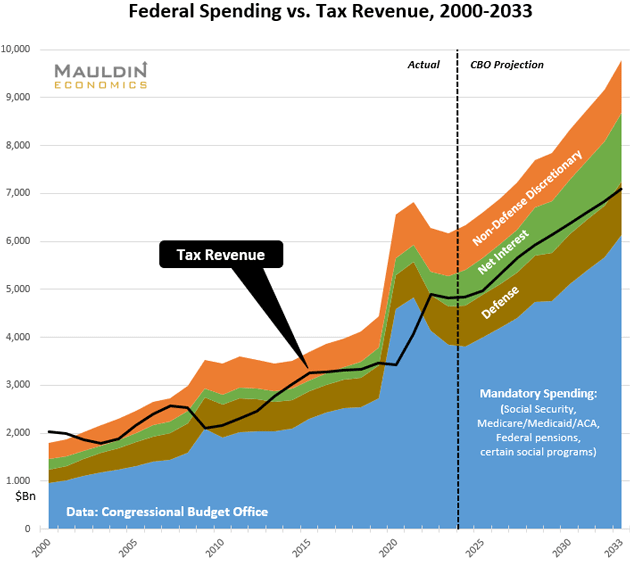
As noted in that earlier letter, CBO makes numerous assumptions in projecting these numbers. For one, they don’t try to forecast the fiscal impact of recessions, which is why you see the lines get jagged around 2008 and 2020. CBO also has to assume current laws and tax policies will remain unchanged for the next decade, which certainly won’t be the case.
The new data shows some subtle but important differences. Adding 2033 shows, for the first time, mandatory spending plus defense consuming all tax revenue. It also shows how that mandatory spending drives the train. The other three spending categories (defense, non-defense discretionary, and net interest) show only minor projected growth, except for net interest. (I say “minor” ironically because they’re still vast sums of money.) The mandatory spending accounts for most of the spending growth, and most of that is Social Security and Medicare as the rest of the Boomer Generation reaches retirement age.
Just eyeballing the chart, you might see an appealing solution. If we could just return spending to 2019 levels and keep tax revenue where it is, the budget would balance and we’d have a surplus to begin paying down the debt. But that would require benefit cuts for current retirees, not just future ones. There is no political will to make benefit cuts. Franklin Roosevelt, when offered the opportunity to means test Social Security, flatly rejected it. He wanted everyone to feel they had “skin in the game.”
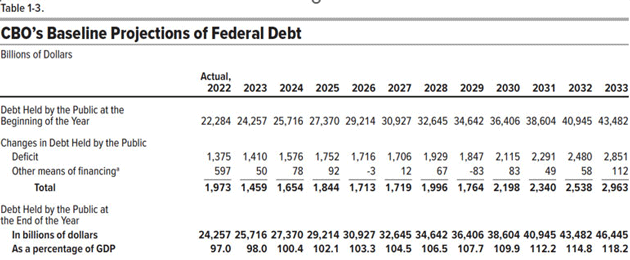
In reality, each one of those annual deficits (i.e., the amount above the tax revenue line) adds to our already-giant debt load. Here is the latest CBO summary table.
Source: CBO
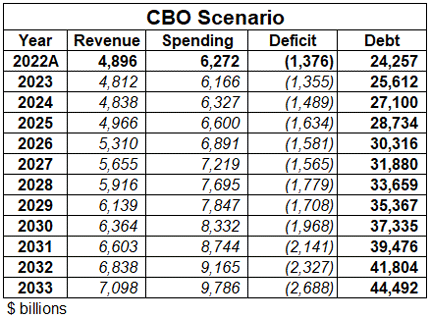
Not so long ago I was lamenting the idea we would have $30 trillion in debt by 2030. Now that’s officially projected to occur in 2026, reach $40 trillion five years later, and approach $50 trillion in the mid-2030s. The debt is doubling roughly every 10 years.
Watching these 10-year forecasts develop over time, I have learned they understate reality. CBO’s January 2016 report, which we used to make the very first version of the above chart, showed the debt reaching $23.8 trillion 10 years from that point (i.e., the end of 2026). It’s only 2023 and CBO now projects $30.9 trillion for 2026. Their 10-year projection underestimated the debt by 30%.
That’s not a knock on CBO. It doesn’t know the future and certainly didn’t know COVID was coming. It’s bound by inherently uncertain assumptions. The point is these numbers, however bad they look, probably don’t look nearly as bad as reality will.
We aren’t going to get through the next decade without some other kind of fiscal catastrophe, whether recession, war, pandemic, or something else. And whatever it is will aggravate a bunch of already-terrible problems.
This brings up a personal pet peeve that I have with the CBO data. It shows debt in terms of debt held by the public. But that is not all the debt the US owes. There is the debt held by the Federal Reserve and various government agencies (like Medicare, Social Security, the highway trust fund, and so on).
If you include this other debt, you get $31.5 trillion. Here is that debt helpfully displayed from US Debt Clock (a very cool site full of data you can drill down on by clicking the numbers). Further, the off-budget debt is really hard to find. That averages about $269 billion a year but can vary wildly.
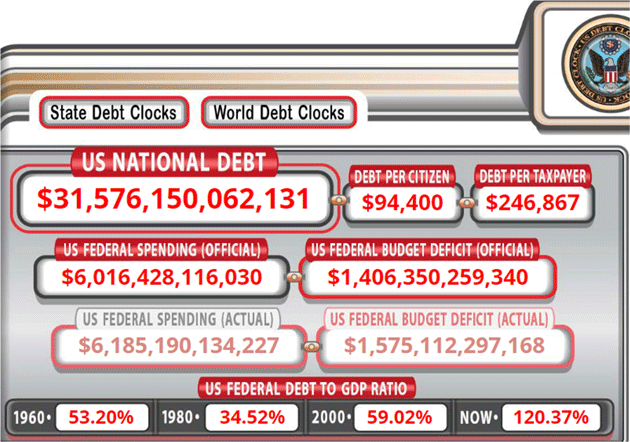
Source: US Debt Clock
Some argue that debt held in the Social Security trust fund should not count. We owe it to ourselves. I shouldn't have to restate it, but there is no Social Security trust fund. It is an accounting fiction because that money has already been spent, and part of why we have “off-budget” debt and deficits.
Let's look at that “we owe it to ourselves” line of thinking. In one sense it is actually true, but we still have to repay it. The accounting fiction that is the Social Security trust fund will slowly dwindle as we are now paying out more in Social Security benefits than we are receiving in Social Security taxes. The same with Medicare and other such pools.
You can make an argument that money held by the Fed should not be counted, but it is rolling off that Treasury debt even as we speak. How much will it reduce the balance sheet? No one, including officials at the Fed, knows. But it is not nothing.
Let’s look at the actual debt owed as of the end of the fiscal year 2022 (ending in September 30) from the US Treasury website. It goes back five years in this table. As above, we now have $31.5 trillion in debt and rising. That means in the last five years we have added $10 trillion to the national debt. Yes, a lot of it was pandemic relief, but a lot was also budgeted deficits which were pushing $1.5 trillion. So we were on course for adding $6 trillion even without the pandemic.
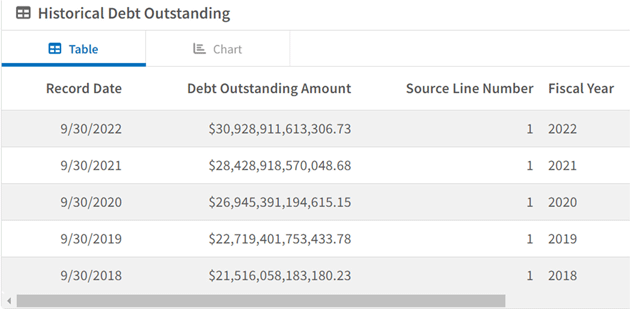
Source: US Treasury Department
We will explore what the debt will really look like in a minute but first let’s look at spending growth.
You may notice I describe all this in dollar terms, unlike many analysts who measure the debt as a percentage of GDP. I do this on purpose, partly because dollars are what people know. I find using familiar terms helps people see the situation more clearly.
But more important, GDP is itself an artificial construct that doesn’t necessarily measure the economy. There was a large debate in the 1930s on whether or not to include government spending as part of the GDP. More conservative economists noted that counting government spending merely double counted the same dollar that went from private to public sources. Yes, government spending does influence GDP in that it provides salaries and other stimulus. If that money had been left in private hands, it would have been used differently, and maybe more productively when directed by private citizens.
Further, we do not know what GDP will be in the future, so using it in budget projections adds yet another assumption.
That said, expressing debt as a percentage of GDP does simplify historical comparisons to periods when the economy was smaller. It also helps when comparing one country’s debt to another’s. On the debt clock website, you can look at the upper right-hand corner and click on world debt clocks for various countries. You’ll find that Japan has 296% debt to GDP, Italy has 171%, and Russia has the lowest debt in this analysis at 26%. Helpfully, you can also see their external debt (non-government) to GDP, which is a real eye-opener, and maybe a topic for a future letter. But back to the US.
This chart from CRFB (Committee for a Responsible Federal Budget) draws on the same CBO data but expressed in GDP terms. The differences are instructive, so let’s look closer.
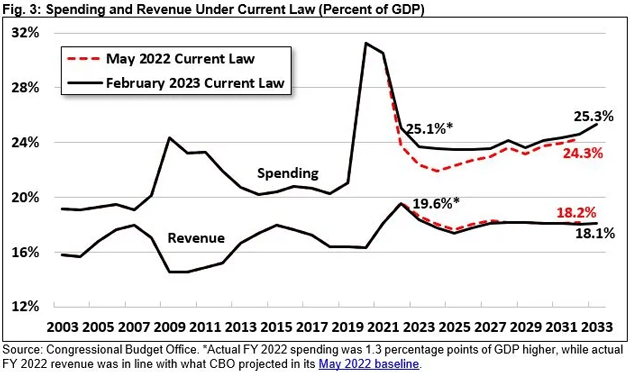
Source: CRFB
The lower line shows revenue and the upper one spending; the gap between them is the yearly deficit. The red dashed lines are the CBO’s previous projections as of May 2022. They proved pretty close on revenue but significantly underestimated spending, in part due to the infrastructure legislation Congress passed last summer.
Comparing this to my chart that uses dollars, the spending growth from 2023‒2033 doesn’t look nearly as dramatic. That’s because CBO also assumes GDP is growing at the same time. It also shows revenue growth flattening as a percentage of GDP while spending keeps rising. Hence the growing debt.
CRFB’s latest debt analysis covers the highlights pretty well, so I’ll quote them and then give you my quick reaction.
“Debt [held by the public –JM] is on course to reach a record 118 percent of GDP by 2033. CBO projects debt held by the public will grow $22 trillion over the next decade, breaching $46 trillion by the end of Fiscal Year (FY) 2033. Debt will grow from 97 percent of Gross Domestic Product (GDP) in 2022 to 118 percent by 2033; it could grow to over 130 percent of GDP if policymakers extend various expiring policies.”
As bad as this sounds, it is quite a bit better than Japan, where the public debt is presently 296% of GDP, much of it held by the Bank of Japan. Debt service consumes about half of Japan’s government tax revenue.
But before you think that’s good news, keep in mind Japan runs a large trade surplus, which is one reason it has much higher savings rates. The US has a structural trade deficit because our main “export” is really the US dollar. We don’t have the kind of domestic savings needed to support Japan-like debt levels.
“Deficits will double from $1.4 trillion today to almost $2.9 trillion by 2033. Deficits will total 6.1 percent of GDP ($20.3 trillion) over a decade and reach 7.3 percent of GDP by 2033—the highest ever outside of a national emergency.”
Note that last part. There are times, true emergencies, when governments need to run large deficits. Preserving the capacity to do so means you can’t let large deficits become normal. Yet that’s what we have done, and I fear it will become a giant problem in ways we don’t yet foresee.
“Spending on health, retirement, and interest will grow rapidly while revenue fails to keep up. Spending will grow from 23.7 percent of GDP in 2023 to 25.3 percent by 2033, while revenue will fall to a low of 17.4 percent of GDP in 2025 before rising to 18.1 percent in 2030 and beyond. Interest costs alone will reach a record 3.6 percent of GDP—$1.4 trillion—by 2033.”
All that, of course, assumes that the CBO headline numbers will be what plays out. But if you drill down you find that the confidence level on those numbers is rather shaky. The CBO website has a number of very interesting charts in one convenient place.
“CBO’s projections of economic output and labor market conditions are subject to a high degree of uncertainty. In the short term, the effect of higher interest rates on overall demand, the easing of supply-chain disruptions, and participation in the labor market could be larger or smaller than expected. In the longer term, the growth of potential output in the aftermath of the pandemic could be faster or slower than expected.”
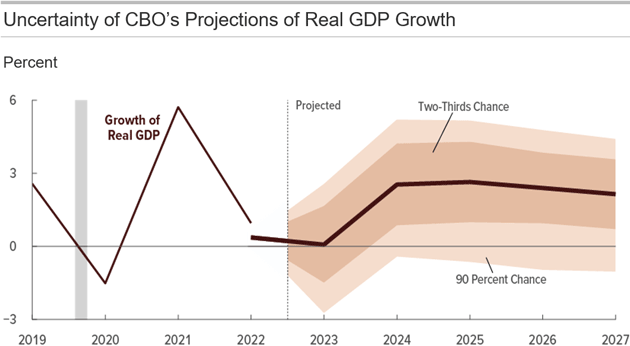
Source: CBO
The CBO estimates an approximately two-thirds chance that the annual rate of real GDP growth will be between -1.5 percent and 1.7 percent in 2023 and between 0.7 percent and 3.6 percent in 2027. Note, they never project a recession in the out years, for reasons that are partly political but mostly because they just don’t know. While I disagree with some of the CBO’s assumptions (who doesn’t?) its analysts do the best they can in a very difficult job.
Spending growth is a problem, but no one is seriously talking about a solution. Most are more focused on protecting the particular spending they like, whether it be social programs or defense. Nor are many talking about how to close the gap by raising revenue in sensible ways like a VAT tax. As with spending, most view tax policy as a way to reward their friends and/or punish their enemies.
Meanwhile the debt keeps growing and the cost of that debt—interest—keeps rising. From 2008‒2021 we became accustomed to abnormally and artificially low interest rates. That era isn’t coming back, meaning the same amounts of debt are far less feasible now.
Here is a table we made to summarize the CBO’s latest scenario:
Now let’s modify that with some different assumptions. I think the debt is going to contribute mightily to a slowing growth in GDP, which will reduce tax revenues but not do much to spending. Further, history shows that spending growth will just increase, whether from Congress or from inflation. So, what if we have less revenue and more spending?
Let’s assume (and I truly hope this proves to be an exaggeration) that spending will rise 5% more than CBO projects, and revenues will be 5% less than CBO projects. Plus, we’ll add the same off-budget spending number we’ve used before. In that scenario, debt held by the public jumps to $54 trillion in 2033.
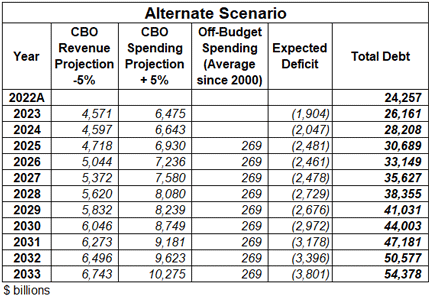
And here is a line graph comparing CBO with this alternate scenario.
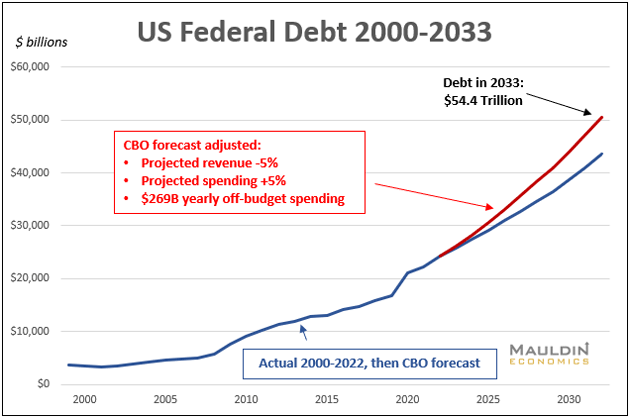
Add in the off-balance sheet debt of about $6.5 trillion and you get to $61 trillion in 2033.
As noted above, the CBO cannot assume, because they don't know, any negative economic problems in the future. None of us know what’s coming, but experience says we shouldn’t expect a smooth ride over the next 10 years.
Sometimes I wonder what it must feel like not to care about all this. I really don’t enjoy being a budget scold, partly because we are a dying breed. It is getting lonely in my worry closet. Very few people truly care about government debt anymore, and even the number who pretend to care about it is shrinking, especially in Washington, DC, and Congress. And almost no one even talks about the drastic changes it would take to actually balance the budget—much less begin paying down the debt.
I titled this letter “Deficits Forever” because, unfortunately, I think that’s probably what will happen. And that might be okay of we could at least keep the deficits somewhat smaller and more stable. That doesn’t seem to be in the cards, though. We are going to reckon with this debt for a long time.
My friend Neil Howe is working on a new book, “The Fourth Turning Is Here.” I've been privileged to read the first draft. As longtime readers know, I've been fascinated with Neil’s work, and maybe that influences me when I talk about The Great Reset. But I do see a period of turmoil coming. The good news is the Fourth Turning will give way to another, far more upbeat era. We just have to endure a rather bumpy ride first.
It's not the end of the world. While I don't think that period will truly be what I think of as “Muddle Through,” we will in fact get through it. If you pay attention, you can probably do quite well. But we will not be able to rely on past performance to manage our portfolios. Hope is not a strategy.
I have no idea how we should be positioned today for something that will happen in 7 to 10 years. I have no idea who will be in charge of Congress, what the situations will be, etc., but we will have options. Stay tuned.
Prior to 2020, I was averaging 200,000-plus miles a year for the last 10 to 15 years at least. American Airlines counts me as 8 million miles, but I think some of those are double counted because they're in business or first class. I really don't pay attention. But I have to confess that I miss some of the international travel and speaking. I know that my travel will pick up later in the spring. Longtime readers know this personal section was once about my travels in addition to my family and experiences.
That being said, if you have to be “stranded” in one place, the paradise of Dorado Beach, Puerto Rico, isn’t bad. Recently, I have been focusing on the SIC (this will be the best ever!) and finally finishing my first draft of a series of white papers on the energy world. The research has been fascinating.
I am running up against deadlines, so it is time to hit the send button. You have a great week and spend some time connecting with friends and family, which always gives you your best return on investment. And don't forget to follow me on Twitter!
You're wondering how the debt resolution will play out analyst,

|
|
John Mauldin |

P.S. If you like my letters, you’ll love reading Over My Shoulder with serious economic analysis from my global network, at a surprisingly affordable price.
Click here to learn more.
About the author
