
- I think this statement probably sums up the current banking crisis most succinctly: “The American banks have a whole bunch of accounting tricks that they can play, to show earnings when earnings don’t exist, to show capital when capital doesn’t exist… totally unacceptable.” – Dick Bove, US bank analyst, Mar 13, 2022.
- Please click here now. Double click to enlarge this DIA Dow proxy chart. Instead of buying put options to protect themselves against more pain, most impaled stock market investors are inventing silly reasons to stay in the market.
- It’s a dangerous way to handle what could be a hybrid of the hideous bear markets of 1929-1932 and 1966-1980.
- Please click here now. Double-click to enlarge this horrifying JP Morgan monthly chart.
- If more US banks fail and are not bailed out, depositors will pull their funds out of many other banks… and they will gravitate towards gold.
- If more banks fail and they are bailed out, it will be with printed fiat, and “Weimar 2.0” could be put in motion. That’s also great news for gold.
- It’s win-win for gold… as it ultimately always is.
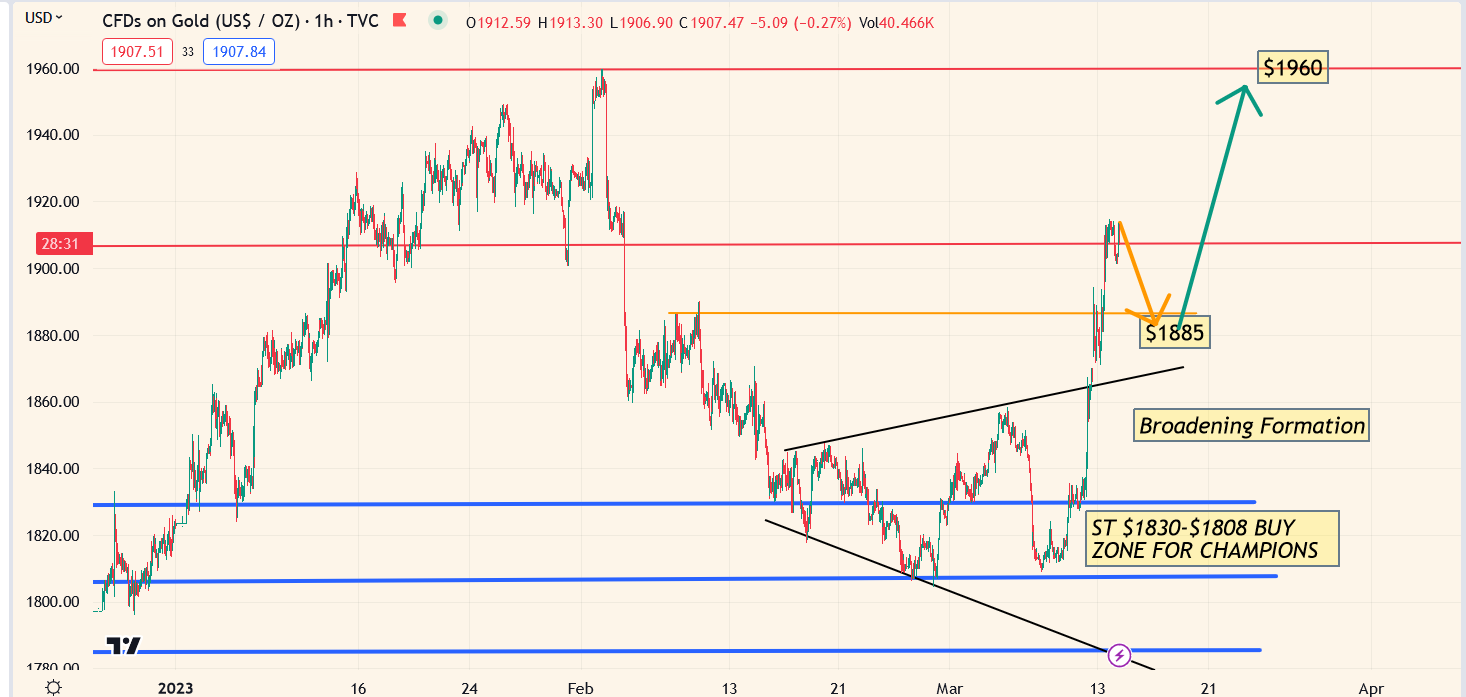 Click to enlarge this stunning short-term gold chart. Note the broadening formation that I’ve annotated with black trendlines.
- Broadening action indicates a loss of control. Clearly, the US banking system is in disarray. Arguably, the situation is even more ominous because of a US government that is completely out of control.
- I urged gold bugs of the world to buy $1830 and $1808 and of course $1808 marked almost the exact low of the reaction. It was the launchpad for the rally oriented around the banking fiasco.
- Those who took decisive action got richer, and the technical and fundamental situation suggests that all gold and silver bugs are poised for more good times.
- On that note, please click here now. Double-click to enlarge what is obviously one of the greatest charts in the history of markets, the weekly gold chart.
- I urged investors to pay close attention to the action of the RSI and Stochastics oscillators at the “momo” (momentum) zone of 50.
- This zone is where violent rallies to the upside can occur, and we have a bank-oriented barnburner in play right now!
- A daily focus on the big gold-themed picture is critical for investors as inflation, the 2021-2025 war cycle, a wildly overvalued stock market, and empire transition dominate the investing landscape. I cover that big picture 5-6 times a week in my flagship Galactic Updates newsletter with updates like this one today. At $199/year, investors feel the price is too low, but I’m doing a $179/15mths special offer this week for investors who want in on the winning action. Click this link to get the offer or send me an email and I’ll get you a payment link. Thanks!
- For a look at the dollar, please click here now. Double-click to enlarge this DXY daily chart. A close over 106 would ignite a significant rally, but that close is unlikely.
- The drop from the high around 115 is aggressive. Even if today’s CPI report is “worse than expected” and the Fed is “more hawkish than expected”, the banking system problems are going to worsen.
- Also, Euro zone citizens have borne the brunt of the inflationary pain caused by the sanctions linked to the US government’s diabolical scheme to use Ukrainian citizens for cannon fodder against Russia. So, the ECB is likely to hike aggressively on Thursday. That will put another nail in the dollar’s coffin.
- From there, the next round of US bank failures will likely put the coffin in the ground. Going forwards, it’s going to be all about… gold!
- What about the miners? Well, they initially struggled as gold rallied from my $1808 marker. Conspiracy buffs will relate it to naked shorting and mainstream analysts will say it’s caused by margin calls in the stock market.
- Whatever the reason, the good news is that there are serious green shoots appearing on the charts and yesterday’s trading featured lots of technical breakouts.
- Please click here now. Double-click to enlarge this enticing GDX chart. A double bottom is in play, with a gap-oriented breakout through the neckline.
- Short-term profits can be booked on a rally to $30.60, but I urge investors to focus on the weekly chart for gold bullion, and the stellar action of the oscillators in the momentum zone there.
- Please click here now. Gold looks like a bull era Pac-man, eating fiat at a bank collapse banquet. Let’s hope that all mining stock enthusiasts are sitting near the head of the table!
Thanks!
Cheers
St
About the author
