
Gold garnered a +2.0% net gain for the week in scrabbling back over 1700 to settle yesterday (Friday) at 1702. Indeed intra-week from low-to-high, Gold gained as much as +4.3% for the first two days, only to halve that in posting net declines these past three days. Regardless, 'twas Gold's first weekly close above 1700 since that ending 09 September, and the fifth-best weekly percentage net gain of the 21 up-weeks year-to-date.
Further, on the heels of last Saturday's gloomy Gold Update wherein was beached our 2254 high for this year, we then penned in last Monday's Prescient Commentary: "...Whilst Gold’s weekly parabolic Short trend remains suggestive of the upper 1500s trading, the daily parabolics flipped to Long per this session’s open, suggesting there being a move toward the mid-1700s: thus we've technical conflict between these two key Gold rhythms..." Either way, Gold nearly tapped 1740 as the week unfolded, price itself then getting folded.
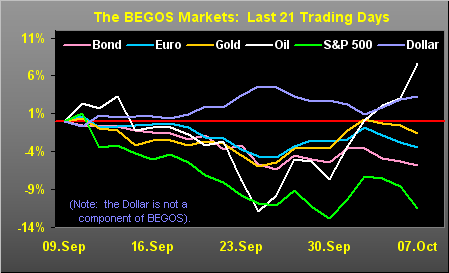
Gold is, of course, one of our five primary BEGOS Markets, all of which have been in positive correlation with one another for better than a month; (for you WestPalmBeachers down there, that means all five rise together and fall together). And as such, they are in negative correlation to the Dollar. Moreover, should the positive correlation of the BEGOS Markets stay intact, given we expect lower levels still for the S&P, that is at least near-term a Gold negative, contra to our title of price getting a bit of a grip. Here are the BEGOS Markets cumulative percentage tracks -- directionally rising and falling together -- from one month ago-to-date (the last 21 trading days). Note that in the latter part of this past week, Oil in response to OPEC+ moving to cut production, began to break away from the correlation :
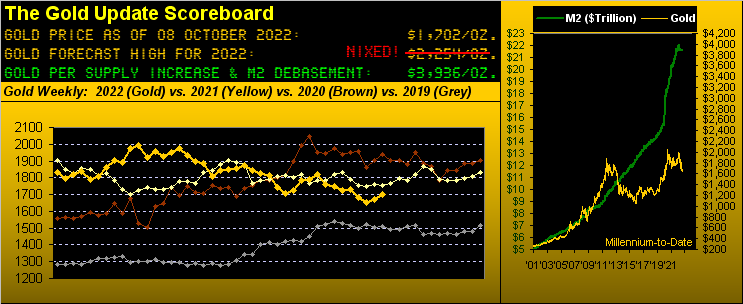
But specific to Gold, even as price (1702) remains massively shy of its currency Debasement valuation (3936), even as the U.S. money supply is today 2.3x what 'twas when Gold first reached 1702 (08 August 2011), and even as that doesn't begin to account for unfunded Debt and Derivatives, Gold nonetheless is being kicked about as the proverbial commodity football (rather than being embraced as real money).
To be sure, Gold just recorded a second consecutive up week for the first time since early August. But did your portfolio manager purchase Gold such as to increase your percentage exposure? Our guess is no. Likewise, did the purported evil scheming paper Gold price suppressors come to the selling fore these past few days? Our guess is yes. Rightly or wrongly guess-wise, today Gold is being traded in the commodity basket rather than in the jewel casket. Thus by such rationale, as we turn to Gold's weekly bars from a year ago-to-date, the red-dotted parabolic Short trend remains in place, albeit the price to flip such trend to Long has slipped below 1800 (to 1795). Yet because 'tis Gold, "Hope springs eternal" --[Alex Pope, 1734]:
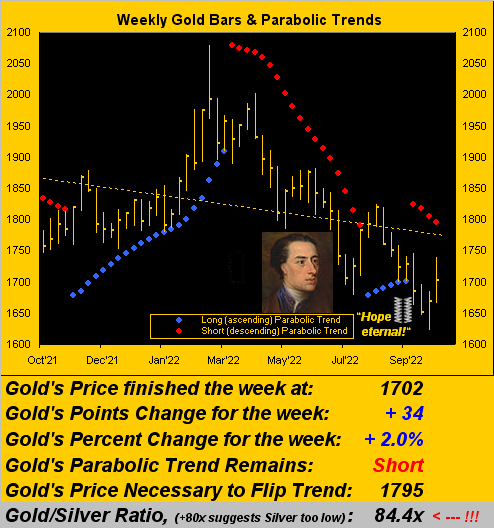
Thus until Gold benefits from the one-two punch of 1) portfolio managers actually increasing their clients' Gold exposure and 2) the desire of any paper price suppressors to sell their cheaply purchased Gold into higher levels, Gold remains"Goin' Nowhere"--[Chris Isaak, '95]. However, as our charter reader JGS would remind us: "Sumpthin's gonna happen"... perhaps a lot of simultaneous "sumpthins".
Still, from the "Preaching to the Choir Dept.", once Gold starts to rip, you'll be relieved to already own it. Remember: from 1975-to-date: Gold has recorded 24 quarterly net gains of +10% or higher and 12 annual net gains of +20% or higher. And the 3Ds of Debasement, Debt (the
We've mentioned the S&P; here's what in a word we see: down. As to specific levels, this is what you already know if a regular reader:
■ The S&P 500 is presently 3640, which is -24% below its all-time closing high of 4797 (03 January);
■ The 3600-3200 zone is technical support for the S&P; (we first targeted 3600 in May, followed by BofA's so doing in July, and then GS in September; puffing our chest perhaps, but "it is what it is");
■ The technical support zone belies the fundamental support, which by the S&P's price/earnings ratio suggests another return to its mean, that since the Index's inception in 1957 is now 22.4x;
■ The "live" P/E for the S&P is (if honestly calculated) 32.5% per yesterday's settle. That means if earnings don't actually grow (with Q3 Earnings Season just underway), to again engage the P/E's mean is a mathematical decline to S&P 2509.
"But c'mon, mmb, people are gonna say that's just way too low..."
That's not (yet) a prediction, Squire, rather just a statement of arithmetic fact. "Way too low" as 2509 may seem -- lest we forget -- just two years ago the S&P was at a COVID low of 2192 on 23 March 2020. And Squire, neither forget your studies in portfolio theory: the Wall Street back-of-the-napkin S&P yield calculation is to invert the P/E, which by its mean of 22.4x is 4.5% (versus today's actual 1.8%). What is today's Five-Year U.S. Treasury Note yield? 4.1%. Oh my goodness, how does that happen? We just told you. Perhaps the long-deserved spanking of investment banking finally is underway.
And yet through all of this angst, the Economic Barometer is holding its own, notably with respect to Q3 data thus far, (albeit Amazon -- the driver of the world economy -- is curtailing retail hiring). Here's the Baro:
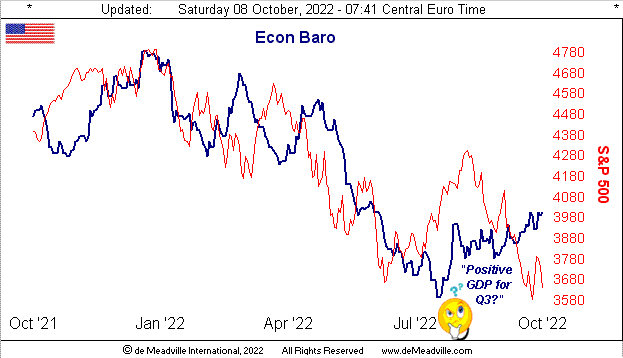
As we've previously noted, a positive Q3 Gross Domestic Product report on 27 October would declare the recession as "over", just 12 days before the StateSide mid-term elections. And regardless of one's view, since the dawn and proliferation of Austrian economics, the U.S. President is ultimately deemed responsible for the state of his (or soon her?) economy. A return to growth as carefully guided by President Biden would put both he and his party in the pound seats with the media in full cheer as
Speaking of the pound (sterling) as it hovers just above all-time lows to the U.S. Dollar, did you note that Fitch has joined Standard & Poor's in reducing the outlook on
Across the pond, the Federal Reserve (a private banking institution) has its leadership clamouring in unison that interest rates must continue to be raised in "damn the economy" adamancy so as to quell inflation. This now flies in the face of the United Nations pleading the Fed and other central banks to "STOP!" with respect to damaging economic output of the poorest of countries. And yet, the International Monetary Fund says "raise as you must" in order that inflation be bust. Add in other geo-political fears (i.e. UKR/RUS intensification, including this morning's "truck explosion" on the
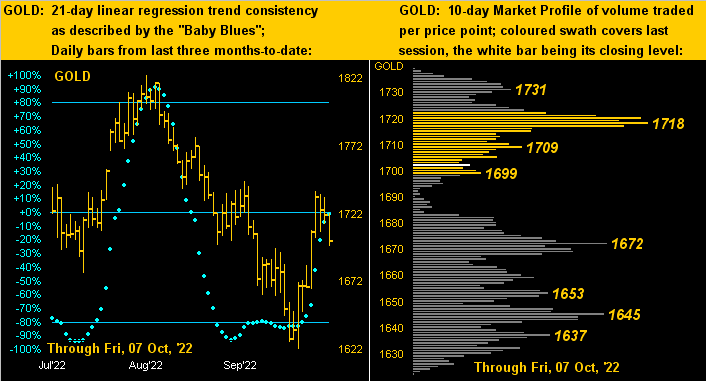
At least what had just been looking good until stalling are the precious metals. Here we've our two-panel Gold display featuring the past three months of daily bars-to-date on the left and the 10-day Market Profile on the right. As mentioned above, problematic for Gold is its positive correlation amongst the other BEGOS Markets, such that as the S&P continues to fall, the ebbing tide lowers all boats, barring the busting of such correlation (which always eventuates):
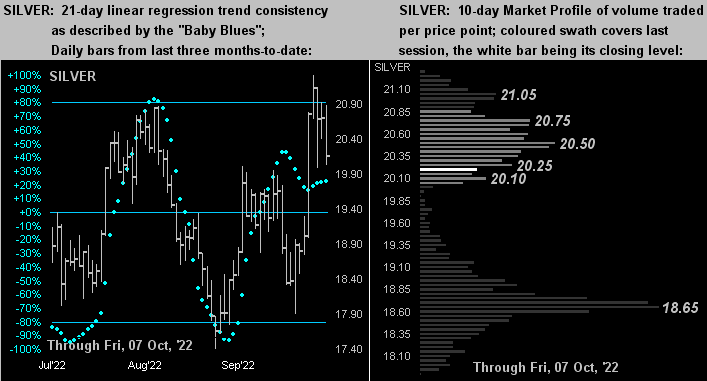
And here's the same display for Silver, her having made a lovely run of late (at left) but with a dearth of material pricing support down to her 18.65 apex (at right). Sister Silver can be a risky ride, but her return over Gold can better provide. To wit: a Gold run from here (1702) to the All-Time High (2089) = +23%; for Silver from here (20.16) to her All-Time High (49.82) = +147% ... so don't forget the Silver!
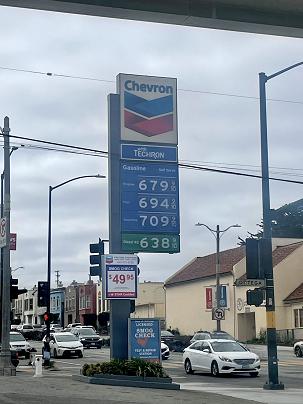
Finally to close ... and this is something we thought we'd never ever see:
It is common knowledge that gasoline is far less expensive in the
A family member just sent us a photo of a sign for shocking gasoline prices posted at a Chevron station inside the city of
Cheers!
...m...
About the author
