
“Gold Grabs Center-Stage as Stagflation Starts to Rage“
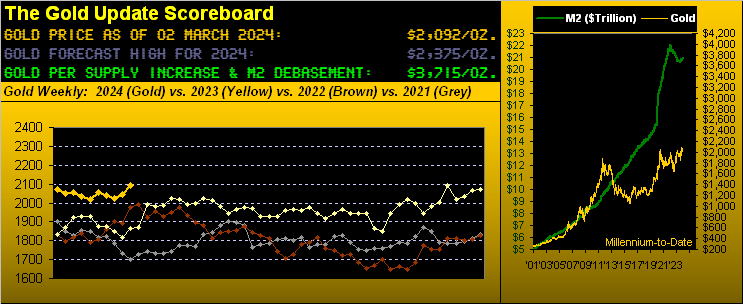
A bold title to head this recital, Gold on Friday posting its best low-to-high intraday gain (+2.4% or +50 points) since 13 December toward settling the week at 2092, essentially tying its highest-ever weekly closing price (with that recorded this past 01 December). To maintain perspective, Gold’s All-Time High remains 2152 (per last 04 December).
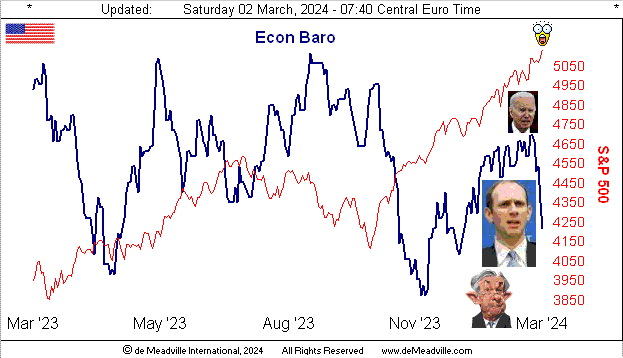
Credit Gold’s Friday flight with our Economic Barometer consumed by blight. Straightaway as the incoming metrics low-lighted economic decay, no sooner had we posted the Econ Baro just after the 16:00 (CET) barrage of negative data that Gold got the bid, the FinMedia in full throat for the Federal Reserve to cut rates. But as to inflation: ’tis going the wrong way!
So as succinctly set out in his 2008 tome “When Markets Collide”, one Mohamed El-Erian writes of stagflation as “a situation characterized by disappointingly low economic growth and high inflation.” Is such situation suddenly starting? From our bold title, let’s get straight to two bold graphics: first the economy and second inflation.
1) The Economic Barometer: just as ’twas all going great for the StateSide economy, the FinMedia consistently reminding us of the successes in having embraced Bidenomics, what just happened? In turning below to the Econ Baro from one year-ago-to-date, that rightmost vertical drop is its second-worst six trading-day plunge since this time a year ago. Should such reversal of fortune continue to work its way into the data for computing Gross Domestic Product, that’ll be El-Erian’s “disappointingly low economic growth” … ![]() “Whoomp! There it is!””
“Whoomp! There it is!””![]()
2) Inflation: the rampant FinMedia speculation as to the timing of the Federal Reserve cutting rates into rising inflation is one of the most oxymoronic concepts across the financial spectrum in our memory since dear old Dad taught us how to read the newspaper’s stock tables back in the 1960s. (The other two more glaring incongruities being the S&P 500 trading at double its historical earnings support and Gold trading at half its currency debasement valuation).
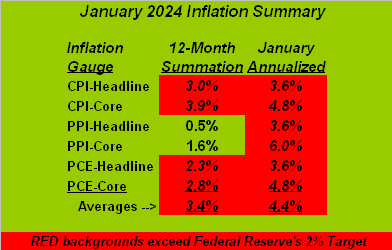
Increasing inflation, indeed. The retching selection of puke-green for the following table summarizing January’s key inflation measures is ever so appropriate. Therein are the six key StateSide inflation gauges as reported for January, their respective 12-month summations, and January’s pace annualized. Remember: the Fed’s annualized inflation target is 2.0%: every reading in this table above 2.0% is highlighted in red, the average readings now running from 3.4% to 4.4%. And there’s El-Erian’s “high inflation”:
To be a FedHead right now is fraught with trying to avoid making a “policy mistake”. Ostensibly-speaking, the Federal Open Market Committee is comprised of smart, intelligent folks, (yeah they’ve got the always-lovable Goofball Goolsbee in there); but the FOMC candidly know in their souls that inflation is going the wrong way. To cut rates is to further stimulate inflation even as economic data deteriorates. The FinMedia comprehensively expect the Fed to cut; and the Fed has to now deal with the confidence (or lack thereof) of “How can we fool ’em today?”
Therefore: this one-two bold combination of the Econ Baro’s sudden distress and inflation frustration is not a pretty picture.
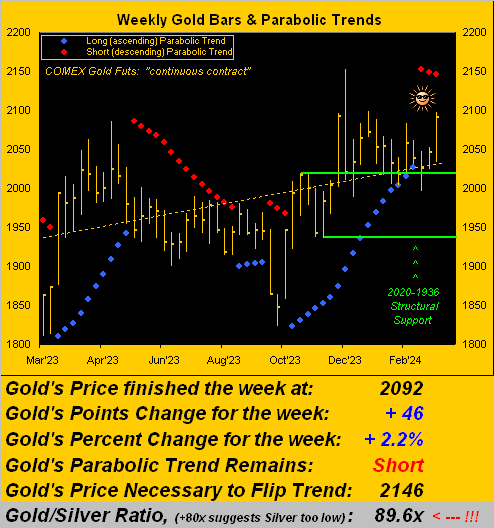
As to Gold finally getting a bid, ’tis delightfully satisfying to see price bucking its weekly parabolic Short trend. Even given our expectations for Gold to succumb to said trend which was confirmed three weeks ago, price essentially has gone nowhere but up, and we thus revel in the joy of being wrong, at least to this point. For as you can next see in our year-over-year graphic of Gold’s weekly bars, price at present has moved well up and away from the underlying 2020-1936 green-bounded structural support zone:
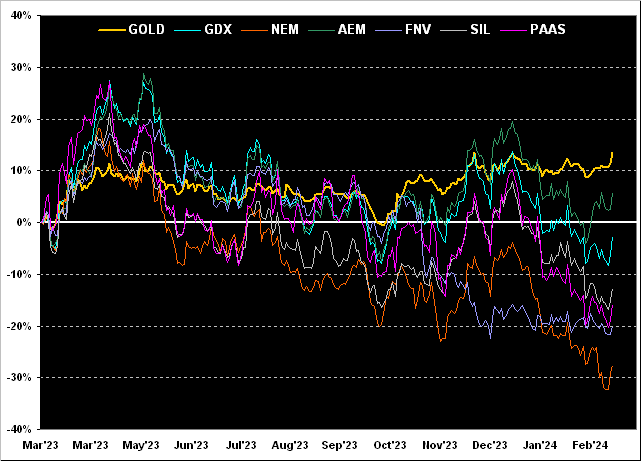
‘Course what really continues to stand out for us is the lagging performance of the precious metals’ equities. It being month-end (plus one trading day in March), here also year-over-year are the percentage tracks of Gold and those of its key equities brethren. From worst-to-first they rank as follows: Newmont (NEM) -28%, Franco-Nevada (FNV) -20%, Pan American Silver (PAAS) -16%, the Global X Silver Miners exchange-traded fund (SIL) -13%, the VanEck Vectors Gold Miners exchange-traded fund (GDX) -3%, Agnico Eagle Mines (AEM) +6%, and Gold itself +13%. So out of favour remain the equities! (Nudge-nudge, wink-wink, elbow-elbow…):
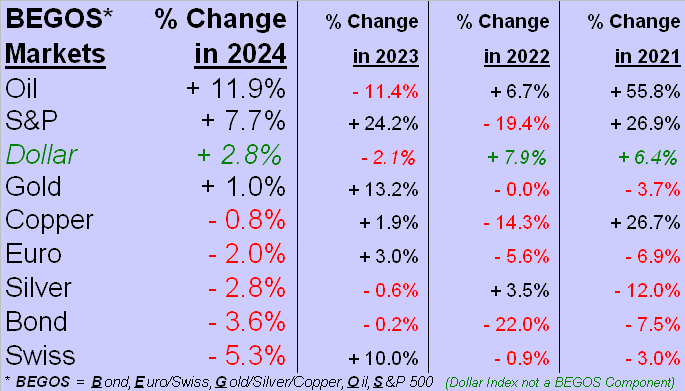
As for 2024’s brief stint year-to-date, despite Gold’s Friday upstate, price so far hasn’t done that great. For in turning to the BEGOS Markets Standings to this point of the year, Gold is up but a wee +1.0%, (even as the Dollar Index is +2.8%, but as you know, Gold plays no currency favourites). Topping the podium at present is Oil, +11.9% followed by the “Casino 500” +7.7%. Indeed specific to the S&P, through the first 42 trading days of this year, that +7.7% gain ranks second only to 2019’s stint (+11.4%) across the same number of days. But there’s a glaring difference between ![]() “Now and Then””
“Now and Then””![]() –[The BeaTles, ’23]. Then the “live” price earnings ratio of the S&P 500 was 30.6x (yield 2.054%). Now ’tis 46.5x (yield 1.400%.). Three-month risk-free dough then? 2.375%. And now? 5.215%. Yet you’re still in the stock market? Sheer guts. Regardless, as the fuse burns off, let’s get to the Standings before the whole thing blows up:
–[The BeaTles, ’23]. Then the “live” price earnings ratio of the S&P 500 was 30.6x (yield 2.054%). Now ’tis 46.5x (yield 1.400%.). Three-month risk-free dough then? 2.375%. And now? 5.215%. Yet you’re still in the stock market? Sheer guts. Regardless, as the fuse burns off, let’s get to the Standings before the whole thing blows up:
Too, how about Q4 Earnings Season for 2023 which just finished yesterday (Friday). Within that calendar window, 457 of the S&P 500’s 503 constituents reported their results: only 273 (60%) improved over Q4 of 2022. Out of the past 27 quarters, this most recent one ranks ninth-worst as four in ten of the best and brightest from the equities world couldn’t increase their earnings. And yet the S&P now sits at an all-time high (5137)? What is going on? Indeed, we’ve now the Index as 30 consecutive trading days “textbook overbought”.
“And, mmb, it seems like the S&P keeps going up on the same news again and again…“
‘Tis quite diabolical that, Squire. These days, the S&P 500 goes up on anything, even if ’tis already priced-in a billion times over.
‘Course the precious metals relative to currency debasement remain stubbornly cheap. Vis-à-vis our opening Gold Scoreboard, priced today at 2092, Gold is -42% below its U.S. “M2” money supply debasement value of 3715, even in accounting for the creeping increase in the supply of physical Gold, (today 213,056 tonnes). And with the Gold/Silver ratio now 89.6x, to “right it” to the century-to-date average of 68.1x puts Silver (currently 23.35) up an additional +24% to 30.72. Further, were Gold priced today at that Dollar debasement value of 3715, applying that average ratio puts Silver at 54.56 … just in case you’re scoring at home. Again, do not forget the Silver.
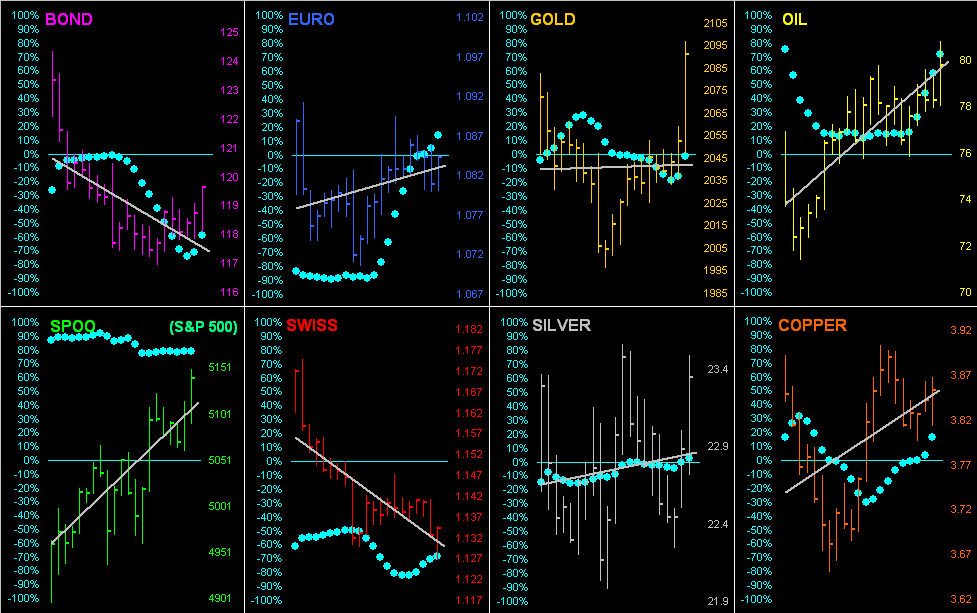
And as we go ’round the horn for all eight BEGOS Markets by their daily bars from 21 trading days ago-to-date (one month), both Gold and Silver per Friday sport impressive price spikes. Still by the baby blue dots, the precious metals continue to lack trend consistency:
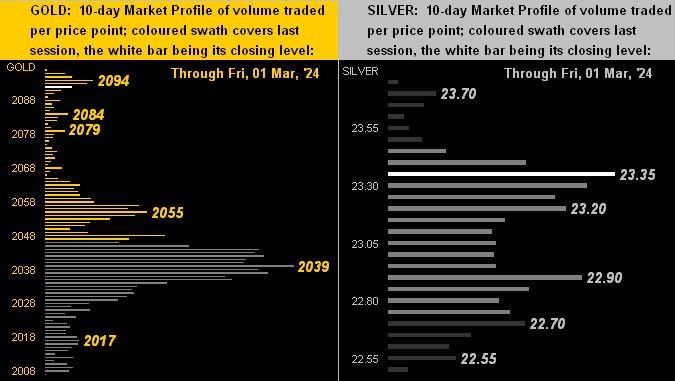
Next for both Gold on the left and for Silver on the right we’ve their respective 10-day Market Profiles. Silver’s stack looks a bit more protective by its underlying bars, whereas Gold which moved swiftly over less recently-priced territory appears more porous:
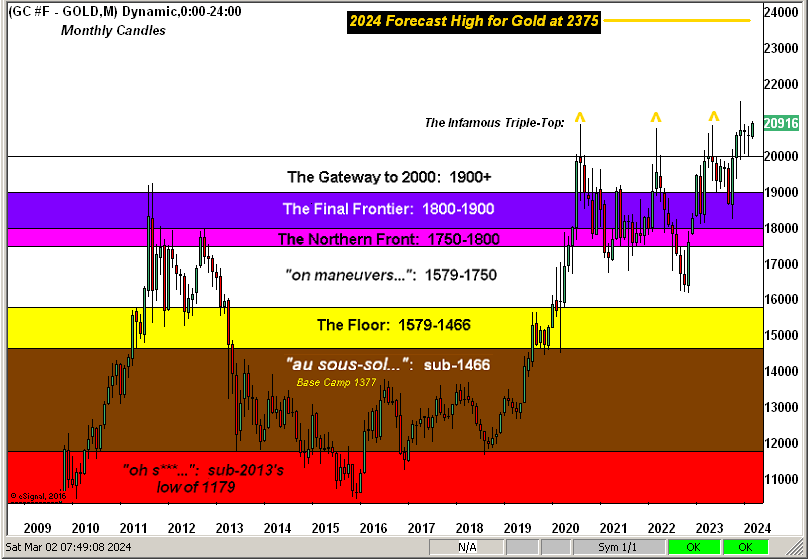
Finally it being month-end plus a day, here we’ve the broad view of Gold’s strata-defined structure across the past 15 years, our 2024 forecast high sitting up there at 2375. That rightmost candle is 01 March alone:
To sum it all up for this week, we’ve emphasized the Fed having to face what appears as the early machinations of a stagflating economy, a “damned if they do, damned if they don’t” scenario. Despite all the FinMedia blather about inflation being tamed — given we instead do the math — ’tisn’t. Our puke-green table with the red 2.0% overages ought be on every news desk in the nation and ’round the world. (But as is sadly typical, the truth wrecks the narrative). And as for the suddenly slipping economy, 13 metrics hit the Econ Baro next week, of which just five “by consensus” are supposed to show period-over-period improvement.
Thus as the cost to survive goes on the rise whilst that upon which you rely slips by, ’tis probably a good idea to have a little Gold! Or a lot of Gold!
Cheers!
…m…
www.TheGoldUpdate.com
www.deMeadville.com
and now on “X”: @deMeadvillePro
About the author
