
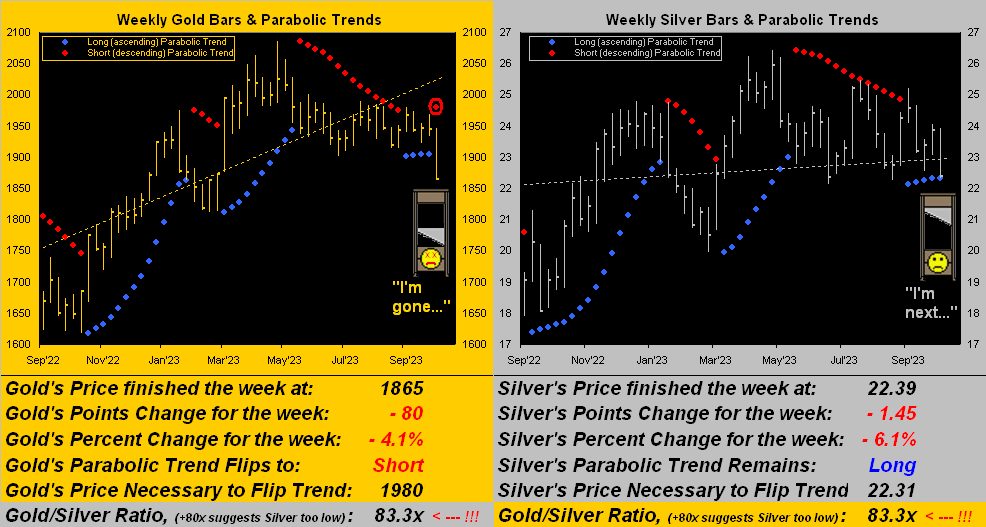
We start by paraphrasing this oft-misquoted line from American TV icon Desi Arnaz: “mmb, you’ve got some ‘splaining to do!”, even as our two previous missives entitled Gold as being “Technically Torturous” and “The Torture Continues”. Following which — at precisely 13:40 GMT this past Wednesday — Gold succumbed to the guillotine in penetrating the week’s parabolic protection at 1905.2, provisionally flipping such trend from Long to Short, in turn confirming so with price settling yesterday (Friday) at 1865. In fact, you may recall that such guillotining was presciently previewed in our prior missive’s graphic of Gold’s weekly bars. And so it came to pass that 28 weeks of net gain for Gold are now gone, (albeit such trend for Silver is still barely Long, but likely shan’t be come Monday’s open). Here’s the updated dual panel graphic:
“That’s a gruesome graphic there, mmb…”
Sadly so, Squire, wherein we see at left Gold’s red-encircled parabolic dot confirming such trend having swung from Long to Short, whilst at right Silver’s Long trend is but 8¢ from the end, the guillotine in top gear as the Dollar Revolution continues.
In reaching this past week to as high as 106.540, ’twas the best level for the Dollar Index since 30 November of a year ago, (Gold settling that day at 1783 … but let’s not go there). Today at 105.870, the plucky buck is but -18% below its historical high of 129.050 upon its futures’ inception away back on 20 November 1985. And were that gap to close, U.S. interest rates shall be far higher still, the FedFunds rate back then being 8.05% versus today’s 5.50%.
Yet that noted, just yesterday the Bureau of Economic Analysis reported the Federal Reserve’s favourite inflation gauge for August, the pace of the Core PCE Price Index coming in at a rather benign +0.1%, which annualized is well below the Fed’s +2.0% target. Shall the Fed’s Open Market Committee therefore vote to again “pause” come their 01 November Policy Statement?
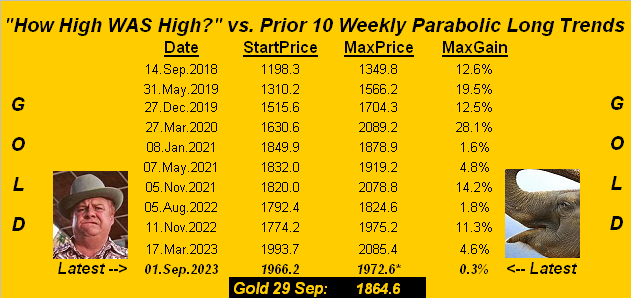
Regardless, as depicted above, Gold’s weekly parabolic Long trend never got off the pause button, was executed, and is now Short. And recall when said Long trend began a month ago, we were looking toward a fresh All-Time High show. Instead from Gold, out went the dough. Here’s our updated table of Gold’s ten prior weekly parabolic Long trends, plus the latest’s zero result across the bottom. As Sheriff J.W. Pepper said to the elephant in “The Man with the Golden Gun” –[Eon/UA, ’74]: “Boy, you is ugly”:
Understandably, you now may well ask “So how low is low?” There we shan’t go, save for some structural support from this 1865 level down to 1813 built in early March. And whilst conventional wisdom points to “Dollar strength” as the yellow metal’s culprit, we again hearken back to a Gold truism: that it plays no currency favourites. Simply recall the 2010 six-month stint wherein from January through June the Dollar Index gained +10% and Gold +13%. Boom! It does happen.
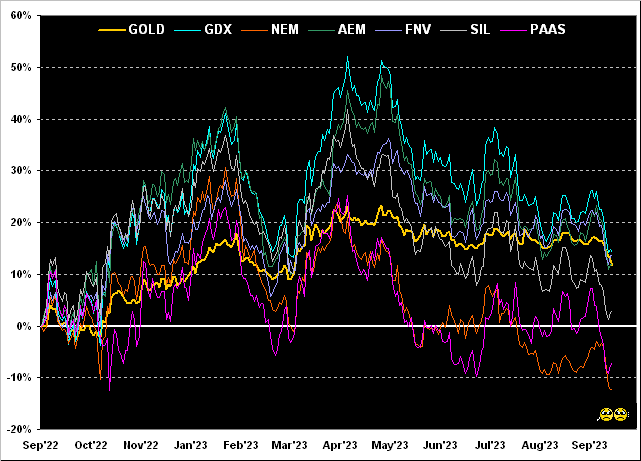
Still since mid-year, Gold and its equities brethren have been pressured. It being month-end, here’s our year-over-year view of those elements’ percentage tracks depicting the VanEck Vectors Gold Miners exchange-traded fund (GDX) +14%, Franco-Nevada (FNV) +13%, Gold itself along with Agnico Eagle Mines (AEM) +12%, the Global X Silver Miners exchange-traded fund (SIL) +3%, Pan American Silver (PAAS) -7%, and Newmont -12% (as we know encompassing acquisition costs). But again from mid-way, this hardly is the happiest chart in the house:
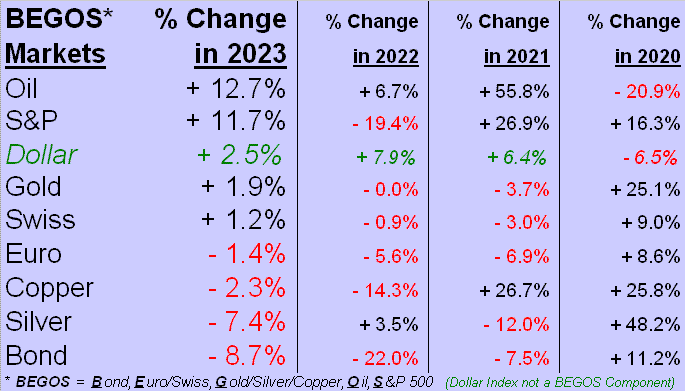
Month-end also means bringing up our year-to-date standings of the BEGOS Markets. And atop the stack for the first time in deplacing the S&P 500 to second spot is Oil. Rounding out the podium is the Doggy Dollar, (although because ’tisn’t a BEGOS component, we can still say Gold is in third position). Properly the cellar dweller is the Bond as the Year of the Yield continues:
Specific to the second-place S&P 500, clearly it struggled through the oft seasonally-challenged month of September. But more importantly, are both Wall Street and the FinMedia finally waking up to valuation reality? More on that in our closing paragraph(!) As for economic reality, here’s the StateSide Econ Baro from one year ago-to-date, replete with its mega yo-yo swerves and curves:
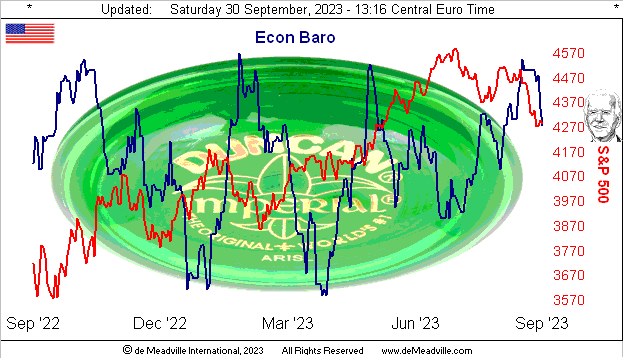
“Yo, Joe! Which way does it go?” For this past week’s set of 12 incoming metrics, eight were worse period-over-period and one was “unch”, thus leaving just three that improved, including August growth in both Personal Income and Durable Orders. But the month’s real stinker was Home Sales, both New and those listed as Pending. And pity the poor Chicago Purchasing Managers Index: its September reading of a paltry 44.1 marks the 13th consecutive month of regional economic contraction. “Go Bears…”
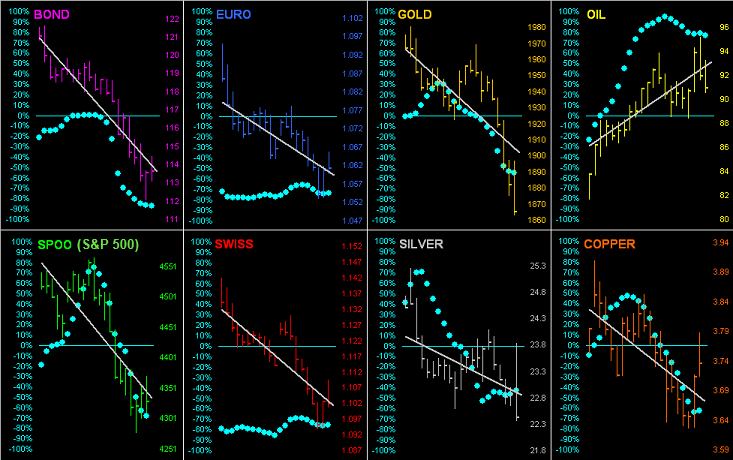
Speaking of “Go” — save for Oil — going down through September was the continued direction for the balance of the BEGOS Markets, (as ’twas the case back on 12 August when we penned “Ain’t Just Gold Been Headin’ Down…”). Nearly everything gets sapped during “Dollar strength”, but again its yield is decent, the three-month U.S. T-Bill paying an annualized 5.300% per yesterday’s settle. And that’s risk-free dough, (even if DC is closed). Either way, let’s go ’round the horn for all eight BEGOS components by their daily bars from one month ago-to-date, Oil being the sole market sporting a rising trendline, albeit its baby blue dots of trend consistency are weakening as we tweeted (@deMeadvillePro) earlier in the week:
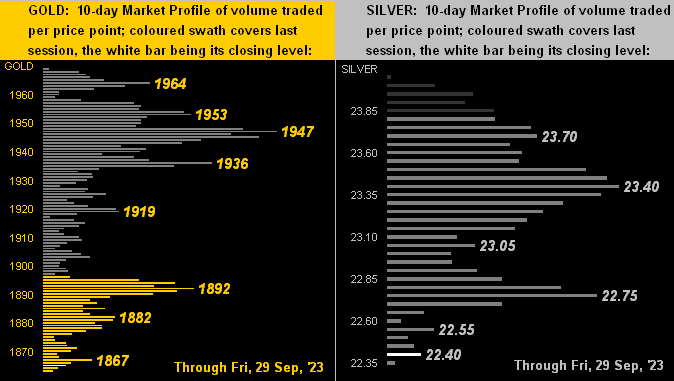
As for the precious metals’ 10-day Market Profiles, obviously we find their respective present prices (the white bars for Gold below left and for Silver below right) down in le panier de la guillotine, the yellow metal alone having lopped off some -100 points in just eight days. Within the overall Profiles, Gold’s high-to-low is -5.4% whilst that for Sister Silver is -7.3%.
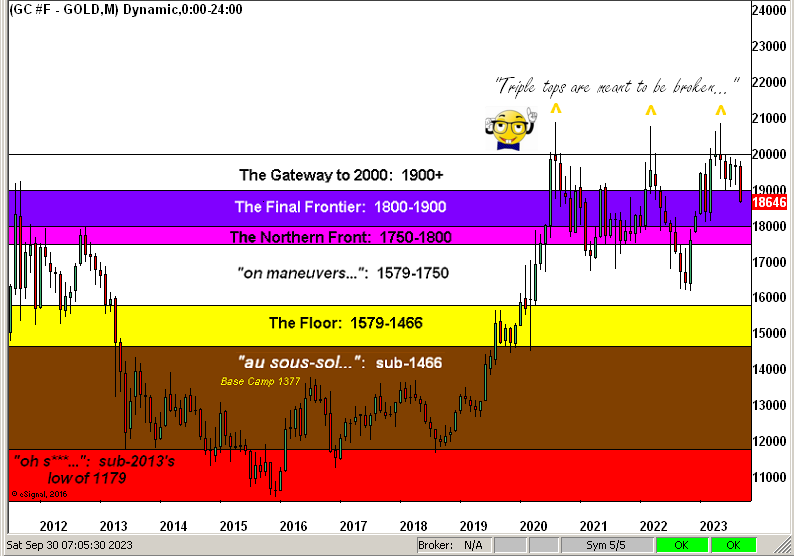
Again as ’tis month– indeed quarter –end, here we’ve the stratified view of Gold’s Structure per the past dozen years-to-date, its triple-top axiomatically waiting to break:
To close, per our aforementioned tease, here we go courtesy of the “Where Have You Been These Last Four Years? Dept.”
Regular readers know — and notably so since 2019 — we’ve been constantly concerned as to the overvalued state of equites, especially the S&P 500 Index as a whole. Oft we’ve quipped that we’re in “The Investing Age of Stoopid” purely by doing the honest math to compute the S&P’s price/earnings ratio, presently 37.7x as opposed to the parroted, dumbed-down 24.5x believed by your broker, (who frankly today appears incapable of doing the math). But that’s where we are now. And as we herein have written ad nauseum through these recent years: “…earnings are not supportive of price…”
Well here it comes… READY?
This past Wednesday the lightbulb finally illuminated in the children’s writing pool over at Barron’s, headlining their webpage “above the fold in bold” with:
“The Stock Market Has a Big Problem. It’s Called Earnings.”
They’re just figuring this out now???
And yet when we view our MoneyFlow page for the S&P 500 — even during its current decline — true “fear” has yet to appear.
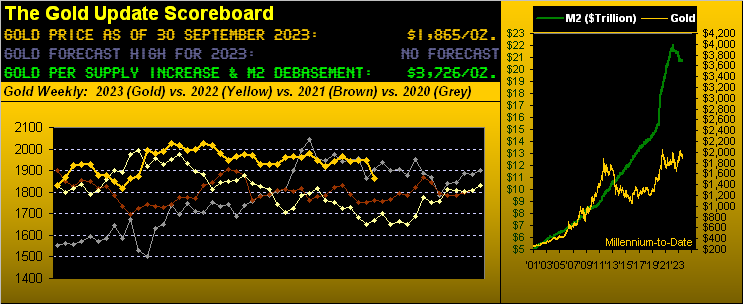
But what appears most appealing to us is Gold being priced today (1865) at just half its Dollar debasement value (3726) per our opening Gold Scoreboard.
Thus — precious metal guillotines and Dollar Revolution aside — in strolling along life’s path, what ought you have glowing in your vault? Gold!

Cheers!
…m…
www.TheGoldUpdate.com
www.deMeadville.com
and now on Twitter(“X”): @deMeadvillePro
About the author
