
A lift in the gold price is welcome news to gold investors, after a topsy-turvy first two quarters saw the precious metal retreat to a one-year low of $1,686 per ounce on March 31.
Gold has also recovered from its June doldrums when it lost over $100 in a week, leading to its worst month in over four years. The poor price performance was due to a stronger US dollar, which posted its best month since March 2020; investors selling their bullion-backed exchange-traded funds; and the US Federal Reserve moving forward its forecast for interest rate hikes, amid inflation concerns.
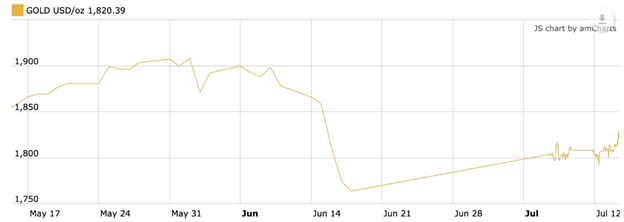 One-year spot gold. Source: Kitco
However on Wednesday, July 14, gold prices kicked higher following dovish comments from US Federal Reserve Chair Jerome Powell.
At time of writing, spot gold was changing hands at $1,826 per ounce, a gain of $18.70 from Tuesday’s trading session. Gold futures were also up, with the price for August delivery increasing by $17.30, or 0.96%, to $1,827.20.
Speaking to a House committee, Powell said the US economic recovery hasn’t yet reached the point when the Fed could scale back its $120 billion monthly asset purchases. As for the dreaded interest rate hikes, Powell reportedly said that conditions to triggers a policy shift “are still a ways off.”
His comments helped to ease concerns that faster than predicted US inflation data could see the central bank taper its monetary stimulus sooner than expected.
Gold generally loses out to bonds and other income-yielding assets, when interest rates and Treasury yields rise, given that the metal pays neither a yield nor a dividend.
On the flip side, investors often choose bullion over stocks and bonds, when real interest rates “turn negative” and a country’s debt to GDP ratio increases beyond a sustainable level.
Both situations are prevalent today, helping to fuel what could be the next leg up in the gold price.
Negative real rates
Several factors influence gold prices (mainly the US dollar, gold ETF inflows/ outflows, inflation rate, bond yields, safe haven demand, physical gold demand, gold supply) but none is more reliable than real interest rates.
The demand for gold moves inversely to interest rates — the higher the rate of interest, the lower the demand for gold, the lower the rate of interest the higher the demand for gold.
The reason for this is simple, when real interest rates (interest rate minus inflation) are low, at or below zero, cash and bonds fall out of favor because the real return is lower than inflation. If you are earning 1.6% on your money from a government bond, but inflation is running 2.7%, the real rate you are earning is negative 1.1% — an investor is actually losing purchasing power. Gold is the most proven investment to offer a return greater than inflation, by its rising price, or at least not a loss of purchasing power.
Bond market and gold market observers keep a close eye on US Treasury yields, particular the yield on the benchmark 10-year note. This is because the 10-year serves as a proxy for other financial products, such as mortgage rates, and it also signals investor confidence. When there is low confidence in the economy, people want safe investments, and US Treasuries are considered among the safest.
We can see the inverse relationship between negative real interest rates and gold, by charting the gold price and the 10-year Treasury’s yield after inflation.
In an article titled ‘The Golden Dilemma’, authors Claude Erb and Campbell found a near-perfect negative correlation of -0.82 (-1 being a perfect negative correlation) between real interest rates and gold prices between 1997 and 2012.
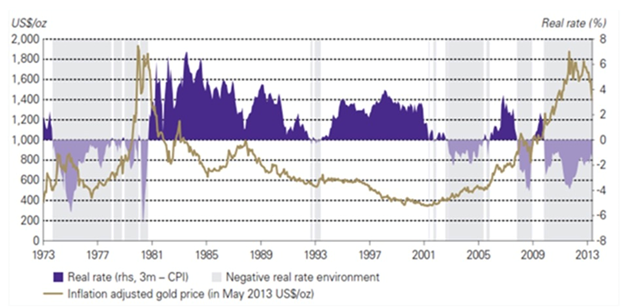 Historical real rate of inflation versus gold
In the FRED chart below, notice that the gold price between 2013 and 2020 never gets above $1,400, corresponding to the period when the real yield on the 10-year is between about 0% and 1%. However, when real yields “go negative,” as they did around 2011-13, and in 2020, gold prices jumped.
Last year’s 22% annual increase in the gold price was due to pandemic fears, combined with a low US dollar and plunging Treasury yields, causing real yields to go negative even though inflation stayed below 2%.
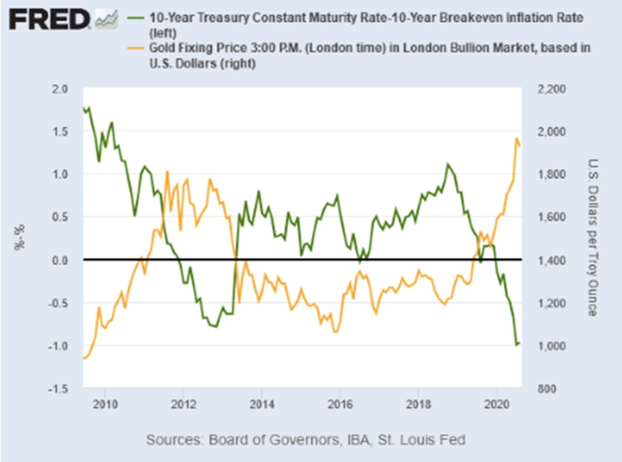 Gold prices jump when real yields “go negative,” as they did around 2011-13, and in 2020.
2020’s dramatic bond rally drove down yields across the world. On March 8, 2020, the US 10-year Treasury note reached an all-time low of -0.38%; two days earlier the German “bund” fell to a record -0.74%.
Investors piled into sovereign debt based on expectations of monetary stimulus like financial crisis-era easing programs that pushed down interest rates to zero and sparked a multi-year rally in stocks.
The dip in the gold price earlier this year correlated to an increase in US Treasury yields, as bond investors rotated funds into more risky assets like stocks. This caused bond prices to fall and yields to rise.
However, as we stated then, this trend has already been proven transitory. Real interest rates are currently negative and have been for some time. The benchmark 10-year Treasury yield rose to 1.73% in April, amid inflation concerns, but since then, the yield has dropped to 1.3%, while the inflation rate has risen to 5.4%, as of June, leaving a negative real yield of -4.1%!
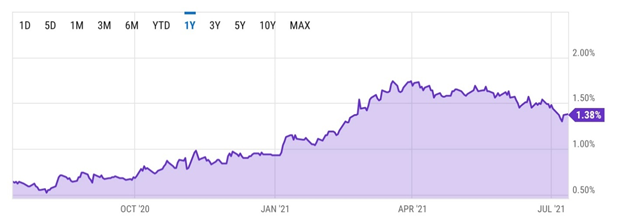 10-year US Treasury yield. Source: YCharts
That’s worth repeating – real interest rates have a negative yield of -4.1%.
We believe this theme of rising inflation and falling rates is going to continue and will only get worse, for bond investors, or better, for those holding gold and gold stocks. The Fed’s official line is that inflation is only temporary, however we see things differently.
Inflation
Inflation can mean either an increase in the money supply or a rise in price levels. Loose monetary policy such as we see being practised by the US Federal Reserve currently, ie., money-printing to pay for pandemic-related spending, along with monthly asset purchases, thus creates a risk for inflation.
The Wall Street Journal reported in May that the US consumer price index (CPI) surged in April by 4.2%, the most in any 12-month period since 2008, as economic activity picked up but was constrained in some sectors by supply bottlenecks.
The pandemic has put tremendous pressure on supply chains, and the prices of many agricultural commodities such as grain, corn and soybeans, have skyrocketed. Several industrial metals have enjoyed significant price gains, too, including copper, zinc and lead.
This is due to a number of reasons including demand from China, the world’s largest consumer of commodities whose economy grew at a blistering 18% in the first quarter.
US economic data published on Wednesday showed that prices producers paid for raw materials gained more than forecast in June, mirroring the CPI, which as stated rose 5.4% in June. Airline fares, cars & trucks, rent, and services hit hard by the pandemic that are seeing customers return, are among items that have gone up.
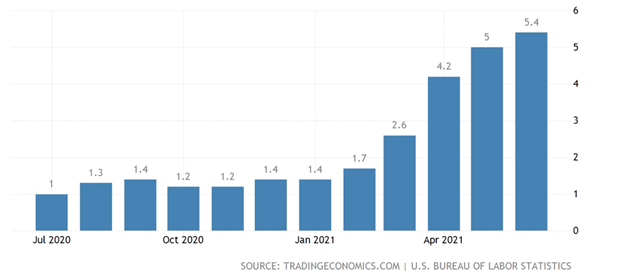 US inflation, one-year
According to a July 13 article in the Wall Street Journal, Rising prices reflect robust consumer demand boosted by widespread vaccinations, the ending of many business restrictions, trillions of dollars in federal pandemic relief and ample household savings. Stronger demand also has pushed employers to seek more workers and pay higher wages, as they struggle to hire.
The Journal notes that many policymakers expect there to be “several months of robust inflation after a year of anemic price pressures during the peak of the pandemic,” (we agree) and quotes a survey by the National Federation of Independent Business, stating that “47% of small businesses indicated that they raised average selling prices in June, the highest share since 1981.”
The US Federal Reserve has already said it will tolerate inflation above the normal 2% target, and let the economy run hotter before stepping in to cool it with rate hikes. The latest numbers show the US economy growing at 9.1% on an annualized basis in the second quarter, which would be the economy’s best year since the early 1980s. (of course, this is only impressive due to the so-called “base effect”, referring to the large difference between the low prices of a year ago when much of the economy was in lockdown, and current higher prices)
Debt to GDP ratio
There is a historically close correlation between gold prices and debt to GDP. The higher the ratio, the better it is for gold.
The debt-to-GDP ratio is an important metric economists use for comparing a country’s total debt to its gross domestic product (GDP).
The percentage arrived at by dividing the country’s total GDP by its total debt indicates the country’s ability to pay back its loans. The higher the percentage, the higher the risk of a country being unable to pay the interest on its debt, and therefore defaulting on its debt. (countries with high debt-to-GDP ratios typically have trouble paying off debts. Because they are a higher risk to paying loans back, creditors demand higher interest rates. If a country’s debt-to-GDP ratio becomes too extravagant, creditors may stop lending to it altogether)
While debt defaults are rare, they can and do happen. In 2010 the European Union faced a crisis when Greece threatened to default, potentially causing a domino effect, of highly leveraged nations like Spain and Italy doing the same, which likely would have destroyed the European Union, and the euro.
The US government spent $4.5 trillion on pandemic-related relief, helping to boost the national debt to $28 trillion in under a year.
In October 2020, the debt zoomed past 100% of GDP, for the first time since the Second World War, but that was just the beginning.
The Congressional Budget Office (CBO) is projecting that with all of this year’s spending, the national debt in 2021 could balloon to $35 trillion!
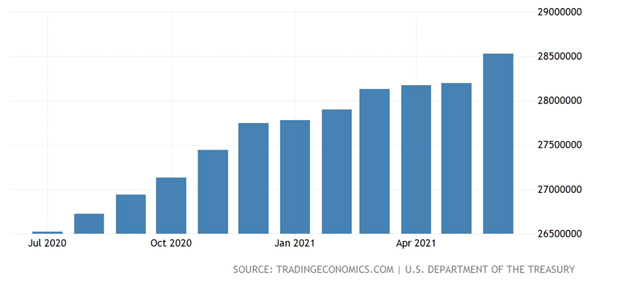 US national debt over the past year
(Adding the $1.9T covid relief bill to the $4.5T already spent gives $6.4T, plus the more than $8T the Fed has on its balance sheet leaves roughly $14 trillion, or half the national debt. This doesn’t include President Biden’s scaled-down $600 billion infrastructure bill nor the very recent $3.5T spending deal reached by Senate Democrats, targeting Medicare, climate change and other parts of Biden’s economic agenda.)
This new spending, which would be unprecedented, is in addition to the loose monetary policy that is being followed by the Fed, meaning continued $120 billion asset purchases to increase the money supply, and keeping interest rates close to zero. So far, the Fed creating money literally “out of thin air” has added about $4 trillion to its balance sheet since covid-19 hit.
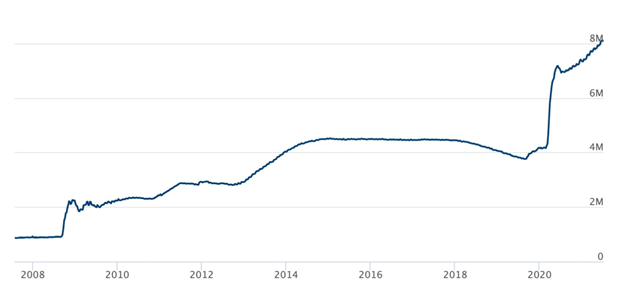 Total assets of the US Federal Reserve. Source: Federal Reserve
Thus, we have monetary easing happening at the same time as fiscal spending “carte blanche” (remember Biden believes strongly in the power of the state to tax and spend. A long wish list waits to be filled, with little to no concern regarding the already out of control $28.5 trillion national debt, courtesy of Modern Monetary Theory, or MMT)
By 2031 the CBO predicts debt to GDP will hit 107% and by 2051, as deficits grow and interest rates eventually rise, the ratio could reach 202%. At that rate, for every dollar the US economy produces, $2 is borrowed!
Low rates have clearly been a significant enabler of sky-rocketing debt. S&P Market Intelligence notes that despite public debt more than doubling between 2010 and 2020, interest costs only grew 26%, from $414B to $523B. With net interest just 1.6% in 2020, compared to 3% in 1985, the cost of the national debt is half what it was 10 years ago.
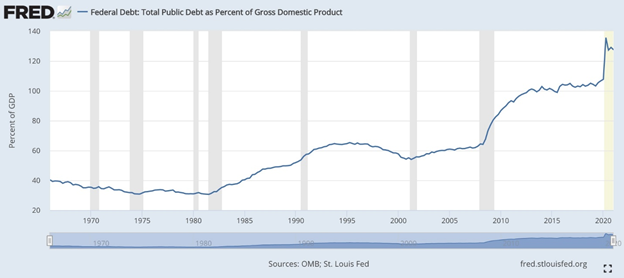 US debt to GDP ratio since 1970
Also, QE’s success in holding down yields has eliminated the US Federal Reserve’s maneuvering room. The Fed must continue quantitative easing to monetize the issuing of Treasuries, which are needed to fund deficits, states S&P.
Forbes reported on March 10 that the US budget deficit continues to soar to unprecedented levels — with the gap between spending and revenues widening to more than $1 trillion in the first five months of the 2021 fiscal year. (by comparison, the deficit was $1 trillion before covid)
The US debt problem extends to other countries. A recent Wall Street Journal article states that global government debt has reached the highest level since the Second World War, surpassing annual economic output.
Among debtor nations, the Journal counts the United States, whose budget deficit this year will top $3 trillion for the second straight year; Japan, whose central government debt is likely to surpass a quadrillion yen, or nearly US$10 trillion; and “perennial debt champion Greece,” where investors are accepting even lower yields on Greek bonds than on US Treasuries. (why anyone would buy a government bond for less than 1.3% interest when inflation is running at 5.4%, is beyond me)
It’s interesting to read the article contrasting the current debt pile being amassed mostly by developed economies that are spending their way out of the pandemic (even India is jumping on the debt train), and the aftermath of the financial crisis, when many countries switched from stimulus to deficit cutting:
Greece’s traumatic crisis, which nearly forced the country out of the eurozone, seemed to highlight the risks of debt. Now, even Greece is finding that it is possible to ratchet up debt, thanks to low borrowing costs that the European Central Bank helps to keep in check.
“The change is that there is no obvious ‘sinner,’” said former Italian finance minister Pier Carlo Padoan, now chairman of Italian bank UniCredit. “After the financial crisis, there was a blame game. Covid was an exogenous shock. A huge policy response was necessary.”…
Almost all economists agree that government debt cannot rise forever without causing trouble. There is also widespread agreement that high levels of debt can be safe if it is inexpensive, perhaps higher than was conventionally thought 20 years ago. The $90 trillion question is how high it can go.
“There are still limits to government debt,” said [Paul] De Grauwe, [a London School of Economics professor and one of Europe’s most prominent economists]. “They are just much further out than we used to think.”
Conclusion
A mountain of debt may be the new normal amid the current low-interest rate environment and profligate spending by developed-world governments, but that doesn’t change historical trends regarding the gold price. If the United States (and Canada) continues to rack up its national debt, policymakers will need to grow its economy at an alarming rate, consistently, year after year, to avoid a rise in its debt to GDP ratio which has already passed 100% (in Q1 2021 it was 127%).
Gold historically benefits from a rising debt to GDP ratio and we see no reason why this shouldn’t continue. Gold, being a hedge against inflation, which typically accelerates when the money supply increases, has done very well under periods of quantitative easing, when central banks literally “print money” to purchase sovereign debt instruments (like US Treasuries) and mortgage-backed securities. The Fed’s balance sheet had doubled since covid-19 began, and Fed Chair Jerome Powell says that conditions to trigger a policy shift (ie. taper monthly asset purchases and/or hike interest rates) “are a ways off”. Until that policy shift happens, it’s all good for gold.
Frankly I’m a little surprised that gold hasn’t yet resumed the bull run which started in 2020. Economic conditions have obviously improved, which typically dents gold, but with real rates at -4%, bonds, savings accounts, GICs, etc., will all result in a loss of purchasing power over time.
Also, gold and silver are the best defensive commodities to own when the prices of goods and services become more dear. The yellow metal is the ultimate store of value, proven to have held its worth over time, unlike fiat currencies which are subject to inflationary pressures and over the years, lose their value.
Due to an increase in inflation every decade except the 1930’s, the US dollar has lost 90% of its purchasing power since 1950.
Gold, on the other hand, has gone from $35 in 1970 to $1,825 in 2021, a 52X increase!
Given, therefore, the likelihood of a weak US dollar (many believe that the dollar, which fell to a 2.5-year low last year, will continue to face downward pressure in 2021 regardless of economic recovery), higher inflation owing to massive government stimulus and continued quantitative easing from the Fed and other central banks, and interest rates likely to stay low for the next couple of years, we think there is a strong case for taking a position in gold right now.
More so considering that gold juniors, which offer the best leverage to rising metals prices, are on sale.
Richard (Rick) Mills
aheadoftheherd.com
Legal Notice / Disclaimer
Ahead of the Herd newsletter, aheadoftheherd.com, hereafter known as AOTH.
Please read the entire Disclaimer carefully before you use this website or read the newsletter. If you do not agree to all the AOTH/Richard Mills Disclaimer, do not access/read this website/newsletter/article, or any of its pages. By reading/using this AOTH/Richard Mills website/newsletter/article, and whether you actually read this Disclaimer, you are deemed to have accepted it.
Any AOTH/Richard Mills document is not, and should not be, construed as an offer to sell or the solicitation of an offer to purchase or subscribe for any investment.
AOTH/Richard Mills has based this document on information obtained from sources he believes to be reliable, but which has not been independently verified.
AOTH/Richard Mills makes no guarantee, representation or warranty and accepts no responsibility or liability as to its accuracy or completeness.
Expressions of opinion are those of AOTH/Richard Mills only and are subject to change without notice.
AOTH/Richard Mills assumes no warranty, liability or guarantee for the current relevance, correctness or completeness of any information provided within this Report and will not be held liable for the consequence of reliance upon any opinion or statement contained herein or any omission.
Furthermore, AOTH/Richard Mills assumes no liability for any direct or indirect loss or damage for lost profit, which you may incur as a result of the use and existence of the information provided within this AOTH/Richard Mills Report.
You agree that by reading AOTH/Richard Mills articles, you are acting at your OWN RISK. In no event should AOTH/Richard Mills liable for any direct or indirect trading losses caused by any information contained in AOTH/Richard Mills articles. Information in AOTH/Richard Mills articles is not an offer to sell or a solicitation of an offer to buy any security. AOTH/Richard Mills is not suggesting the transacting of any financial instruments.
Our publications are not a recommendation to buy or sell a security – no information posted on this site is to be considered investment advice or a recommendation to do anything involving finance or money aside from performing your own due diligence and consulting with your personal registered broker/financial advisor.
AOTH/Richard Mills recommends that before investing in any securities, you consult with a professional financial planner or advisor, and that you should conduct a complete and independent investigation before investing in any security after prudent consideration of all pertinent risks. Ahead of the Herd is not a registered broker, dealer, analyst, or advisor. We hold no investment licenses and may not sell, offer to sell, or offer to buy any security.
About the author

Richard (Rick) Mills

Legal Notice / Disclaimer
Ahead of the Herd newsletter, aheadoftheherd.com, hereafter known as AOTH.
Please read the entire Disclaimer carefully before you use this website or read the newsletter. If you do not agree to all the AOTH/Richard Mills Disclaimer, do not access/read this website/newsletter/article, or any of its pages. By reading/using this AOTH/Richard Mills website/newsletter/article, and whether or not you actually read this Disclaimer, you are deemed to have accepted it.
Any AOTH/Richard Mills document is not, and should not be, construed as an offer to sell or the solicitation of an offer to purchase or subscribe for any investment.