The major gold miners just finished reporting fantastic Q3 results. A potent combination of higher gold prices and lower mining costs fueled skyrocketing profits, some of gold stocks’ biggest earnings growth ever! These larger miners were generally able to overcome depletion, leaving their collective output stable. Posting such blowout numbers should help attract institutional investors back to this battered sector.
The GDX VanEck Gold Miners ETF remains this sector’s dominant benchmark. Birthed way back in May 2006, GDX has parlayed its first-mover advantage into an insurmountable lead. Its $11.9b of net assets mid-week dwarfed the next-largest 1x-long major-gold-miners ETF by over 31x! GDX is undisputedly the trading vehicle of choice in this sector, with the world’s biggest gold miners commanding most of its weighting.
Gold-stock tiers are defined by miners’ annual production rates in ounces of gold. Small juniors have little sub-300k outputs, medium mid-tiers run 300k to 1,000k, large majors yield over 1,000k, and huge super-majors operate at vast scales exceeding 2,000k. Translated into quarterly terms, these thresholds shake out under 75k, 75k to 250k, 250k+, and 500k+. Those two largest categories account for over 53% of GDX.
The major gold stocks are languishing really out of favor today, with GDX down 1.7% YTD despite gold rallying 7.5%. Normally the GDX gold stocks leverage material gold moves by 2x to 3x. This past spring, a good GDX upleg soared 63.9% higher amplifying gold’s parallel 26.3% one by 2.4x! This sector hasn’t been devoid of excitement this year, so this festering bearish sentiment looks anomalous and unsustainable.
For 30 quarters in a row now, I’ve painstakingly analyzed the latest operational and financial results from GDX’s 25-largest component stocks. Mostly super-majors, majors, and larger mid-tiers, they dominate this ETF at 87.2% of its total weighting! While digging through quarterlies is a ton of work, understanding the gold miners’ latest fundamentals really cuts through the obscuring sentiment fogs shrouding this sector.
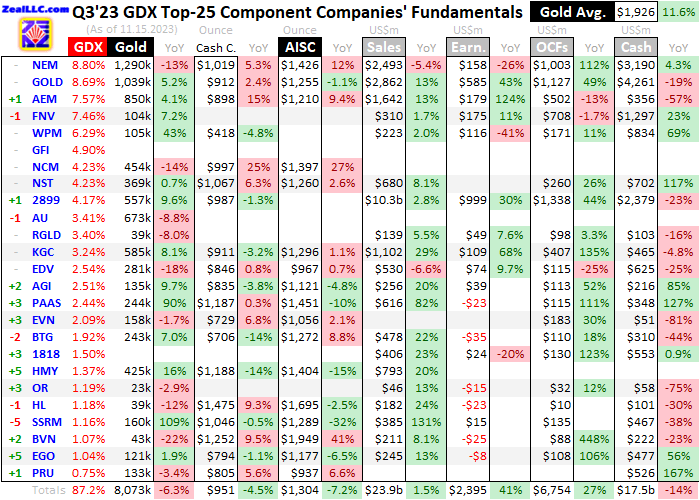
This table summarizes the operational and financial highlights from the GDX top 25 during Q3’23. These gold miners’ stock symbols aren’t all US listings, and are preceded by their rankings changes within GDX over this past year. The shuffling in their ETF weightings reflects shifting market caps, which reveal both outperformers and underperformers since Q3’22. Those symbols are followed by their current GDX weightings.
Next comes these gold miners’ Q3’23 production in ounces, along with their year-over-year changes from the comparable Q3’22. Output is the lifeblood of this industry, with investors generally prizing production growth above everything else. After are the costs of wresting that gold from the bowels of the earth in per-ounce terms, both cash costs and all-in sustaining costs. The latter help illuminate miners’ profitability.
That’s followed by a bunch of hard accounting data reported to securities regulators, quarterly revenues, earnings, operating cash flows, and resulting cash treasuries. Blank data fields mean companies hadn’t disclosed that particular data as of the middle of this week. The annual changes aren’t included if they would be misleading, like comparing negative numbers or data shifting from positive to negative or vice-versa.
Before this latest earnings season got underway, in mid-October I penned an essay on likely gold miners’ fat profits. My thesis then was “much-higher prevailing gold prices and forecast lower costs ought to make for some of this sector’s best earnings growth ever.” That all proved true, making for a fantastic quarter for the major gold miners! This is one of their best in the 7.3 years I’ve been advancing this research.
Production growth trumps everything else as the primary mission for gold miners. Higher outputs boost operating cash flows which help fund mine expansions, builds, and purchases, fueling virtuous circles of growth. Mining more gold also boosts profitability, lowering unit costs by spreading big fixed operational expenses across more ounces. Yet the GDX top 25’s collective output in Q3 fell 6.3% YoY to 8,073k ounces.
For years the world’s largest gold miners have struggled to overcome depletion, which I’ve analyzed in depth in many of this series’ essays. The super-majors and larger majors operate at such vast scales it is really difficult for them to grow their outputs. That’s one reason I’ve long preferred trading smaller mid-tier and junior gold miners. They’ve proven much more able to consistently grow their production from littler bases.
But the GDX top 25’s lower aggregate output in Q3 is distorted by two unusual things. In order to write these weekly web essays early Thursdays, my data and charts have to be finalized by late Wednesdays. One of the world’s biggest gold miners, South Africa’s Gold Fields, dragged its feet in reporting even Q3 operational results. They finally came in overnight leading into Thursday, after my spreadsheets were finished.
Super-major GFI produced 542k ounces of gold last quarter, which boosts the actual GDX-top-25 total to 8,615k. That’s dead-flat compared to the comparable Q3’22’s 8,617k! So the world’s biggest gold miners were able to overcome depletion in Q3’23. And that’s despite king-of-the-hill Newmont really struggling, with Q3 production plunging a whopping 13.2% YoY to 1,290k ounces. That dragged the overall total to flat.
While Newmont has warranted plenty of criticism over the years, this latest production shortfall looks beyond its control. One of the larger mines in NEM’s big stable of them is Penasquito in northern Mexico, ranking as that dominant silver-producing country’s second-largest silver mine. But its rich ores also yield large amounts of gold, 144k ounces in Q3’22 a year ago. That accounted for a tenth of Newmont’s total output.
Mexican mines have long been notorious for labor unrest. Periodically some union will wax Marxist, and convince its members to not only strike but illegally blockade access roads to mines. The Mexican police usually don’t do much, maybe because of sympathy, corruption, or pouring their limited resources into fighting the violent drug wars. So mine strikes can last for a few months, temporarily shutting down operations.
That Penasquito mine is the second-largest employer in the Mexican state of Zacatecas, with a workforce over 5k people. In early June that labor union demanded Newmont double its profit-sharing benefit to 20%, and went on strike. That spanned all of Q3’23, not being resolved until mid-October. And Newmont had to really bend over to end that, crazily paying strikers 60% of lost wages and a two-month bonus in 2024!
So Penasquito’s Q3’23 production fell to zero, which explains the great majority of Newmont’s ugly output decline. Had that massive strike not happened, the GDX top 25’s collective production would’ve grown on the order of 1.7% last quarter. That’s quite a victory for these perpetually-struggling-with-depletion super-majors and majors! That almost matches overall global gold mine production per the World Gold Council.
The WGC’s latest excellent Gold Demand Trends report covering Q3’23 pegged that at 2.3% YoY growth to 31,222k ounces. Interestingly the GDX top 25 including Gold Fields merely accounted for 28% of that. So despite their gold-stock market-capitalization dominance, these major gold miners actually represent a surprisingly-small fraction of this industry. Byproduct and smaller miners produce over 7/10ths of all gold mined!
Sadly this Penasquito mess caused Newmont to welsh on its guidance. Just three months earlier in its Q2’23 results released when that strike was already six weeks old, NEM declared it was “On track to achieve full-year guidance of between 5.7 and 6.3 million ounces of attributable gold production with Gold AISC between $1,150 and $1,250 per ounce”. So it was quite a shock to see what NEM declared in late October.
This company warned that “Newmont is providing a revised 2023 outlook for the standalone Newmont portfolio of 5.3 million ounces of attributable production to incorporate the impacts of the Penasquito strike...” The resulting volume impacts would push full-year all-in sustaining costs way up to $1,400 per ounce. That made for a pretty-darned-bad 11.7% output-guidance slash and 16.7% AISC jump at the midpoints!
With such a miserable late-year revision, NEM stock should’ve plunged 5%+ that day Q3 results were released. Yet that stock instead inexplicably rallied up 2.0%, despite a weak gold-stock tape with GDX sliding 0.9%. Then NEM surged another 4.0% the following day as gold rallied 1.0% to $2,005 on Israel finally declaring its was expanding its ground assault in Gaza. The whole sector was strong, with GDX up 2.4%.
NEM’s resilience after that ugly Q3 report suggests peak bearish sentiment had been reached and selling was mostly exhausted. With quarterly production plunging 13.2% YoY, AISCs blasting up 12.2%, and full-year guidance slashed, this stock should’ve been hammered. Back in July NEM stock plunged 6.0% the day it reported bad Q2 results, with output collapsing 17.1% YoY catapulting AISCs 22.8% higher to $1,472!
Unit gold-mining costs are generally inversely proportional to gold-production levels. That’s because gold mines’ total operating costs are largely fixed during pre-construction planning stages, when designed throughputs are determined for plants processing gold-bearing ores. Their nameplate capacities don’t change quarter to quarter, requiring similar levels of infrastructure, equipment, and employees to keep running.
So the only real variable driving quarterly gold production is the ore grades fed into these plants. Those vary widely even within individual gold deposits. Richer ores yield more ounces to spread mining’s big fixed expenses across, lowering unit costs and boosting profitability. But while fixed costs are the lion’s share of gold mining, there are also sizable variable costs. That’s where recent years’ raging inflation really hit.
Energy is the biggest category, both electricity to power ore-processing plants including mills and diesel fuel necessary to run fleets of excavators and dump trucks hauling raw ores to those facilities. Other smaller consumables range from explosives to blast ores free to chemical reagents necessary to process various ores to recover their gold. So higher variable costs continue to heavily impact the world’s gold miners.
But provocatively as analyzed in my pre-earnings-season essay, many gold miners including Newmont were forecasting considerably-lower mining costs ahead. In their Q2’23 results, plenty still guided to full-year AISCs well under their H1’23 averages. If that came to fruition, it could mark a turning point in major gold miners’ struggle with inflation. I was thrilled to see that indeed proved the case in Q3’23 numbers!
Cash costs are the classic measure of gold-mining costs, including all cash expenses necessary to mine each ounce of gold. But they are misleading as a true cost measure, excluding the big capital needed to explore for gold deposits and build mines. So cash costs are best viewed as survivability acid-test levels for the major gold miners. They illuminate the minimum gold prices necessary to keep the mines running.
The GDX top 25’s average cash costs last quarter fell 4.5% YoY to $951 per ounce. While still high, that was amazingly their first annual decline in a whopping 20 quarters! Q4’21 to Q3’22 was the worst of the cash-cost inflation, with those soaring 22.1%, 22.9%, 24.9%, and 25.0% YoY. While just one quarter of shrinkage can’t confirm a trend change, it’s a great first step. And these cash costs are still skewed high.
Two serious outliers remain among the GDX top 25, Hecla Mining and Peru’s Buenaventura. Both have been plagued with really-high operating costs for long years, for different reasons. Most gold miners would have to explain in their quarterlies why their costs are so high, but neither HL or BVN even bother since they’ve endlessly struggled with high costs. Excluding them, GDX-top-25 average cash costs fall to $903.
All-in sustaining costs are far superior than cash costs, and were introduced by the World Gold Council in June 2013. They add on to cash costs everything else that is necessary to maintain and replenish gold-mining operations at current output tempos. AISCs give a much-better understanding of what it really costs to maintain gold mines as ongoing concerns, and reveal the major gold miners’ true operating profitability.
Fantastically these elite gold majors’ AISCs last quarter fared even better, dropping 7.2% YoY to $1,304 per ounce! That was also the first annual decline in GDX-top-25 AISCs for fully 20 quarters, since Q3’18! And many of the quarterly reports I read suggest this is the start of a trend. These companies’ average full-year AISC midpoint guidances are still running $1,256, which would require even-lower Q4 AISCs to meet.
And HL and BVN also skewed AISCs much higher than they should’ve been. Kicking them out, the GDX top 25 averaged just $1,235 per ounce last quarter even including Newmont’s anomalously-high mining costs on that massive strike. So the major gold miners are finally making real progress on forcing costs back down, which really boosts profitability! That along with much-higher gold prices is a potent combination.
While gold was largely out of favor mostly drifting sideways to lower in Q3’23, its daily closes were still averaging $1,926. That not only surged 11.6% YoY from depressed slammed-by-monster-dollar-rally-on-epic-Fed-rate-hikes levels, but was the second highest ever after Q2’23’s $1,978! Subtracting average AISCs from quarterly-average gold prices offers a great proxy for how gold miners’ sector earnings are faring.
That yielded excellent Q3 unit profits of $622 per ounce! That was the highest seen in six quarters since Q1’22, before the worst of the raging inflation and the Fed’s scorching rate hikes to fight it. And that $622 skyrocketed a phenomenal 93.8% YoY! That was the biggest growth in at least 30 quarters! The major gold miners’ sector unit profits nearly doubled, as I had predicted was likely in that pre-earnings-season essay.
Awesomely the GDX top 25’s big profits growth will likely continue in the currently underway Q4! Gold is actually averaging $1,932 on close quarter-to-date, higher than Q3 levels. And again these gold majors’ full-year AISC guidances in their Q3 results averaged $1,256 midpoints, or $1,189 if Hecla’s ridiculous $2,125 is excluded! And to near $1,256 in 2023, Q4’s will have to come in well below that to drag down averages.
But conservatively let’s just assume Q4-to-date $1,932 gold less skewed-high $1,256 AISCs. Incidentally that includes Newmont’s dramatically-raised guidance on that strike. That still yields even-fatter $676 unit profits, which would soar another 46% YoY to their best levels since way back in Q2’21! The gold miners’ likely soaring-earnings trend is only starting, greatly improving the fundamentals underlying this battered sector.
Not surprisingly with gold rising and mining costs falling, the GDX top 25’s hard accounting results also looked fantastic last quarter. These conform with Generally Accepted Accounting Principles or other countries’ equivalents, and are officially reported to national securities regulators. Despite flat gold output including late-reporting GFI and stronger gold prices, majors’ top-line revenues only inched up 1.5% YoY to $23.9b.
Gold Fields didn’t report quarterly sales in the comparable year-ago quarter either, so that wasn’t a factor. The South African gold miners report in half-year increments, so they tend to just give production updates on off quarters with way less accounting detail. Another South African major, AngloGold Ashanti, just cut its off-quarter data provided. It used to report revenues, but oddly scrapped that leaving shareholders in the dark.
AU did report those in the comparable Q3’22, but not for Q3’23. So pulling out the former lifts GDX-top-25 sales growth to a much-better 6.7% YoY. There are other lesser factors too, including timing of sales. While gold miners’ operations run constantly, their actual sales of mined gold are sometimes lumpy and offset some. Moving gold from mine sites is often risky requiring armed security, so it isn’t done all the time.
These elite gold majors’ bottom-line accounting profits were also strong, blasting up 41.0% YoY to hit $2,395m last quarter! And they should’ve been even higher. B2Gold reported a one-time $112m non-cash impairment charge on acquiring the remaining half of a gold project. That was purchased at a lower cost than the first half, requiring a writedown. And Newmont’s Penasquito strike really retarded earnings too.
It wasn’t just NEM’s, which plunged 25.8% YoY largely thanks to that Mexican labor unrest! The world’s biggest streaming company Wheaton Precious Metals has a contract to buy 25% of Penasquito’s vast silver output at super-low cash costs. For that WPM paid $485m upfront to help finance that mine-build. With Penasquito fully offline in Q3, WPM’s silver stream from it collapsed from 2,017k ounces in Q3’22 to zero!
That crushed Wheaton’s silver “production” last quarter lower by 42.8% YoY, driving a 40.8% plunge in its accounting profits! So excluding these unusual items and events, the GDX top 25’s earnings growth was much bigger. My best guess is closer to 55% to 60%. Way-better profits will help drive sector valuations lower, helping to attract in more investors who screen for lower P/E ratios. Plenty of gold stocks are dirt-cheap.
Naturally with revenues and earnings strong, operating cash flows were too. Last quarter these major gold miners’ OCFs surged 27.1% YoY to $6,754m. That was the best since Q4’21, and on the higher side of the GDX top 25’s 30-quarter range. Operating-cash-flow growth would’ve been even better if AU kept reporting its own, but those were also nixed from its off-quarter reports which are way less useful now.
AngloGold Ashanti also stopped telling its shareholders how much cash it had on hand, contributing to the GDX top 25’s treasuries falling 14.3% YoY to $17.5b. That’s still a big number for this sector, giving the major gold miners lots of capital firepower to expand existing mines or buy new ones. Smaller mid-tier and junior gold miners remain prime acquisition targets, the quickest way for majors to augment depleting pipelines.
While the majors’ Q3 results were fantastic, the smaller gold miners’ should prove considerably better. The mid-tiers’ and juniors’ much-smaller production bases make it way easier for them to consistently grow their outputs. And their way-littler market capitalizations allow their stocks to be bid higher much faster. I’m working on the GDXJ top 25’s quarterlies now, and will soon publish another essay analyzing them.
Successful trading demands always staying informed on markets, to understand opportunities as they arise. We can help! For decades we’ve published popular weekly and monthly newsletters focused on contrarian speculation and investment. They draw on my vast experience, knowledge, wisdom, and ongoing research to explain what’s going on in the markets, why, and how to trade them with specific stocks.
Our holistic integrated contrarian approach has proven very successful, and you can reap the benefits for only $10 an issue. We extensively research gold and silver miners to find cheap fundamentally-superior mid-tiers and juniors with outsized upside potential. Sign up for free e-mail notifications when we publish new content. Even better, subscribe today to our acclaimed newsletters and start growing smarter and richer!
The bottom line is the major gold miners just reported fantastic results last quarter. Sector unit earnings nearly doubled on the potent combination of higher gold prices and lower mining costs! The miners are finally starting to overcome recent years’ raging inflation, forcing their costs back down. That great trend fueling fat profits is likely to continue, as gold is still forging higher while miners forecast even lower costs ahead.
The major gold stocks are even achieving production growth, which is hard to do at the vast scales they operate. All that is driving much-stronger revenues, earnings, and operating-cash-flow generation. The bigger profits are really bullish for this sector, pounding valuations even lower which should help attract back fund managers. Reporting stellar numbers like these, gold stocks won’t languish out of favor for long.
Adam Hamilton, CPA
November 17, 2023
Copyright 2000 - 2023 Zeal LLC (www.ZealLLC.com)
About the author