
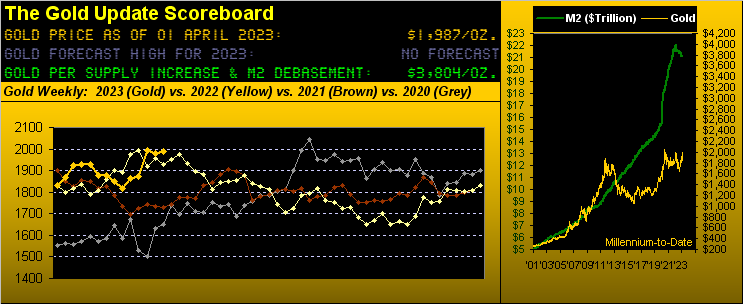
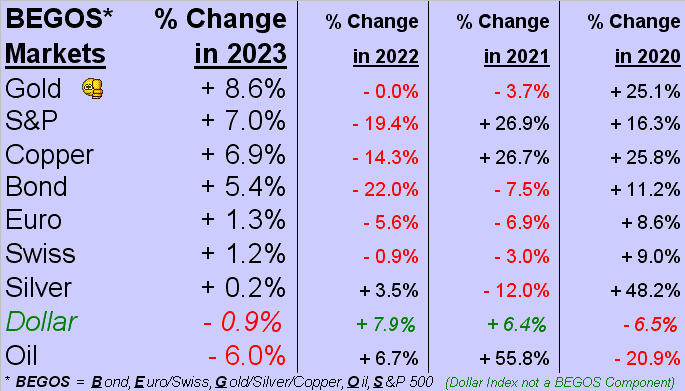
'Tis April 1st, but no foolin' from here: just fact. And it being week-end, month-end, and quarter-end, we begin with Gold leading the year's trend! For through 2023's 62 trading days-to-date, we've the BEGOS Markets' yellow metal with the best growth rate: numéro uno, bébé!
To be sure, a marvy thumbs up there for Gold. However: we're mindful of keeping our feet on the ground as we update from a week ago our year-over-year Market Values graphic for Gold. And yes, price having settled yesterday (Friday) at 1987 is still quite stretched vis-à-vis the 1863 level of the smooth valuation line which prices Gold by its movements relative to those of the five primary BEGOS Markets (Bond / Euro / Gold / Oil / S&P) as we here see:
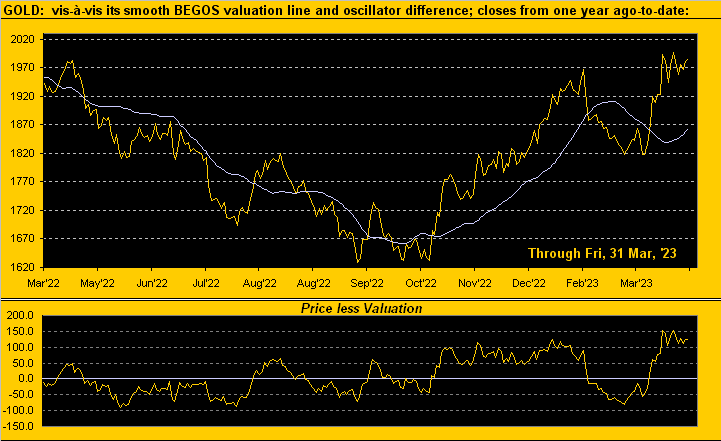
And thus by that graphic's lower panel (price less valuation), Gold technically near-term shows as +124 points "high" -- a legitimate measure per our prior missive's pointing out Gold's ownership as growing -- but nonetheless an extreme deviation across the breadth of the whole graphic. Historically the largest positive deviation (+311 points) was a-way back on 22 August 2011 when Gold closed above 1900 for the first time ever, (following which price fell -195 points in less than one month). We doubt we'll see a repeat of that here, however the mid-point between price and value is now 1925 which itself marked a cluster of structural support formed this past January.
Too, Gold's daily parabolics have just flipped from Long to Short, suggestive of some imminent price retrenchment. The signal is as encircled here at upper-right:
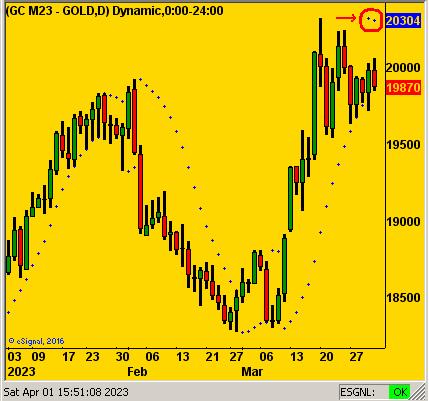
'Course, Gold fundamentally long-term need eventuate up toward our opening Scoreboard's valuation of 3804. That with a hint-hint, wink-wink, nudge-nudge from the "Buy the Dips Dept."
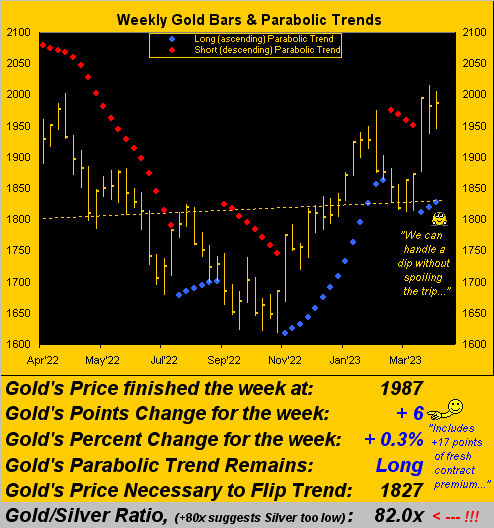
Still, Gold range-wise ran a bit out of puff this past week: for even with +17 points of fresh premium (the front-month contract having just rolled from April into that for June), 'twas price's narrowest trading week since that ending 03 March. Regardless, as we turn to Gold's weekly bars from a year ago-to-date, the blue-dotted parabolic Long trend is but a young three weeks in duration. Note as well that the dashed regression trend line has rotated to positive. And because the parabolic flip price for the ensuing week is far out-of-range at 1827 (i.e. well below the aforementioned January structural support area 'round 1925), Gold can dip and then resume its trip toward a new All-Time High above 2089, and beyond! To wit:
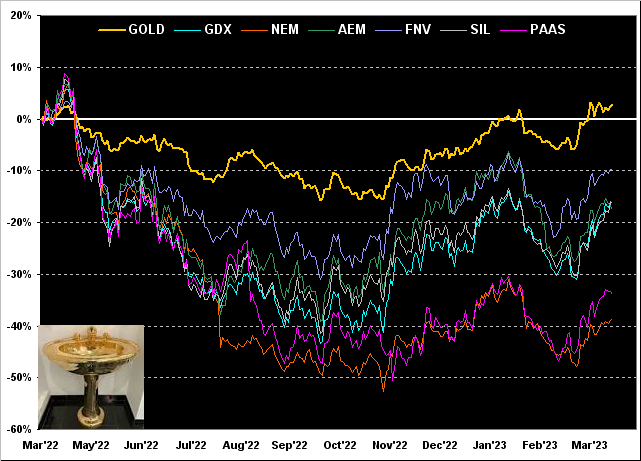
Now it being month-end, as is our wont, we peek at the Golden equities font. And from one year ago-to-date, Gold itself is the only gainer +3%, followed by Franco-Nevada (FNV) -10%, both the VanEck Vectors Gold Miners exchange-traded fund (GDX) and the Global X Silver Miners exchange-traded fund (SIL) -16%, Agnico Eagle Mines (AEM) -17%, Pan American Silver (PAAS) -34%, and not so mighty Newmont (NEM) -39%. 'Course with the equities comes multiple-times leverage, obviously putting you in mind of the lyric by Naval Ravikant & Akira The Don from a year ago or so: "Fortunes require leverage" ... well, maybe not. Anyway, here's the graphic:
As for the StateSide economy, recall we wrote a week ago "...look for the Baro to work lower...", the Economic Barometer indeed doing so:
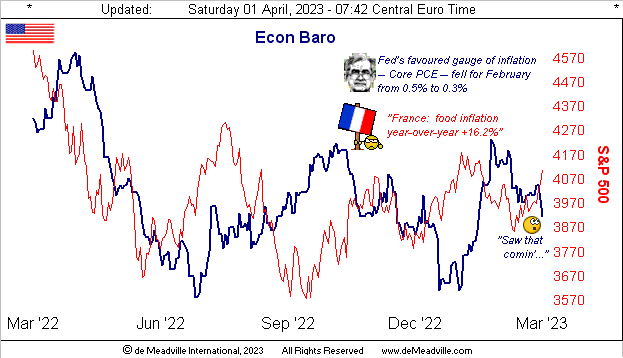
Yes, our neighbouring French friends are not happy (about so many things) ... but then, 'twouldn't be France, non? Still StateSide, just two of the week's 10 incoming economic metrics were (both barely) improved, namely March's Consumer Confidence and the Chicago Purchasing Managers' Index. Otherwise, the month's University of Michigan "Go Blue!" Sentiment Survey was revised lower, as was Q4 Gross Domestic Product, whilst for February, growth slowed in Pending Home Sales, and in both Personal Income and Spending. As for this ensuing week, the data appear (by consensus) rather wishy-washy.
But there's that red line in the above graphic. 'Tis sheer celebration for the S&P 500: after all, former U.S. President Trump's legal escapades have comprehensively replaced any faint hint of banking concerns, (remember those?). Inflation is slowing such that certainly the Federal Reverse shall at any moment "pivot", the knee-jerk reaction thus being to buy equities without regard for valuation. Indeed so robust is the S&P -- whether by Index gain or by the website's MoneyFlow measure -- the week-over-week rise of +3.5% has now driven our "live" price/earnings ratio to 48.1x (not a typo). 'Course, this is what happens when earnings don't grow as the S&P stratospherically skyrockets, today now 4109.
"But of course the S&P has been at this level in the past, right, mmb?"
Absolutely, Squire. Not even a year ago on 06 June 2022 the S&P 500 settled at 4121, nearly the same level as today. The P/E at that close? 30.1x ... today 'tis 60% higher! Don't take wrath, just do the math. The "Look Ma! No Earnings Money!" crash is sitting out there. We merely await whatever crash catalyst is dreamed up by the FinMedia, (which they're reluctant to do as it kills their ratings). "Will ya change the channel already, Mabel? All that red is hurtin' my head!"
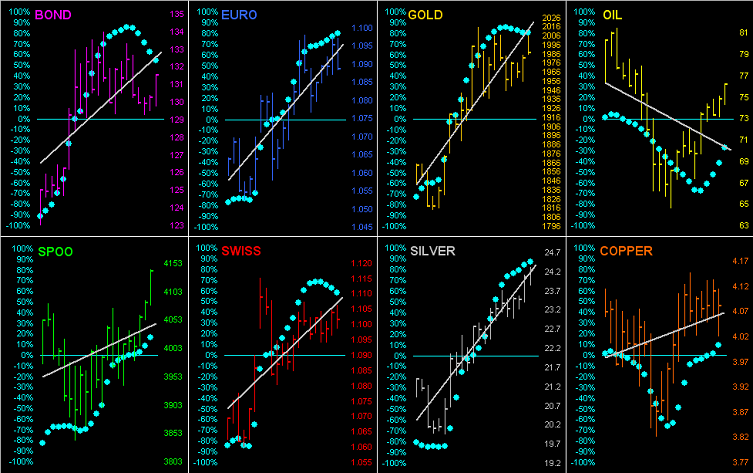
Meanwhile, irrespective of inflation slowing or growing (depending on whose such measure is showing), 'tis said "the market is a hedge against inflation" -- dare we now say ALL the BEGOS Markets -- as we go 'round the horn for the whole bunch. Here we've their last 21 trading days (one month) with each component's respective grey linear regression trendline and the baby blue dots of trend consistency. And money is flowing into everything:
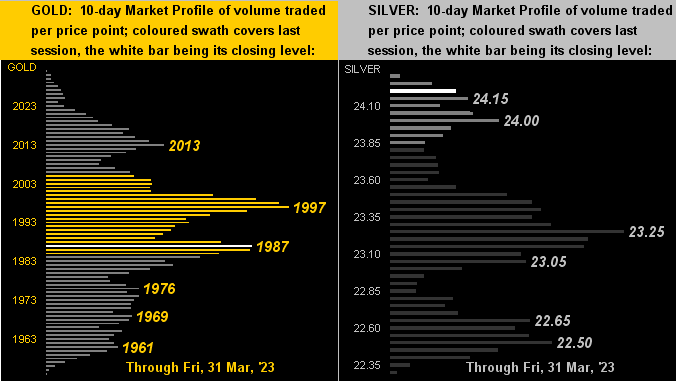
More specific to the precious metals, here next are their 10-day Market Profiles with Gold on the left and Silver on the right. The dominant volume prices are so denoted as trading supporters/resistors:
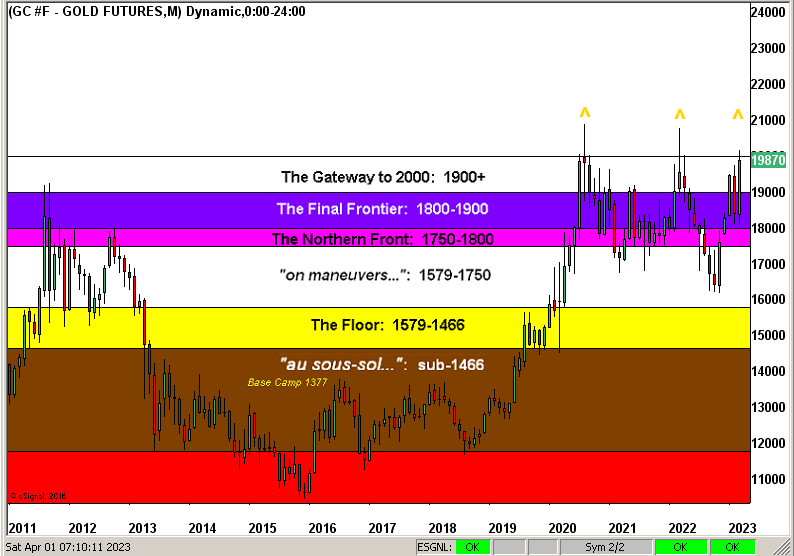
And as we regular quip 12 times per year, 'twouldn't be month-end without displaying this stratified view of Gold's Structure by the month from 2011-to-date. Again at right we suggest the notion of a Gold "triple-top" which by trading lore is "meant to be broken" to the upside. "Inevitably" we say:
To wrap, we dread having to close on a dreary note, but again here we've just fact. The mournful news is -- according to New York State Comptroller Thomas "Ever Smilin'" DiNapoli -- the average New York City securities job bonus in 2022 was but a chicken-scratch $176,700. That pales in comparison to the average bonus paid in 2021 of $238,700. The French may forever now be complaining about having to work until the age of 64 (rather than 62) to get their pension. But our heart goes out far beyond them to this monetary plight of the well-impoverished Wall Street worker. Lord have mercy.
And make sure you have some market-leading Gold! (We sense Smilin' Tommy does...)

Cheers!
...m...
About the author
