First we start with our title's last word: "recession". If you do the math and/or are a regular reader of The Gold Update, you well-understand that the U.S. Gross Domestic Product ex-inflation just recorded its fourth consecutive quarter of shrinkage. Or inclusive of inflation as is the standardized measurement, a second consecutive quarter of shrinkage has just been recorded, which by long-running dictum establishes a recession as being in force, six months after the fact.
This second consecutive quarter of shrinkage having been clearly expected given our Economic Barometer being in full plunge -- toward saving face -- the StateSide government, investment banks and FinMedia skirted 'round Thursday's -0.9% Q2 GDP report by redefining if not outright denying "recession". Here are a few choosings of such high-level musings:
■ "We’re not going to be in a recession", U.S. President Joseph Robinette Biden Jr., 25 July;
■ "We're not yet in that recession-type scenario", Elyse Ausenbaugh, JPM, 28 July;
■ "Are we in a recession? Yes. No. Maybe.", Allison Morrow, CNN, 29 July.
REALLY?
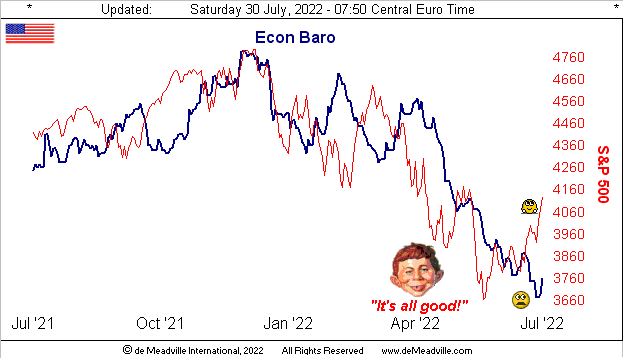
Not only is the recession ongoing, but by the above Barometer, the underlying economic foundation for Q2 was weaker than 'twas for Q1. But as GDP is not so much calculated using specific metrics as it is a "throw it up on the side of the barn" summation for a quarter's value of goods and services, the GDP refutes the depth of the ongoing reality. And as is clear in the graphic, Wall Street as measured by the S&P 500 (red line) is obviously siding with the "milder" GDP shrinkage along with the "redefining" of recession rather than with truth of the floundering economy (blue line).
Indeed we oft wonder if the six-figure folks at the banks actually do any honest economic analysis. The optics are that they do not, instead choosing to parrot one another with what they see on TV. (Easy money if you can dumb yourself down enough to get the job). Whereas here, we've been pointing out for months that the U.S. economy has been shrinking (simply because we do the math), whilst much of the balance of the bunch prefer to swim in da Nile. ('Course, any threat to their fee income is verboten!)
And as for the ongoing Q2 Earnings Season, the S&P 500 is on track toward recording its sixth-worse quarter (by year-over-year comparison) in at least the past 21 quarters: which is why the "live" P/E is a lofty 33.3x ... which in ironic turn is 33% above the lifetime average price/earnings ratio of 22.3x. "Bear" in mind as well within this S&P "correction" that 3600-3200 structural support has yet to be tested.
"But mmb, everybody's saying the bottom is in..."
And let them so say, Squire, for without "everybody" there's no one to take the other side of trade.
As for Gold's latent price accession into economic recession, 'twas a robust week for the yellow metal. Inclusive of +18 points of price premium (as volume rolled from the August contract into that for December), Gold scored a net weekly gain of +3.3% (+53 points). By percentage -- even without the added premium -- 'twas Gold' best weekly gain since that ending 04 March. Moreover, price is finally knocking on the red-dot door to flip the weekly parabolic trend from Short to Long:
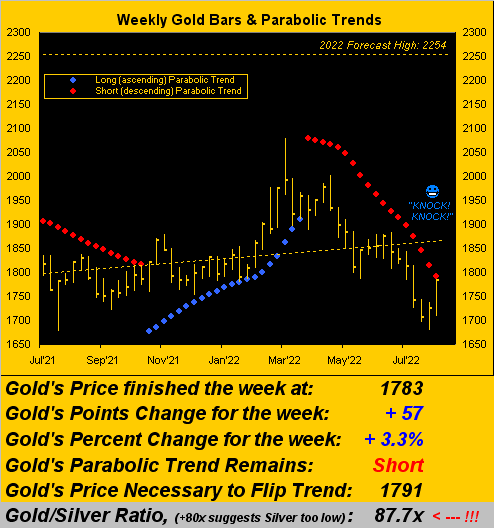
And whilst we've been most fortunate with some near-term calls (suggesting the precise 1678 low two weeks in advance, and then a week ago suggesting this past week's precise 1785 high as a near-term target), we remain far off base toward reaching our 2254 forecast high for this year, albeit our near-term "Hello 1800!" looks likely to pan out. Gold having settled yesterday (Friday) at 1783 means a leap from here of +26% is requisite within just five months (107 trading days) to hit the 2254 target. Such percentage increase within same timeframe did happen in and around 2005, 2006, 2007, 2008, 2009, 2011 and 2020, just in case you're scoring at home. (Yeah, we know, the "M Word" crowd will be out to quell it, lest they themselves be quelled as currency faith dissipates: history does have a hankerin' to repeat itself).
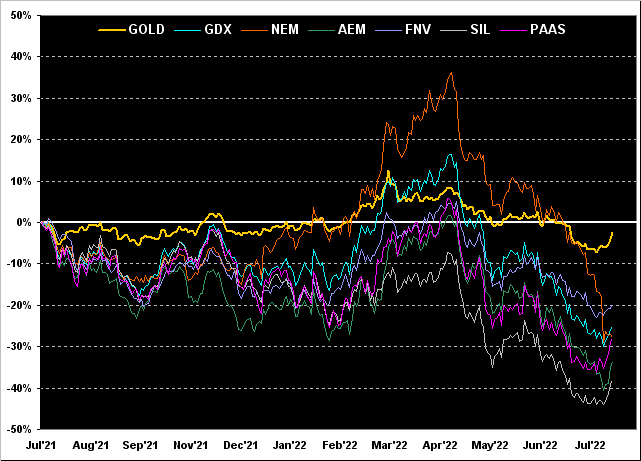
Meanwhile, year-over-year we also go for Gold along with several of its key equity measures. Whilst all by their percentage tracks are negative, the troops are now trying to turn the corner, albeit from this time a year ago we've Gold itself -2%, Franco-Nevada (FNV) -20%, the VanEck Vectors Gold Miners exchange-traded fund (GDX) -25%, Newmont (NEM) and Pan American Silver (PAAS) both -28%, Agnico Eagle Mines (AEM) -34% and the Global X Silver Miners exchange-traded fund (SIL) -38%. Up or down, you can really see the leverage of the equities-to-Gold herein:
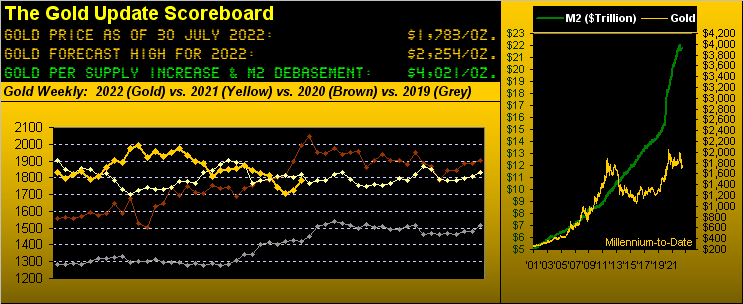
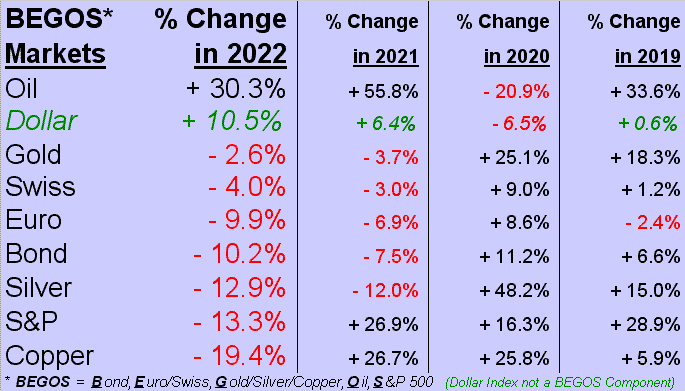
As brutally low as remains the price of Gold (1783 today versus the Scoreboard valuation of 4021), the yellow metal still has a place on the podium as we next see in the year-to-date percentage performances of the BEGOS Markets, with Big Oil remaining the Big Winner. And is not said that last-place Copper supposedly leads the economy, (hint-hint, nudge-nudge, wink-wink)?
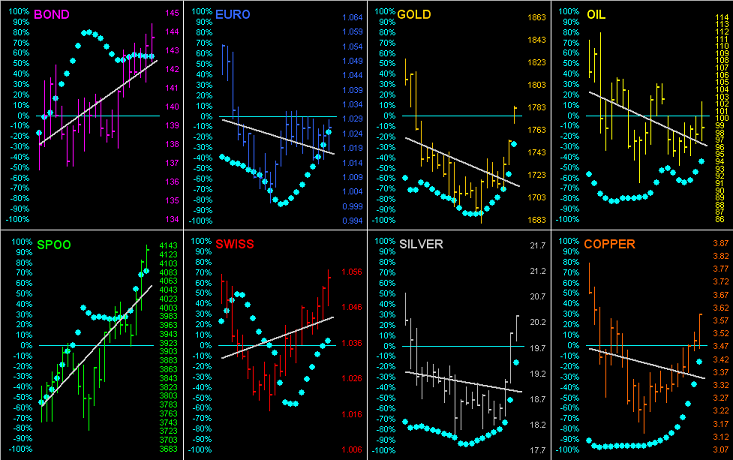
As for their past 21 trading days (one month), here we go 'round the horn for each BEGOS component with its respective grey linear regression trendline and baby blue dots of consistency thereto. Gold's Friday bar gap is indicative of the +18 point price premium as December replaced August for "front month":
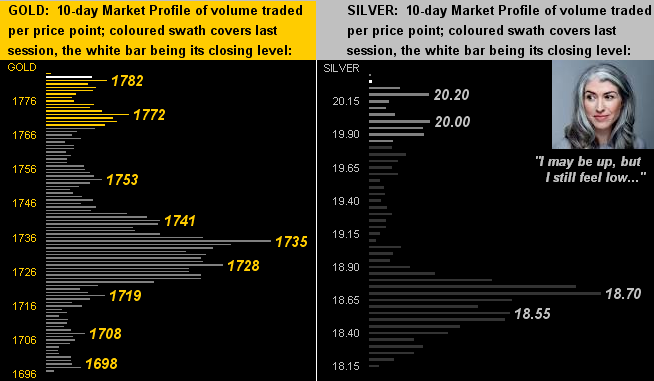
The precious metals' 10-day Market Profiles reveal prices' breaking out to the upside, Gold on the left having expanded from the 1740s up into the 1780s and Silver on the right moving up a full point from the 19s to settle above 20 for the first time since 30 June. Indeed, Sister Silver's gain for the week was a full +10%, in turn knocking down the Gold/Silver ratio from 93.3x to 87.7x, still well above the century-to-date average of 66.9x, (by which measure prices Sister Silver at 26.65 rather than at her lowly 20.34):
Further, it being month-end, here we've Gold's Structure by the monthly bars across the past 11 years. (Caution is advised in reviewing this chart, for reliving The Northern Front time and again can elicit both a headache and thigh rash):
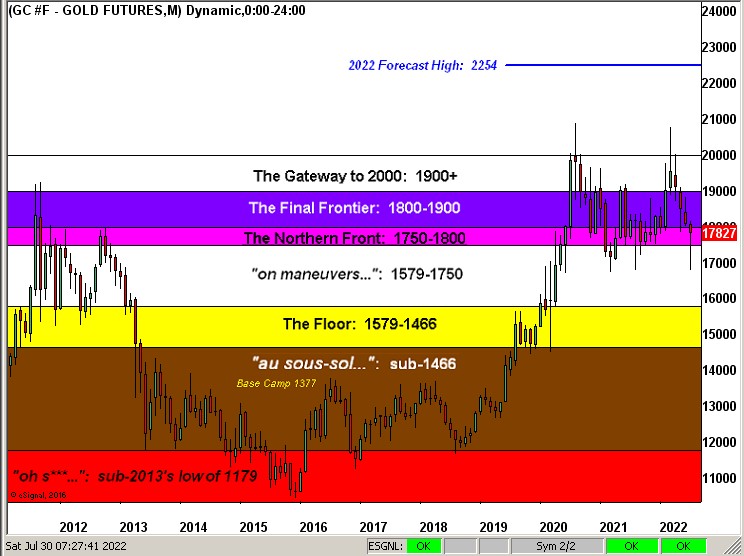
At least Gold has recovered to our call for 1785, (which ain't sayin' much); however as was also written a week ago "...what had been Gold's 1854-1779 support zone mirrors into the 1779-1854 resistance zone..." Thus from here 'twill be the battle of fundamental push versus the "M Word" crowd set to keep Gold on its tush. Rather confounding stuff, as are these three closing observances:
■ There is wide-spread consensus that the Federal Reserve shall continue to aggressively raise rates into the recession only to revert to rate cutting come 2023. Our recommendation is to take the Green route in saving the Planet's fragile supply of energy by simply shuttering the Eccles Building for a year given 'tis back to here the Fed would otherwise ultimately steer.
■ Dow Jones Newswires this past week reported that "Rich Americans Keep Borrowing, Defying Economic Gloom." That aligns nicely with Squire's noting earlier that "...everybody's saying the bottom is in..." Be mindful of massive margin calls when it all goes wrong.
■ Speaking of which, the International Monetary Fund has again just notched down their forecast for global growth; (we assume this is ex-StateSide, it already being well into a state of shrinkage). The IMF further couvert son derrière in warning of even worse outcomes. Add to that more broadly the Congressional Budget Office's expectations for increasing budget shortfalls, in turn breeding far higher levels of debt levels over the next 30 years. (That's one heckova crystal ball there). Moreover, at what point comes Uncle Sam's first default?
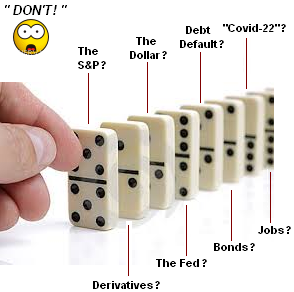
Regardless, the dominos remain poised for their chain reaction ravaging: a still vastly overpriced S&P within a better-yielding debt environment, a Dollar worth more as there are more of them, more and more debt per the CBO (which counters the Bond argument), the Fed raising further into recession, and "ooh-ooh a COVID-22 aggression"? The mutation of the 3Ds (Debasement, Debt, Derivatives) ever so underscores the 3Gs: Gold, Gold and Gold!
Cheers!
...m...

