
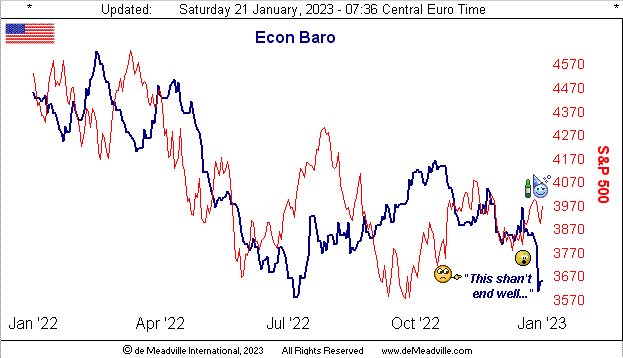
We start with this past week's highlight (or better stated "lowlight"): on Wednesday, our Economic Barometer tied for its worst one-day plunge in the 25 years we've been maintaining it. Here 'tis, and as we wrote that day to our Investors' Roundtable, (as inebriated as the "buy the dip" crowd may be): "This shan't end well..."
Indeed if you read that day's Prescient Commentary, we referred to it (albeit perhaps prematurely) as "deflationary shrinkage", notably featuring for December negative wholesale inflation (headline PPI), negative Retail Sales (both headline and core), negative Industrial Production with a slowing in Capacity Utilization, and a backup in November's Business Inventories. All that even as one Ipek Ozkardeskaya of Swissquote Bank then said (hat-tip Bloomy): "The Fed is not stepping back from its rate hike talk despite easing inflation and easing activity."
Add to that from the "Oh by the Way Dept." per our other FinMedia friends (hat-tip The BBC): "U.S. Nears Debt Ceiling, Begins Extraordinary Measures to Avoid Default" Oh that higher cost of borrowing! Yet, both New York FedPrez John "It's All Good" Williams and FedViceChair Lael "The Brain" Brainard inferred their Bank is making anti-inflation headway ... but as there's a-way to go, 'tis the inference for further rate hikes, be they even just in +0.25% increments.
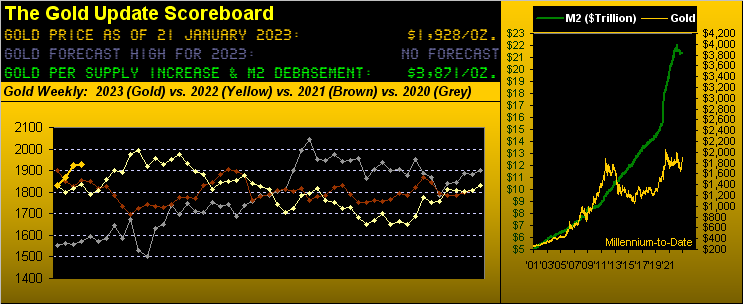
"Extraordinary", but hardly surprising, what? From the StateSide Congress to the great American household, as dough becomes more expensive, 'tis harder by which to come, and budgets more readily bust. And as you've likely noticed per the opening Gold Scoreboard, the green Money Supply ("M2") line in the right-hand panel is actually in (albeit minute) decline. For just as loan creation increases M2, so does loan repayment (i.e. "I ain't payin' this much in interest any more...") decrease M2. 'Course were it not for COVID, M2 (today $21.3 trillion) we estimate would likely be about $18.9 trillion (just in case you're scoring at home). But what difference does another $2.4 trillion sloshing around at this level make anyway? Fundamentally none.
And as to a recession "part deux", (hat-tip WSJ), 61% of surveyed economists continue to see it occur this year, as do several of the Davos bunch. Regardless, this Thursday (26 January) brings us the first peek at StateSide Q4 Gross Domestic Product: the consensus is for +2.8% annualized growth versus Q3's +3.2%. But by the above Baro, such expectation seems a real stretch. Even a negative number wouldn't be untoward.
Over to this side of the Pond and the FinTimes chimes in with "Downbeat in Davos as Europe confronts an end to peace and prosperity." And specific to neighbouring France, Bloomy adds "France Increases Military Budget as Risk of High Intensity War Grows", (add to which is the Macron administration's desire to up the French retirement age from 62 to 64 ... yes, all the way over here we can hear you StateSiders laughing).
'Course China (which essentially "makes everything" used on the planet) sees its economic growth having slowed to near-record lows. Seems like globally "there's no escape". Perhaps King Charles III with "Rule Britannia" can right the world's ship... hip-hip.
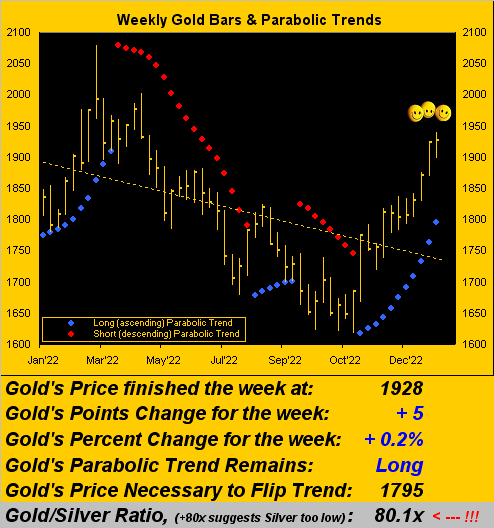
Speaking of which, Gold is hip: 'tis steady as rock through recent days, settling out the week yesterday (Friday) at 1928, its highest weekly close since that ending 22 April. The trading volume increase in the yellow metal as herein detailed a week ago is still in vogue lending to price buoyancy for Gold, (without any notable evidence of evil price suppressor presence). Indeed as we now turn to Gold's weekly bars from one year ago-to-date, note that:
■ the parabolic blue dots of Long trend, now 11 weeks in duration, are accelerating their upside pace;
■ price has made a "higher-low" for eight consecutive weeks, a phenomena that has occurred but seven other times across the past 22 years, (the record being 10 consecutive weeks from those ending 08 January 2016 through 11 March of that year):
Further as noted a week ago, the 1800s once resistance we anticipate shall morph into support, with a shot at the All-Time High of 2089 (07 August 2020) in the balance.
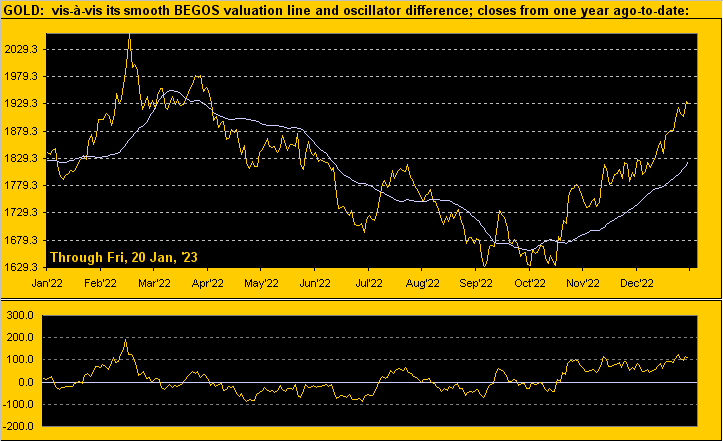
Still, from the "Keeping One's Feet on the Ground Dept.", here next are Gold's daily closes again from one year ago-to-date along with the smooth valuation line. As you regular readers know, the valuation line, rather than being specific to currency debasement, is instead a value for Gold based on its day-to-day movement relative to those for the other four primary markets that make up BEGOS (Bond / Euro / Gold / Oil / S&P). And by such measure, per the oscillator in the lower panel (price less valuation) Gold is 105 points above the line. Thus a "test" of those 1800s may be nigh:
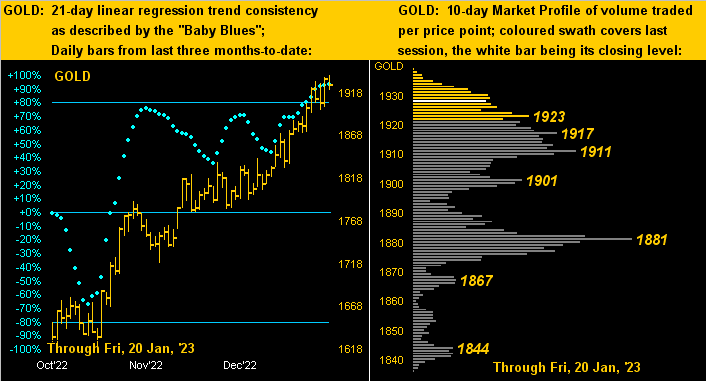
Now to zoom in we turn to the two-panel graphic of Gold's daily bars from three months ago-to-date on the left and price's 10-day Market Profile on the right. Both charts are basically superlative in speaking for themselves, the baby blue dots supportive of trend consistency and price again near the top of the Profile:
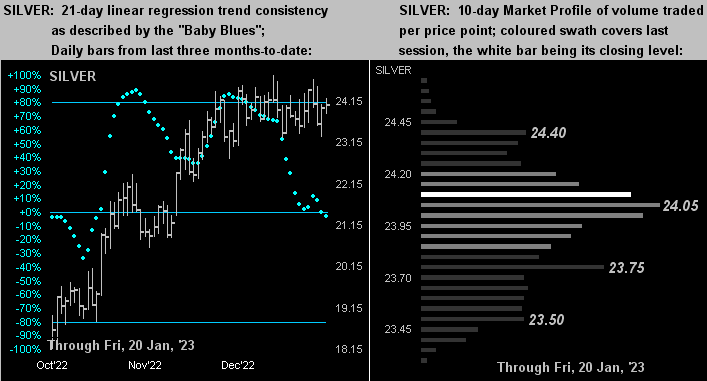
Silver's like graphical display however is hardly superlative. Which is a bit odd given that Cousin Copper's course in recent months has been directionally similar to that of Gold; in other words with both the yellow metal and red metal firmly positive, one would expect the white metal, too, to appear similarly up. But per her declining "Baby Blues" (below left) and her being more centered than high in her Profile (below right), Sister Silver clearly is lagging the surge of the other two metals. Moreover as noted at the foot of the aforeshown weekly bars for Gold, the Gold/Silver ratio is back above 80x (at 80.1x) for the first time since late November:
"So a couple of big numbers this coming week, eh mmb?"
To be sure, Squire. For in addition to the StateSide Q4 GDP, on Friday comes December's change in Core Personal Consumption Expenditure Prices, aka "The Fed's favoured read on inflation": and the consensus has it up to +0.3% from November's +0.2%. Thus the recessionary "down with the growth and up with the rates" scenario shall continue to hold sway.
Either way, keep swayin' with Gold!

Cheers!
...m...
About the author
