
Since August, we've been waiting for a bottom and end of this current consolidation in COMEX gold prices. With the most recent U.S. inflation data, that day may finally be here.
Finally. That's the key word. As this pullback has dragged out over the past seven months, there have been many possible bottoms. Unfortunately, all of those ended up bringing nothing but false hope. The most recent low near $1680 looked a little different from the others, however, and we wrote about it a few weeks ago. Here's the link, if you missed it:
And now—finally—we have something more substantial to go on. Real interest rates. How important are inflation-adjusted or "real" interest rates to gold prices? We've written about this often on these pages, but here's just one example from early August of last year when COMEX gold prices were at all-time highs:
Again, how are "real" interest rates calculated? The most popular and widely-followed measure is simply the yield on the U.S. 10-year treasury note minus the current annualized U.S. consumer price index or CPI. If this math nets you a positive result, then you have a positive inflation-adjusted return. However, if the math generates a negative number, then you have a negative return.
Plot any long-term chart of real interest rates and gold and you'll find a near-perfect, inverse correlation. Positive real rates restrain gold prices, while negative real rates give prices a boost. But actually, you don't even need a chart. Just use your recent memory and experience.
August 2020: The yield on the 10-year note was +0.55% while annualized CPI was +1.6%. The resulting inflation-adjusted or real yield on the 10-year note was -1.05%. The gold price? $2100.
March 2021: The yield on the 10-year note had moved up to +1.75% but annualized CPI was still just +1.7%. The resulting real yield on the 10-year note was +0.05%. The gold price? $1700.
And now here's where things might soon get real-ly interesting again.
Remember that the key inflation metric is the annualized CPI. This is a moving average of the past twelve months of U.S. inflation data. But recall that last spring, the U.S. was experiencing deflation as Covid shutdowns and lockdowns ground the economy to a halt. As recently as last month, the running average annual inflation included the data from March 2020. However, the most recent CPI data released on Tuesday dropped March 2020 and replaced it with March 2021. The result? Suddenly, the annualized CPI is no longer +1.7% and it's instead +2.7%. With April 2020 soon to be replaced by April 2021, don't expect this trend toward a higher annualized inflation number to end soon.

So now let's connect the dots in order to figure out why we've very likely seen the lows in COMEX gold and silver and why a late spring and summer rally is likely.
As I type this on Tuesday morning, the U.S. bond market is stable following the surge in annualized inflation. Perhaps you could say that these higher inflation numbers are already "priced in" after rates moved from 1.00% in January to 1.75% in March. Regardless, the 10-year note rate today is at 1.66% and steady.
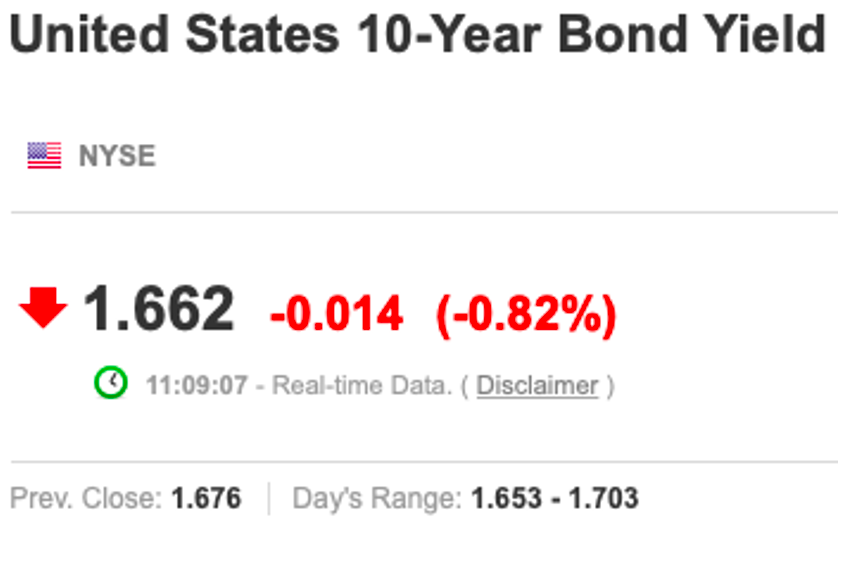
But now wait a second. Didn't we just learn that annualized inflation in the U.S. is now +2.6%? Yes, we did. Therefore the inflation-adjusted or "real" level of 10-year U.S. interest rates is suddenly right back to where it was last summer at nearly -1.0%!
(The 10-year note rate of 1.66% MINUS annualized CPI at 2.60% equates to a real yield of -0.94%)
As you'd expect, COMEX gold and silver prices are up a bit on Tuesday, and the "market" may be just now beginning to realize that the COMEX gold price is about $300 lower than it was last August when real rates were this sharply negative.
Once gold traders and investors figured all of this out last summer, the COMEX gold price moved from $1673 on June 5 to $2080 on August 5. If bond prices remain firm in the weeks ahead and 10-year yields remain steady in the 1.60-1.75% range, the market will once again rapidly come to its senses and prices will surge. Can price move as quickly this summer as it did last summer? Again, that is almost entirely dependent upon how the bond market trades in the weeks ahead.
And it won't take much to get prices moving higher again. There are multiple key levels that traders and technicians will be watching as prices rise. As those levels get broken to the upside, price will generate even more momentum and another virtuous cycle of higher highs will follow.
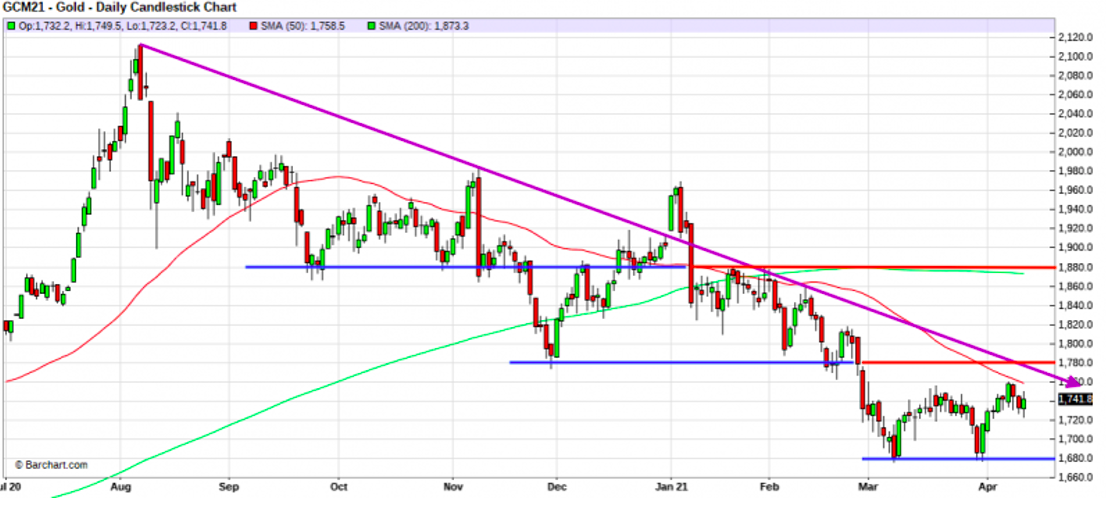
For now, watch the 50-day moving average and the "bull flag" trendline on the long-term chart (shown as a purple arrow below). Once above both, price will rally past $1780 and this will excite the day traders and wave counters of the world. Beyond there, price will head to the 200-day moving average and a break of that key indicator will drive an even higher level of excitement for the sector.
Again, though, the bond market and the level of nominal interest rates will be the key. If prices and yields remain steady in the face of this jump in the CPI, then the Dollar Index is likely to fall, too. Put it all together and the stage will be set for the recovery rally that we've all been expecting.
About the author


Our Ask The Expert interviewer Craig Hemke began his career in financial services in 1990 but retired in 2008 to focus on family and entrepreneurial opportunities. Since 2010, he has been the editor and publisher of the TF Metals Report found at TFMetalsReport.com, an online community for precious metal investors.