
Precious metals prices have endured another two-month correction but are seemingly very close to turning the corner as they paint another "higher low" on their charts. How close? Let's discuss that today.
First of all, my friend David Brady has been writing about this over the past two weeks, too, and if you've missed his commentary, both articles are linked below:
• The End Is Nigh | Gold Analysis
• Almost There! Gold and Silver Analysis
For the entirety of 2023 this far, my own analysis has suggested that the first half of the year would bring flat/sideways prices in a manner similar to 2010 and 2019, two previous years that brought Fed monetary policy shifts. Thus far, that has been the case as COMEX gold is up about 6% year-to-date with COMEX silver down 0.1%.
There have been two "false starts," with both leading to pullbacks. Gold rallied in January but fell in February. It rallied again in March and April, only to fall backward in May and June. The key to this pattern is the making of higher highs and higher lows, and that's precisely what has been occurring.
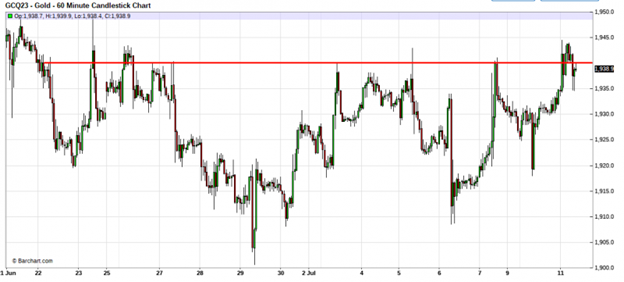
This most recent pullback began in early May, but it appears to have run its course. First of all, note that recent price consolidation between roughly $1900 and $1940. Whether or not a wall of resistance has been deliberately created at $1940 matters little. What does matter is that we now have a very clear line of demarcation to watch.
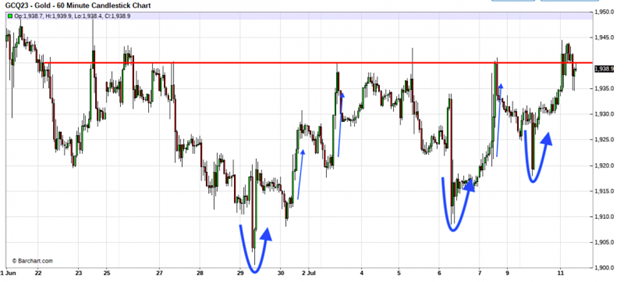
Now look at what gets revealed if we add a few other notations to that same chart. Notice the sharp reversals that have followed selloff attempts this month. Also notice the surge of price that followed each reversal. And one more thing... total contract open interest has seen a surge, too, rising from 429,000 in late June to 486,000 on July 10.
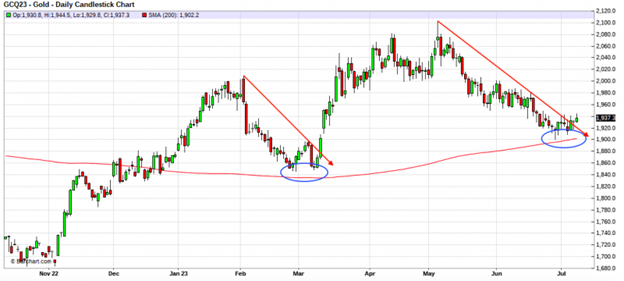
Put it all together on the daily chart and you can see just how close price is to breaking higher after another successful test for support near its 200-day moving average. If it can move higher here with a surge above $1940 and toward $1960, the chart will show another "higher low" with an eventual "higher high" to follow.
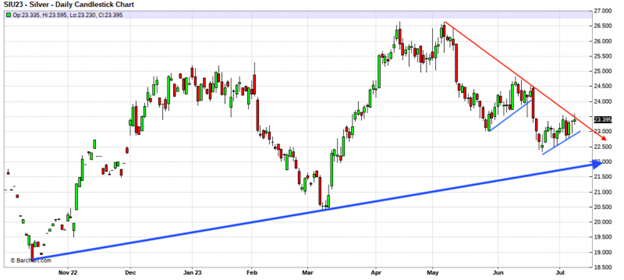
A similar bottoming pattern is emerging in COMEX silver, though it's not quite as clear just yet. On the chart below, you can see two possibilities:
• Is silver tracing out another "bear flag" on its way to a final low near its primary trendline from the lows of late 2022?
• Has silver already seen and made its own "higher low" and is now headed higher again?
The price reaction to this week's U.S. inflation data is likely to answer these questions for us.
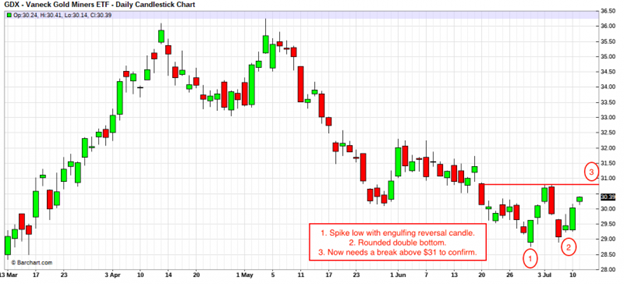
And finally, what about the mining shares? As a reflection of overall sentiment, the shares can sometimes give a hint regarding shifts in the short-term trend. To my eye, if we use the GDX as a proxy, the shares appear very close to turning the corner as they've begun to paint the type of chart pattern I've often observed at lows and bottoms. See the explanation on the chart below:
Lastly, overall retail sentiment is about as poor as I've seen in recent years. Just as in early March, the crowd believes that the Fed will keep interest rates "higher for longer" and that this will result in a soaring dollar and lower precious metal prices. I'll leave you with two thoughts:
1. Just as in early March, the bearish outlook can change overnight. On March 7, Fed Chair Powell was on Capitol Hill proclaiming his support for another fifty basis point rate hike later that month. Just three days later, Silicon Valley Bank collapsed, proving that not even Powell knows what lurks behind every corner.
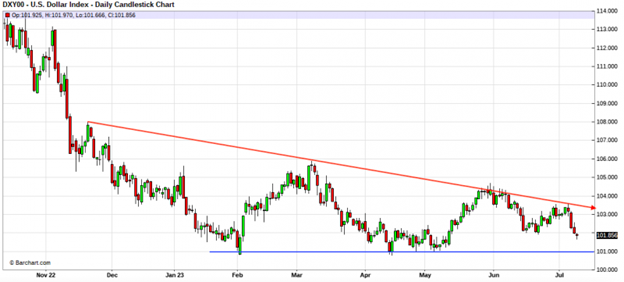
2. Does the chart below of the U.S. Dollar Index look like it’s ready to soar higher or break down lower? With higher interest rates allegedly pending, it's hard to find anyone who's currently bearish on the dollar. A breakdown through 101 later this summer would sure catch a lot of analysts by surprise.
Again, the price reaction across all markets to this week's U.S. inflation data will likely hold the key to unlocking these patterns, so keep an eye on the headlines. Buying low is always preferable to buying high, and as the charts suggest, your window to buying this current dip may be closing.
About the author


Our Ask The Expert interviewer Craig Hemke began his career in financial services in 1990 but retired in 2008 to focus on family and entrepreneurial opportunities. Since 2010, he has been the editor and publisher of the TF Metals Report found at TFMetalsReport.com, an online community for precious metal investors.