Inflation is one of the best determinants of gold price movements, because investors buy precious metals (gold, silver, platinum and palladium) as an inflation hedge when the prices of goods and services are rising faster than interest rates.
Although gold offers neither a yield (bonds, GICs) nor a dividend (stocks and mutual funds), it is considered a smart investment when inflation diminishes an investor’s principal or erodes the purchasing power of a currency.
Negative real rates
Gold is even more popular when real interest rates, typically the yield on the US 10-year Treasury note minus the inflation rate, are below zero, like currently.
The reason for this is simple, when real interest rates are at or below 0%, cash and bonds fall out of favor because the real return is lower than inflation. If you are earning 1.6% on your money from a government bond, but inflation is running 2.7%, the real rate you are earning is negative 1.1% — an investor is actually losing purchasing power. Gold is the most proven investment to offer a return greater than inflation, by its rising price, or at least not a loss of purchasing power.
Bond market and gold market observers keep a close eye on US Treasury yields, particularly the benchmark 10-year, because it serves as a proxy for other financial products, such as mortgage rates, and it also signals investor confidence. When there is low confidence in the economy, people want safe investments, and US Treasuries are considered among the safest. Demand for Treasuries bids up their prices and yields fall. Conversely, when confidence returns, investors dump their bonds, thinking they do not need to play it safe. This causes bond prices to sink and yields to climb.
The current 10-year Treasury note yields 1.3% and the July CPI rate of inflation is 5.4%, making real interest rates -4.1% — an ideal environment for gold prices to prosper.
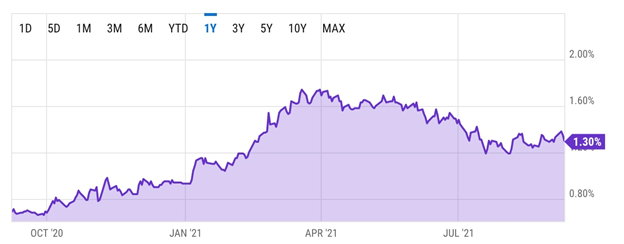 US 10-year Treasury yield. Source: YCharts
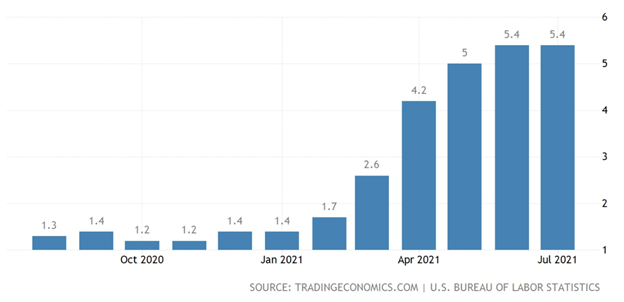 US inflation
Although gold prices have fallen recently, largely as a reaction to the economic recovery particularly in the two largest economies, the United States and China (in times of economic growth, investors prefer higher-risk equities), the precious metal’s year to date performance is actually impressive compared to the 52-week low of $1,686/oz reached on March 30. Gold’s march downward in the first quarter was mainly due to rising US Treasury yields (remember, the demand for gold moves inversely to interest rates — the higher the rate, the lower the demand for gold, the lower the rate, the higher the demand for gold) as a risk-tolerant market saw investors rotate funds out of bonds and into equities. They were also selling due to expectations of rising inflation, which turned out to be true.
Between March 30 and June 2, spot gold moved 13% higher, from $1,686 to $1,908. A mini-crash in June saw gold drop to $1,763 on the 18th, before recovering to $1,828 on Sept. 3. At time of writing, an ounce of gold was selling for $1,793.
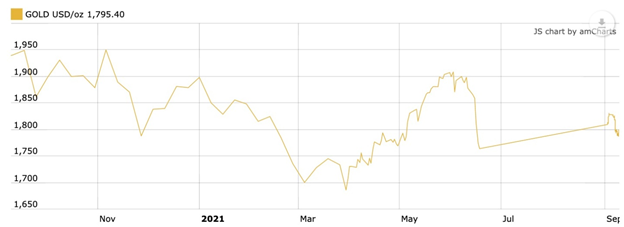 Source: Kitco
Stagflation warning
In our last article we had three prominent economists claiming that stagflation, defined as high inflation amid a recessionary or low-growth environment, is likely to dog the global economy for the medium to long term.
Nouriel Roubini identified nine supply shocks that are likely to keep the prices of goods and services elevated. They include the trend toward deglobalization and rising protectionism; the balkanization and reshoring of far-flung supply chains; and the nascent Sino-American cold war, which threatens to fragment the global economy.
Harvard economics professor Ken Rogoff, writing for Project Syndicate, suggests the parallels between the 2020s and the 1970s just keep growing. Has a sustained period of high inflation just become much more likely? Until recently, I would have said the odds were clearly against it. Now, I am not so sure, especially looking ahead a few years.
Rogoff points to two key similarities between the economic situation 50 years ago and the one currently: a supply shock (the 1973 oil embargo versus the current pandemic-related disruptions to supply chains), and a government spending spree (President Lyndon Johnson splashed out big-time during his “Great Society” programs followed by generous Vietnam War spending; the Trump and Biden administrations have, combined, doled out $5.8 trillion in pandemic relief, with trillions more in social/ climate spending, still to come from the Biden White House.)
Former Yale economics prof Stephen Roach summons the ghost of Arthur Burns, the Fed chair during the Nixon administration, in explaining how inflation is actually worse than reported.
Of course, the predictions of economists need to be taken with a large sprinkling of salt. An old joke has three of them hunting ducks. The first shoots 20 meters ahead of the ducks, the second shoots 20 meters behind the ducks, and the third says, “Great job! We got them!” (Investopedia)
If we are to believe that stagflation is really upon us, or coming soon, we must subject this thesis to a thorough AOTH analysis. An affirmative answer implies that inflation is rising and that growth is falling. We discuss each of these variables in turn.
Growth prospects dim
To most observers, the US economy has been doing well, growing at around 6.5% as virus-related restrictions are lifted amid a relatively successful vaccination campaign of around 60% fully inoculated.
However, recent numbers suggest there is no “V-shaped recovery” and that the economy is slowing down. As the Wall Street Journal reports, elevated covid-19 cases and hospitalizations especially from the delta variant, has the nation “tapping the brakes” in September, with businesses and consumers having to adjust to renewed mask mandates, travel restrictions and event cancelations.
The national debt is $28.7 trillion and we know that every percentage point of debt above 77% of GDP costs a country 0.017 percentage points in economic growth. For the US, currently at 120%, this knocks off almost an entire percentage point. How much longer can the economy keep growing at 6.5%? In my opinion less than a year, before growth levels off and drops to a more sedate pace. We already see this happening.
The pace of hiring plummeted in August, with employers adding just 235,000 jobs, compared to about a million in each of June and July. The Department of Labor was expecting 720,000. New restrictions saw restaurants and stores cut staff.
Consumer confidence fell to its lowest level since 2011 in July, with the Atlanta Fed reducing its Q3 forecast from 6% growth to 3.7%.
Total nonfarm employment is 5.3 million jobs below February 2020’s peak and labor force participation — the number employed or actively seeking employment divided by the working-age population — is well down from 2019 in the 25-54 age bracket.
According to MarketWatch, An economy that was expected to grow at a sizzling 7% annual pace from July through September is now seen expanding at a more modest 3% to 3.5% clip….
Goldman Sachs, Morgan Stanley, BMO Capital Markets, TD Securities and other firms cut their forecasts — some by more than half.
Bloomberg’s latest monthly survey saw forecasters trim their growth projections for the third quarter to 5% from 6.8% and for Q4, from 5.6% to 5.3%.
Globally, the latest World Economic Outlook is not exactly inspiring. While the July outlook foresees the global economy growing by 6% in 2021, it slows to 4.9% in 2022 — unchanged from April but with mark-downs for emerging market and developing economies, especially emerging Asia.
Inflation continues to climb
A run through the headlines produced a shed-load of evidence that the prices of goods and services are climbing across the board, in everything from metals, energy and fertilizer, to rocketing food, labor and shipping costs.
Over the past year, industrial metals such as copper, zinc and nickel have posted some impressive price gains. Singling out copper, the red metal hit a record high in May of $4.84/lb, amid surging demand from top commodities consumer China, and tight supply due to covid-related temporary mine closures last year in the copper-producing heartlands of Chile, Peru and Mexico.
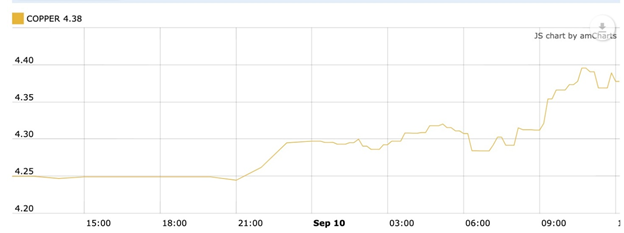 Source: Kitco
Heady copper prices are spurring some end users to seek cheaper alternatives. Makers of air conditioners, which account for a significant portion of the 15% of global copper demand that goes into home appliances, reportedly are mulling aluminum as a feedstock. Japan’s Daikan Industries plans to replace half of the copper in its units with aluminum by 2025.
The problem with this substitution strategy? Aluminum prices are skyrocketing, too. A coup in Guinea this week fueled concerns over shortages, pushing the lightweight metal to the highest in more than a decade, at $1.32/lb.
The African country is a major supplier of bauxite, the raw material needed to make aluminum.
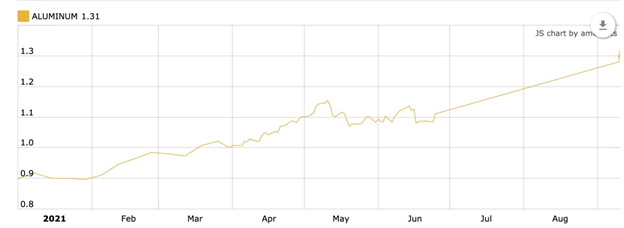 Source: Kitco
In a world that still runs on oil, the recovery from covid-19 has meant buoyant energy prices. Since plummeting to an all-time low of negative $14.85 a barrel, in April 2020, benchmark Brent crude has reacted to higher economic activity requiring more energy inputs, with a seven-fold price increase. The other benchmark, West Texas Intermediate (WTI) crude, shows a similar growth trajectory.
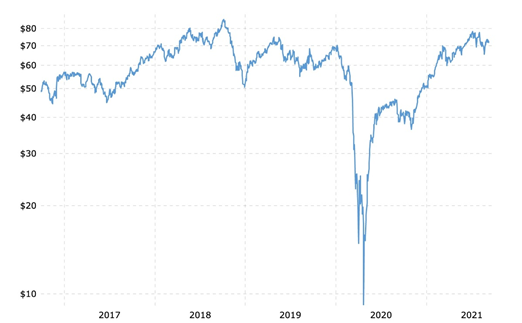 Brent crude price. Source: Macrotrends
Natural gas, a popular home heating fuel and the feedstock for liquefied natural gas (LNG), has also lit up the charts following years of lackluster price performance. According to Trading Economics, natural gas futures for October delivery touched almost $5 per million British thermal units for the first time since February 2014 on Wednesday boosted by strong demand and tight supply.
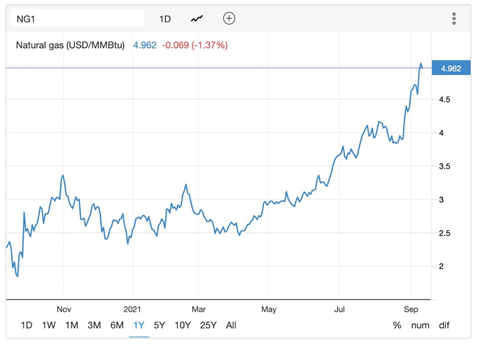 Source: Trading Economics
Food prices have been on the rise for months due to a combination of factors, including lingering covid-19 supply chain shocks; climbing freight costs and delays to move grocery items to markets, as the ocean shipping industry grapples with a shortage of containers and port congestion; heavy demand for food as major economies recover from pandemic-related restrictions; and lower expected yields/ production losses due to severe droughts in some of the world’s major breadbaskets, including the Ukraine, Brazil and the United States.
After two months of decline, world food prices jumped in August, elevated by gains for sugar, vegetable oil and some cereals. The UN Food and Agriculture Organization (FAO)’s food price index, which tracks the price of most globally traded food commodities, averaged 127.4 points in August compared to 123.5 in July, a year on year gain of 32.9%.
The Rome-based organization’s sugar index climbed 9.6% from July due to concerns over frost damage in Brazil, the world’s largest exporter of the sweet stuff. In Sri Lanka, government officials seized thousands of tonnes of sugar to prevent hoarding, a day after a state of emergency was declared over food shortages. News wire AFP says There have also been sharp price rises for rice, onions and potatoes, while long queues have formed outside stores because of shortages of milk powder, kerosene oil and cooking gas.
The FAO’s cereal price index rose 3.4% on lower harvest expectations. The forecast for wheat production saw the biggest downward revision, Reuters reported, down 15.2 million tonnes since July to 769.5 million tonnes — due mainly to adverse weather conditions in the United States, Canada, Kazakhstan and Russia.
Wheat prices in August gained 8.8% and barley surged 9%.
Along with lower crop yields and production, farmers are also facing an increase in the price of fertilizer. Earlier this month, the world’s largest nitrogen facility was forced to declare “force majeure” (temporary closure due to events beyond its control), after Hurricane Ida slammed into its Donaldsonville, Louisiana plant. On Sept. 7 Bloomberg reported the owner, CF Industries Holdings, saying it can’t fill orders, thus stoking fears of production losses and even higher food prices:
Fertilizer prices are already high, and that’s adding to increasing costs for farmers, who are paying more for everything from land and seeds to equipment. The higher costs of production may mean more food inflation is on the way. Global fertilizer costs touched near-decade highs in recent weeks, becoming expensive enough where growers may have to curb purchases.
The restaurant industry has faced a triple whammy of government-ordered restaurant/ bar closures, reduced capacities and supply chain disruptions. Taco Bell, Starbucks, KFC and McDonald’s are among the fast food chains warning customers about limited menu items or shortages. As reported by Zero Hedge, The poultry industry has been in tight supply all year due to labor shortages of workers at slaughterhouses, making it difficult for KFC and other fast-food chains to stock enough chicken.
The situation is so bad, the company can’t find enough product to promote its breaded chicken tenders on US television.

Any discussion of inflation would be incomplete without a data point on China, the world’s largest commodities consumer. Bloomberg reported on Thursday that China’s factory-gate inflation hit a 13-year high. Producer prices rose 9.5% in August compared to a year earlier, mostly driven by higher raw material costs, the National Bureau of Statistics said.
The table below shows commodity price movements over the past 12 months, with all but a handful increasing, some by wide margins. Among the best performers, Australian thermal coal and Russian natural gas top the list, at a respective +75.02% and +72.08% year to date, followed by gasoline (+44.4%), natural gas (42.3%), South African coal (+40.85%), and WTI crude oil (39.08%).
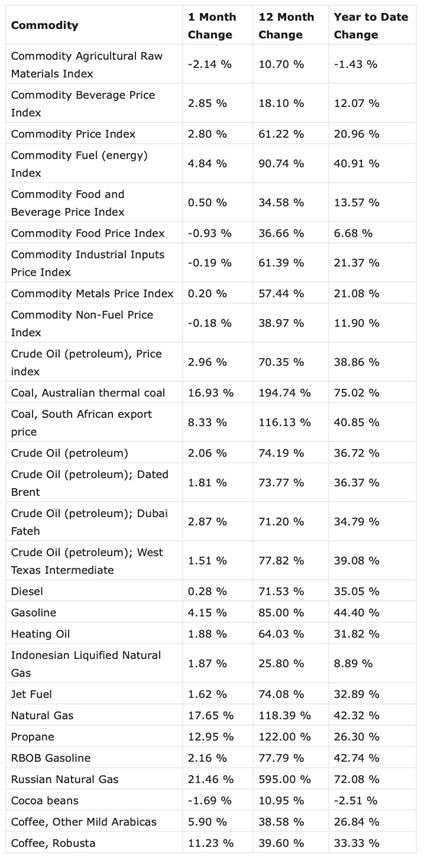
Shippers of practically all commodities and foodstuffs are falling victim to higher transportation costs, with dry bulk shipping rates at record highs and the prices charged by roll-on/roll-off (“ro-ro”) vessels, ships that carry wheeled cargos like cars, trucks and heavy machinery, through the roof. Ro-ro ships are reportedly demanding nearly $25,000 per day — more than triple the five-year average — with one vessel booked for three years at $30K/day, according to Pareto Securities AS.
Shipping rates are soaring due to a confluence of booming demand and disrupted supply chains among ports, vessels, trains and trucking companies that move good worldwide.
Industry experts say trans-pacific supply chains will remain swamped through at least the summer of 2022.
US inflation
Zeroing in on the United States, data next week is forecast to show consumer prices rising by more than 5% for a third straight month in August (July CPI was 5.4%).
Prices paid by producers increased in August by more than forecast due to persistent supply chain interruptions, as well as more expensive labor, Bloomberg reported on Friday, with the producer price index pushing 0.7% higher compared to July and +8.3% from a year ago.
We are getting a clearer picture of how much supply shortages are feeding into US inflation, and that inflation is “supply-side” not “demand-side”.
This week’s release of the Federal Reserve’s ‘Beige Book’— a regular narrative of the economy told by companies in the 12 Federal Reserve districts — listed “shortage” 77 times in September, up from 19 times in January, with labor-related shortages being most prominent. According to Wolf Street, These shortages “restrained” growth, and companies were “unable to meet demand” because of these shortages.
The report noted inflation is “steady at an elevated pace,” with half the Fed’s 12 districts reporting “strong” pressure while the other half said it was “moderate.”
For the third straight month, wages for the low-skilled rose faster than for high-skilled individuals, in August climbing the most since 2008. This is easily explained. With covid, employers have had to add incentives to get people to work lower-paying jobs because many would rather stay on UI and accept government “stimmies” (stimulus payments) rather than work.
“Employers were reported to be using more frequent raises, bonuses, training, and flexible work arrangements to attract and retain workers,” the report said.
In the meantime, the US (and Canadian) economy is experiencing a shortage of job-seekers. Unfilled job openings in July spiked to a new record, of 11.2 million, up 52% from July 2019, according to the JOLTS report by the Bureau of Labor Statistics.
Despite weak hiring, wages are increasing. The Labor Department’s monthly jobs report showed that wages in leisure and tourism, which saw zero net job growth in August, rose 1.3% for the month and 10.3% for the year. CNBC reported average hourly earnings climbed 0.6% in August, about double what Wall Street had been expecting.
Via CNBC, the Beige Book reports businesses are experiencing escalating inflation that is being aggravated by a shortage of goods and likely will be passed onto consumers in many areas.
Bloomberg said materials shortages, shipping bottlenecks and hiring difficulties will likely continue to put broader upward pressure on prices in the months ahead.
Surveys indicate that Americans (and Canadians) are increasingly worried about escalating inflation, a topic that has received ample coverage in the current Canadian federal election campaign. A recent poll by Primerica, mentioned by CBS News, shows American families making between $30,000 and $100,000 are staying optimistic about their finances, but they’re concerned about the rising cost of necessities and their retirement savings.
Earlier this year, a CIBC survey found a majority of Canadians are worried about inflation, with 60% listing the rising costs of goods as their greatest financial concern in 2021.
Along with rising food and gas prices, one of the most noticeable manifestations of inflation for the average Joe and Jane is the increase in rent.
BNN Bloomberg reports apartment rents were up in August from a year earlier in all 30 US metropolitan areas — with the national average rent for multi-family buildings rising 10.3% from August 2020, to US$1,539. This compares to an average 2% annual rent increase over the past decade.
Larger rental homes saw an even bigger increase of 13.9%. Rents in Phoenix, Tampa and Las Vegas reportedly surged 20%.
An obvious reason for rent increases in the US, is the expired federal moratorium on evictions. Legal efforts by the Biden administration to extend the moratorium put in by the Trump White House were rejected by the Supreme Court, effectively freeing landlords to raise rents.
The surge in housing prices that began 18 months is another factor likely to keep increasing rents. House-price growth historically leads rent inflation and OER (owner’s equivalent rent) inflation by a little less than two years. (OER is how economists convert housing from an asset to a service for the purpose of measuring inflation)
Notably with the pandemic still raging, and making matters worse for low-income families and individuals already struggling with higher rents and grocery bills, pharmaceutical companies raised the prices of 500 medicines according to an analysis by healthcare firm 46brooklyn. The announcement accompanied a Reuters report that said the Biden administration unveiled its promised initiative to cut drug prices.
Conclusion
In our three-part series on ‘The Debt Trap’, we showed how out-of-control debt has become a millstone around the necks of some of the world’s largest economies.
Global debt more than doubled from US$116 trillion in 2007 to $244 trillion in 2019. It now sits at $281 trillion.
The United States is the undisputed champion of unsustainable IOUs; the country is approaching a national debt of $29 trillion. In fact the debt is likely to hit at least $34 trillion by the end of this year, with all the spending promises laid out by the Biden administration, either passed by Congress or in progress.
There is a clear link between a rising debt to GDP ratio and gold prices. In October 2020 the US ratio surpassed 100% for the first time since the Second World War; it now sits at 125%, not much lower than Italy’s 155%. Italy has long been considered a debt-ridden basketcase of an economy, incomparable to the United States backed by the mighty greenback. Yet some commentators are beginning to see the United States heading down the same financial road to ruin. Read more here
There are historical examples of hyperinflation (Germany, Zimbabwe, Venezuela) and banking crises (Argentina, Ireland) whereby citizens lost faith in their money. Trust in the US government is at all-time low; only 25% of the population has any faith in fat-cat Washington politicians.
As a recent New Yorker article reminds us, since coming off the gold standard in 1971, the thing you’re trusting is the full faith and credit of the United States government. Fractional-reserve banking, which allows a bank to lend far more in credit than it has in deposits, has driven capitalism for centuries. Many economic crises, when examined closely, turn out to be crises of confidence. This is obviously true of a bank run, when depositors lose faith in the fractional-reserve system, but it’s also true of hyperinflationary spirals, when worries about a country’s handling of monetary policy yank down the value of its currency. There is a reason that the core language of commerce—of bonds and credits—is all about belief.
The pandemic is testing belief in the dollar and other major currencies like never before.
Excessive money-printing not only in the United States, but Britain and the EU, is continuing to devalue currencies at an alarming rate (this, by definition, is inflation, because it takes more units of currency to buy the same amount of goods as before) — for which precious metals, namely gold and silver, are the best defence.
Inflation erodes the purchasing power of fiat currencies and eventually they become worthless.
The dollar has lost 90% of its purchasing power since 1950.
By contrast, since 1972 gold has gone from $35/oz to $1,800.
Three leading economists are predicting that stagflation is what’s next in store, if inflation in all the areas we have outlined above — metals, crops, food, fertilizer, energy, rent, shipping costs, wages, etc. — continue to accelerate.
The evidence shows that supply shocks are the main driver behind the current inflationary spiral. It will take time to correct these supply-chain disruptions, which arguably, runs counter to the Fed’s assertion that price rises beyond the Fed’s 2% inflation target are temporary. Structural supply deficits for certain metals, like copper, are clearly of a more permanent nature. It takes years to develop new metal mines. In some jurisdictions, like North America, developing a mine can drag on for up to two decades. The shipping container shortage and skyrocketing freight rates are expected to last another year. More rent increases following the lifting of the moratorium on evictions, and as rents catch up with housing prices, are virtually guaranteed.
One of the stagflation article authors noted that Stagflation could be avoided through major economic growth and big productivity gains, but that’s unlikely because productivity has already been crippled by American governments’ lockdowns and covid stimulus policies in 2020. Logistics and supply chains are in disarray. The workforce is still down 5.3 million workers from its peak eighteen months ago.
Unless something changes soon, this all points toward a scenario of stagflation.
Arguably we are already there. In the first part of this article we showed that economic growth in the US is slowing and the prediction is that global growth next year will be less than 2021. I’ve said it before and I’ll say it again: In my opinion robust US GDP growth will last less than a year, before it levels off and drops to a more sedate pace. We already see this happening. The low-growth story, the “stag” part of stagflation, is beginning to come true, and we have more than demonstrated the myriad examples of inflation — maybe not hyperinflation, but a growing cancer of higher prices that eventually will be tough to deny, even for Fed officials hoping they go away.
Owning gold (and silver) continues to be the best defense against inflation, stagflation, and rampant currency debasement, during this period of unprecedented and irresponsible debt accumulation.
In Gold We Trust
Richard (Rick) Mills
aheadoftheherd.com
Legal Notice / Disclaimer
Ahead of the Herd newsletter, aheadoftheherd.com, hereafter known as AOTH.
Please read the entire Disclaimer carefully before you use this website or read the newsletter. If you do not agree to all the AOTH/Richard Mills Disclaimer, do not access/read this website/newsletter/article, or any of its pages. By reading/using this AOTH/Richard Mills website/newsletter/article, and whether you actually read this Disclaimer, you are deemed to have accepted it.
Any AOTH/Richard Mills document is not, and should not be, construed as an offer to sell or the solicitation of an offer to purchase or subscribe for any investment.
AOTH/Richard Mills has based this document on information obtained from sources he believes to be reliable, but which has not been independently verified.
AOTH/Richard Mills makes no guarantee, representation or warranty and accepts no responsibility or liability as to its accuracy or completeness.
Expressions of opinion are those of AOTH/Richard Mills only and are subject to change without notice.
AOTH/Richard Mills assumes no warranty, liability or guarantee for the current relevance, correctness or completeness of any information provided within this Report and will not be held liable for the consequence of reliance upon any opinion or statement contained herein or any omission.
Furthermore, AOTH/Richard Mills assumes no liability for any direct or indirect loss or damage for lost profit, which you may incur as a result of the use and existence of the information provided within this AOTH/Richard Mills Report.
You agree that by reading AOTH/Richard Mills articles, you are acting at your OWN RISK. In no event should AOTH/Richard Mills liable for any direct or indirect trading losses caused by any information contained in AOTH/Richard Mills articles. Information in AOTH/Richard Mills articles is not an offer to sell or a solicitation of an offer to buy any security. AOTH/Richard Mills is not suggesting the transacting of any financial instruments.
Our publications are not a recommendation to buy or sell a security – no information posted on this site is to be considered investment advice or a recommendation to do anything involving finance or money aside from performing your own due diligence and consulting with your personal registered broker/financial advisor.
AOTH/Richard Mills recommends that before investing in any securities, you consult with a professional financial planner or advisor, and that you should conduct a complete and independent investigation before investing in any security after prudent consideration of all pertinent risks. Ahead of the Herd is not a registered broker, dealer, analyst, or advisor. We hold no investment licenses and may not sell, offer to sell, or offer to buy any security.


