
- Today is Valentine’s Day. It’s also CPI report day. On this interesting day, will there be love for gold?
- For some insight into the matter, please click here.
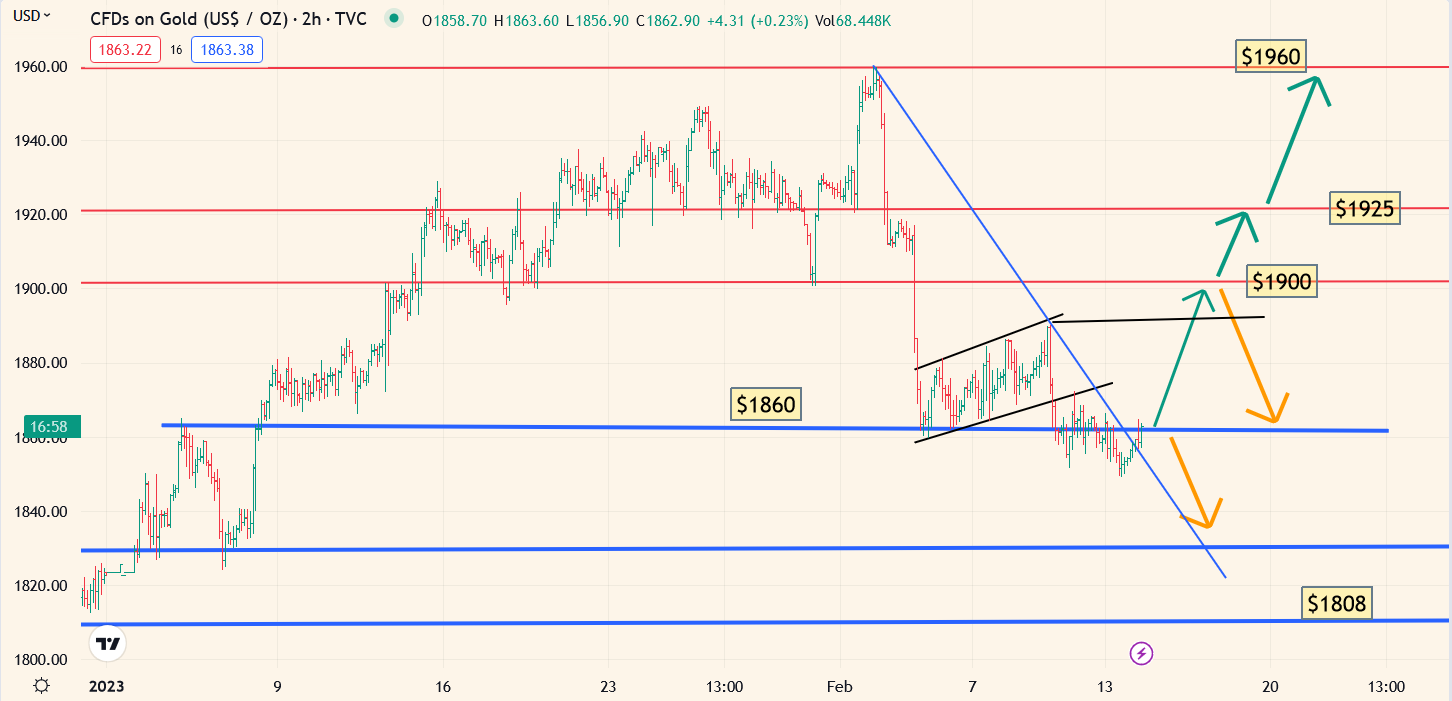 Double-click to enlarge this short-term gold chart. For the past few days, gold has been oozing around $1860 after staging a $100/oz “price sale”.
 - The drop happened after roughly a $350/oz rally from $1610 to $1960. The bottom line: Given the size of the rally, the $100 pullback, although violent, is normal and expected.
- Please click here now. Double-click to enlarge this daily gold chart. The good news is that the lead line of the 14,7,7 series Stochastics oscillator is now oversold.
- The next positive event would be a crossover buy signal for the oscillator that occurs with the gold price above the 618 day moving average (a key Fibonacci number).
- Please click here now. Double-click to enlarge. On the weekly chart, the 14,5,5 series Stochastics oscillator is overbought and flashing a sell signal.
- All investors can do is cheer for higher prices and hope for a “flat line” event for the oscillator in the overbought zone.
- What about the fundamentals? Well, hopes for a duty cut from the Indian government are gone for now, but China’s economy continues to rebound.
- Please click here now. In the last election, some republicans decided that the endless bravado and “America is number one!” tweets of gibberish from President “Super Trumpy Man” were reason enough to vote for a deranged draft dodger turned chicken hawk. They got President “Jackboot Joe”.
- While it’s obvious that the US government has already failed in yet another disastrous debt-funded war (Ukraine), what’s more concerning is that money and arms for the corrupt Ukrainian government may be diverted towards starting an even more horrifying war against China in Taiwan.
- While this is horrifying news for the citizens of Taiwan and for the whole world, it’s great news for gold.
- What about the US stock market? Well, please click here now. Double-click to enlarge. The consensus of US money managers is that the Fed will cut three times in 2023 and go on a wild cutting streak in 2024.
- That’s the basis of the maniacal buying of the US stock market that has occurred since I issued my shocking buy signal at Dow 30,000.
- Fed leader Jay has been adamant that these anticipated rate cuts won’t play out as expected. If his actions match his words, the stock market rally will die.
- The money managers expect America to slide into recession. If that happens and Jay remains firm, the stock market won’t simply decline… it will turn into what is best described as… a towering rice paper inferno.
- Jay will likely be watching the price action of oil closely for cues about inflation. On that note, please click here now. Double-click to enlarge. A large bull wedge breakout is in play, but so is a negative H&S top pattern.
- It’s possible that oil oozes back into the wedge pattern and trades near $65 before beginning a big leg higher.
- Please click here now. The dollar index sports a huge H&S top. A break below the neckline would occur at the key number of 100. Mainstream analysts are focused on Fed rate cuts as the driver for a lower dollar, but I would suggest they need to be open to a scenario where the Euro zone and Japan become more hawkish, while the Fed stands firm.
- My scenario is negative for the dollar and the stock market. It’s positive for oil since oil trades in dollars.
- In the short-term, the mainstream thesis of imminent rate cuts and a lull in the war cycle has seen the stock market favoured. Gold, silver, and the miners have swooned. Can the situation change?
- Well, please click here now. Metals market investors need some patience. It will take a few more months for money managers to learn (the hard way) that Jay isn’t a stock market investor’s whipping boy who does all their bidding.
- The inflation era is only beginning, and as the stock market rally dies, rates continue higher, oil moves back above $100, and tensions with China increase, money managers will turn to the miners with the most consistency since the 1970s. Are investors prepared?
- Please click here now. Double-click to enlarge this awesome GOAU chart. The pullback has put GOAU at the outskirts of a massive support zone and a huge C&H (cup and handle) pattern may be in play.
- In a nutshell: mining stock investors need to jettison concerns, put on their space helmets, wave some pom poms, and get ready for the bull era ride of a lifetime!
Thanks!
Cheers
St
About the author
