
From “Nigh” to “Awry” indeed, as straightaway we run with this rare reprise: “Boy, Did I Get a Wrong Number!” –[Hope, Sommer, Diller; UA, ’66].
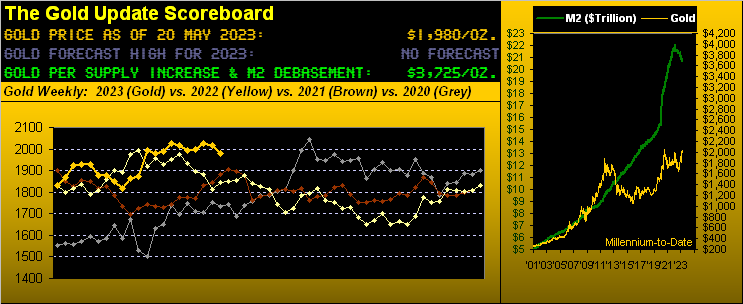
Since mid-March, our oft-stated target for Gold has at minimum been its still-standing All-Time High of 2089 … and beyond! … such that throughout we’ve not chosen a forecast high for this year. But come 04 May, the jive to 2085 was the most Gold could thrive, only to since see the yellow metal then dive -131 points to 1954 in settling out this past week yesterday (Friday) at 1980. Way not to go, mmb…
 … albeit hardly are we throwing out the baby (let alone this old man) with the bathwater.
But worse, having been caught up in our own fundamental fervour that this finally was “IT“ — e.g. that Gold at long last was going to imminently break up through 2089 en route to the mid-2100s come July — we instead committed a cardinal error. (Ready?)
We ignored the very leading essence of our own website’s analytics which from two weeks ago had already begun pointing to near-term lower levels for the precious metals. ![]() “Whoomp! (There It Is)”
“Whoomp! (There It Is)”![]()
“Now don’t beat up on yourself too much there, mmb.”
Regardless, dear Squire, we rather recklessly ditched our reliably leading indicators on the exceptional notion that this time ’round Gold was well and truly en route to new uncharted upside territory. Even as weakness in our Market Trends‘ “Baby Blues” (notably so for Silver) began to set in; even as on 04 May by Market Values Gold was still trading +44 points above its smooth valuation line after having more so been +153 points above same just back on 13 April; even as on 11 May Gold crossed below its Market Magnet. All tried and true leading signals across better than two decades … and all of which we ignored. Instead, we stayed on go for Gold to glow whilst our own stuff warned of a blow. Thus now, here’s what Gold’s weekly bars show:
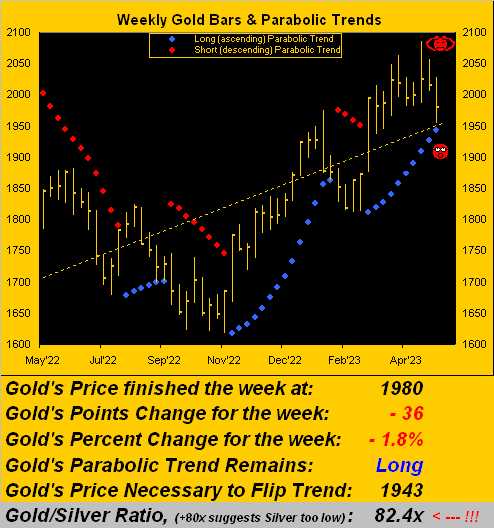
No, ’tis not the prettiest of pictures. Given: price today at 1980, the ensuing week’s parabolic “flip to Short” level just -37 points lower at 1943, and Gold’s “expected weekly trading range” now 65 points, the present parabolic Long trend can swiftly end in tears. Either Gold right now resumes adroitly up, or the combination of the blue parabolic dots rising at a weekly pace of +16 points and just a wee drop in actual price, and ’tis over. A new Short trend would then ensue, and by Gold’s price structure, even the 1800s may return anew.
Oh to be sure, we cannot imagine any more Gold positives than are already in play. Yes, the Dollar’s been “firming” a bit, but you know, and we know, and everyone who’s being paying attention from Bangor Maine to Honolulu and right ’round the world knows that Gold plays no currency favorites, as herein graphically exhibited ad nauseam over the years.
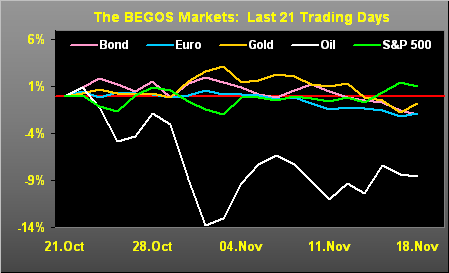
Moreover, ’tis not just the precious metals that are somewhat stifled of late. For across the past 21 trading days (one month) — with the exception of the S&P 500 — the seven other components which make up BEGOS (Bond, Euro/Swiss, Gold/Silver/Copper, Oil, S&P) are sporting negative linear regression trends. In fact, here are the percentage tracks for the five primary components since a month ago, essentially exhibiting a general markets’ malaise (Oil having traced an even more negative phase):
And yet that said, nothing markets-wise seems natural anymore, save for the fact that price is never wrong: we cannot will Gold to eclipse 2089 just as we cannot will the S&P 500 (today 4199) to return to a rational earnings valuation in the mid-2000s. But we steadfastly believe in due course that both will. And yet as my fine friend and business partner here quips along with me: “Everything we learned in Portfolio Theory has become useless.” At least until means reversion again comes to the fore as is its historical encore.
And speaking of earnings, let’s take a moment to assess those of the S&P 500. One year ago on 19 May 2022, the S&P stood at 3901: ’tis today at 4199, an increase of 6.9%. Similarly on that exact day a year ago, our “live” price/earnings ratio for the S&P was 29.8x: ’tis today at 52.9x, an increase of 43.7%, (which differs considerably from the “parroted” P/E of 24.3x courtesy of the “nobody actually does the math” crowd). Why so high? Simple: Q1 Earnings Season just ended. Therein, 450 S&P 500 constituents reported. Excluding the three terrible COVID quarters (Q1, Q2 and Q3 of 2020), this year’s Q1 Earnings Season ranks second-worst since Q3 of 2017 as only 56% bettered their year-over-year results … which means 44% did not so do. (What ever happened to the coveted “high quality” standards necessary to be in the S&P, hmmm?)
Either way, not to worry per this recent (hilarious) statement from the great multinational Royal Bank of Canada: “…On the surface, Q1 earnings season looks pretty good … S&P 500 earnings per share (EPS) is on pace to decline 4.2 percent year over year, better than the consensus forecast of a 6.7 percent decline at the end of the quarter…” The Investing Age of Stoopid rolls on…
Then again, are things actually getting better? A StateSide Debt Default aside — an economic catastrophe that U.S. Secretary of the Treasury Janet “Old Yeller” Yellen rightly deems would be “severe” — our Economic Barometer has been doing quite nicely of late:
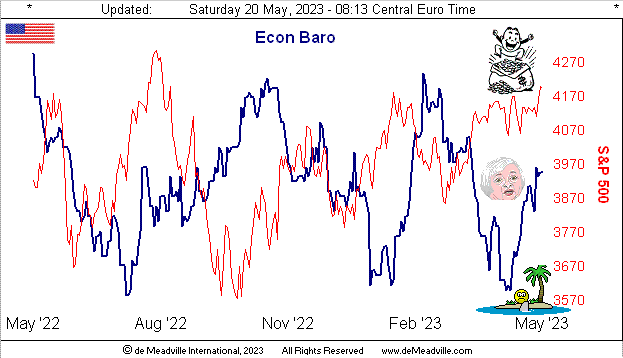
Of the past week’s 13 metrics which came into the Econ Baro, 10 were period-over-period improvements across quite a spectrum of indicators, including May’s Philly Fed Index and NAHB Housing Index, April’s Retail Sales, Housing Starts, Industrial Production, Capacity Utilization, and the Conference Board’s Leading (i.e. “lagging” given the Baro always being in the lead) Indicators, plus a working off of March’s Business Inventories. Nonetheless, we’re a bit hesitant to cue up Elvin Bishop’s ’75 hit ![]() “Sure feels good feelin’ good again “
“Sure feels good feelin’ good again “![]()
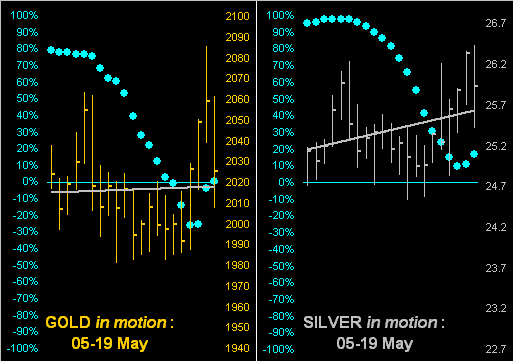
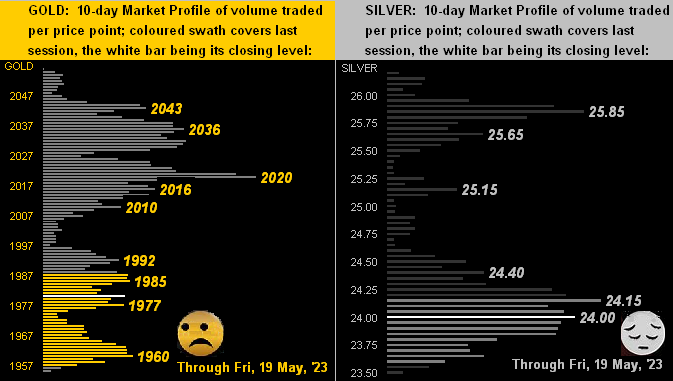
Meanwhile from the “‘Tis Not a Beauty Contest Dept.” we go to our 10-day Market Profiles for Gold on the left and for Silver on the right. From their highs of just over two weeks ago, Gold has fallen as much as -6.3% whilst Silver has repelled nearly double that at -11.2%. No happy faces there;
Such repelling notwithstanding, let’s wrap with this from the “Cooler Heads Prevail Dept.“
We’re on occasion asked, “What’s it gonna take for Gold to really go up?” Answer: the same thing it takes for any market to go up –> more offers being hit than bids. Whilst Gold is very actively traded, (year-to-date COMEX volume alone running at an average of 2.53 contracts traded per second, each contract controlling 100 ounces of Gold, which by today’s price is an average traded claim on Gold of $501,000 per second), the universe of trading entities is not materially expanding given maximum “open interest” is not growing beyond some 400,000 contracts. And we understand Gold remains significantly “under-owned” vis-à-vis managed portfolio allocation.
‘Course, that can all change in a heartbeat: “Hey Mabel? Our Treasury check never showed up this time!” Followed by: “Hey Mabel! I sold some stock but the broker says they don’t actually have the money to pay us!” Hey Egbert: finally now you’ll try to get some Gold, eh? The moral of the story thus being –> do NOT be that guy:

Cheers!
…m…
www.TheGoldUpdate.com
www.deMeadville.com
and now on Twitter: @deMeadvillePro
deMeadville. Copyright Ⓒ 2010 - 2023. All Rights Reserved.
About the author
