
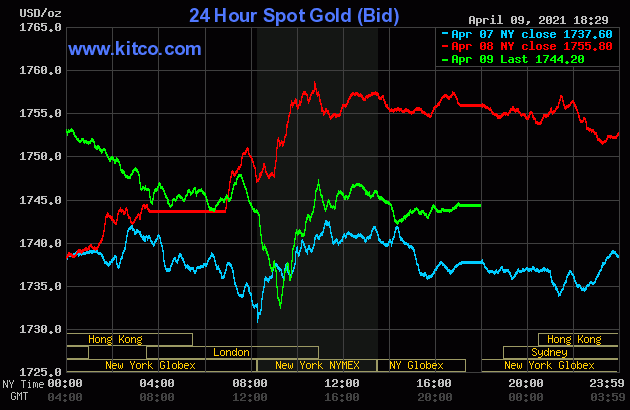
The gold price was stair-stepped lower in price starting at 10 a.m. China Standard Time on their Friday morning -- and the Big 4/8 traders set the low tick at 9:15 a.m. in New York. Its subsequent rally was capped and turned sideways to a bit lower around 10:45 a.m. -- and it didn't do much after that.
The high and low ticks in gold yesterday were recorded as $1,758.20 and $1,730.80 in the June contract. The June/August price spread differential in silver at the close yesterday was $2.00...August/October was $1.90 -- and October/December was $2.00...all signs of a very, very tight wholesale market.
Gold was closed on Friday afternoon in New York at $1,744.20 spot, down $11.60 from Thursday. Net volume, although higher than it has been lately, was still very much on the lighter side at a bit under 164,000 contracts -- and there was a bit over 8,400 contracts worth of roll-over/switch volume on top of that...mostly into August, with a bit into December.
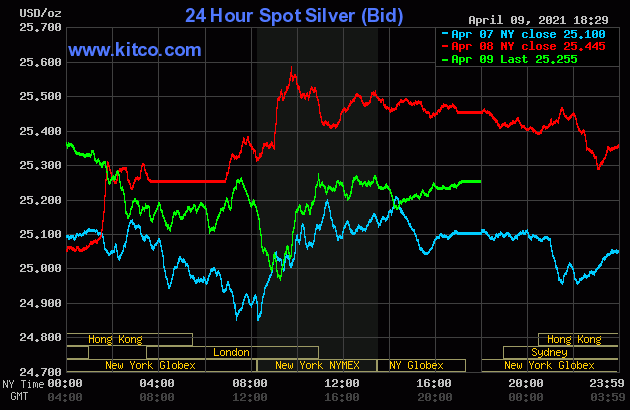
For all intents and purposes, the Big 4/8 traders managed the silver price in a similar fashion as they did gold, including the same identical price inflection points, so I'll spare you the play-by-play once again.
The high and low ticks in silver were reported by the CME Group as $25.555 and $25.01 in the May contract. The May/July price spread differential in silver at the close yesterday was 3.4 cents...July/September was 3.0 cents -- and September/December was 3.3 cents. The wholesale silver market continues to be super tight as well.
Silver was closed in New York on Friday afternoon at $25.255 spot, down 19 cents on day. Net volume was pretty quiet at a hair over 45,000 contracts -- and there was 18,000 contracts worth of roll-over/switch volume out of May and into future months...mostly into July.
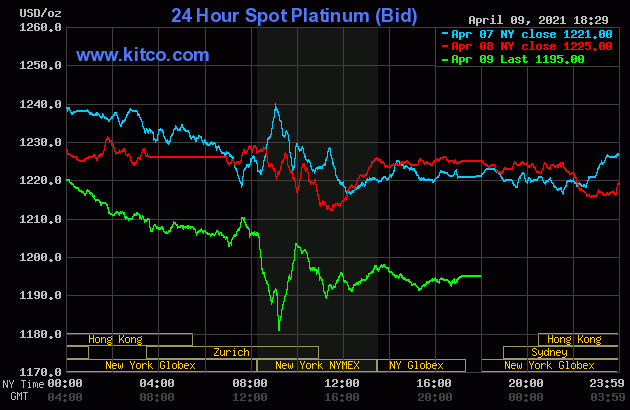
The price pressure in platinum started around 9:30 a.m. China Standard Time on their Friday morning -- and that quiet sell-off continued until minutes after the COMEX open. Then it really got its lights punched out, with the low tick coming very shortly after 9 a.m. EDT. Its ensuing rally was capped and turned lower at the 10 a.m. EDT afternoon gold fix in London -- and that sell-off lasted until shortly after the 11 a.m. EDT Zurich close. It didn't do much of anything after that. Platinum was closed at $1,195 spot, down 30 bucks from Thursday.
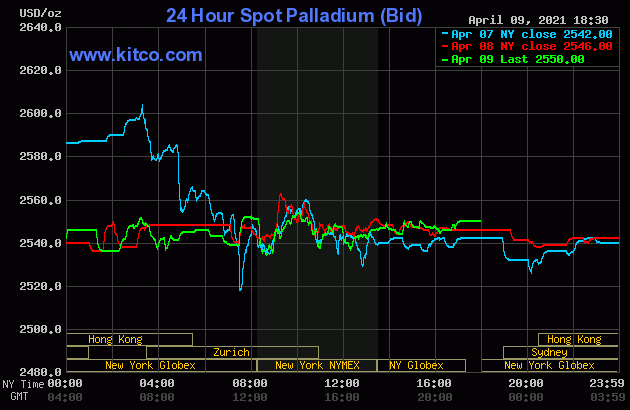
The Big 4/8 traders left the palladium price to its own devices yesterday -- and it didn't do much during the entire Friday trading session anywhere on Planet Earth. Palladium finished the day at $2,550 spot, up 4 dollars from Thursday's close.
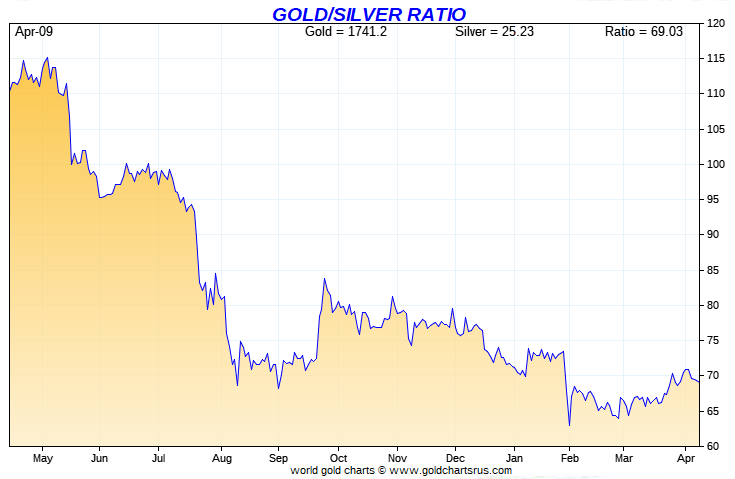
Based on the kitco.com-recorded spot closing prices in silver and gold posted above, the gold/silver ratio worked out to 69.1 to 1 on Friday...compared to 69.0 to 1 on Thursday.
And here's the 1-year Gold/Silver Ratio Chart from Nick, updated with this past week's data. Click to enlarge if necessary.
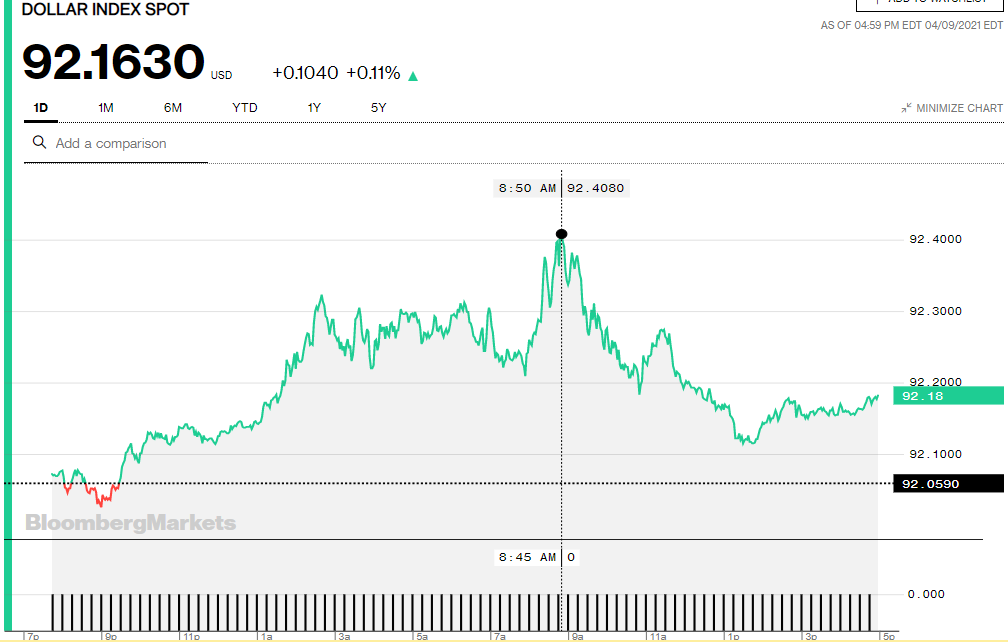
The dollar index closed very late on Thursday afternoon in New York at 92.059 -- and opened higher by one basis point and a bit once trading commenced around 7:45 p.m. EDT on Thursday evening, which was 7:45 a.m. China Standard Time on their Friday morning. It was sold a bit lower from there -- and the 92.03 low tick was set at precisely 9:00 a.m. in Shanghai. From that point it stair-stepped its way quietly and somewhat unevenly higher until the 92.41 high tick was set at 8:50 a.m. in New York. It was down hill from there until the 1:30 p.m. COMEX close -- and it crawled a bit higher from that juncture until trading ended at 5:30 p.m. EDT.
The dollar index finished the Friday trading session in New York at 92.163...up about 10.5 basis points from its close on Thursday.
Here's the DXY chart for Friday, thanks to Bloomberg as always. Click to enlarge.
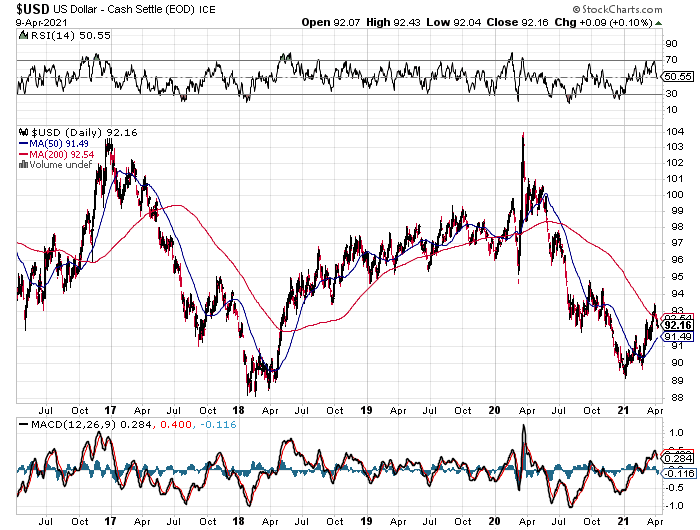
And here's the 5-year U.S. dollar index chart, courtesy of the good folks over at the stockcharts.com Internet site. The delta between its close...92.16...and the close on the DXY chart above, was a small fraction of 1 basis point on Friday. Click to enlarge as well.
U.S. 10-Year Treasury: 1.6660%...up 0.0340...(+2.08%) as of 2:59PM EDT.
![]()
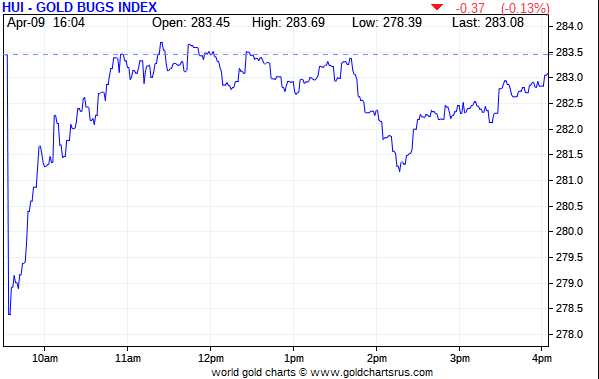
The gold stocks gapped down at the 9:30 a.m. open in New York on Friday morning, but then roared higher -- and were back at the unchanged mark by shortly before 11 a.m. EDT. They didn't do much from there until around 1:45 p.m. -- and were then sold lower over the next thirty minutes. From that point they rallied steadily until the market closed at 4:00 p.m. in New York. The HUI finished down only 0.13 percent.
Read the full article: A Less-Than-Thrilling COT Report
About the author
