
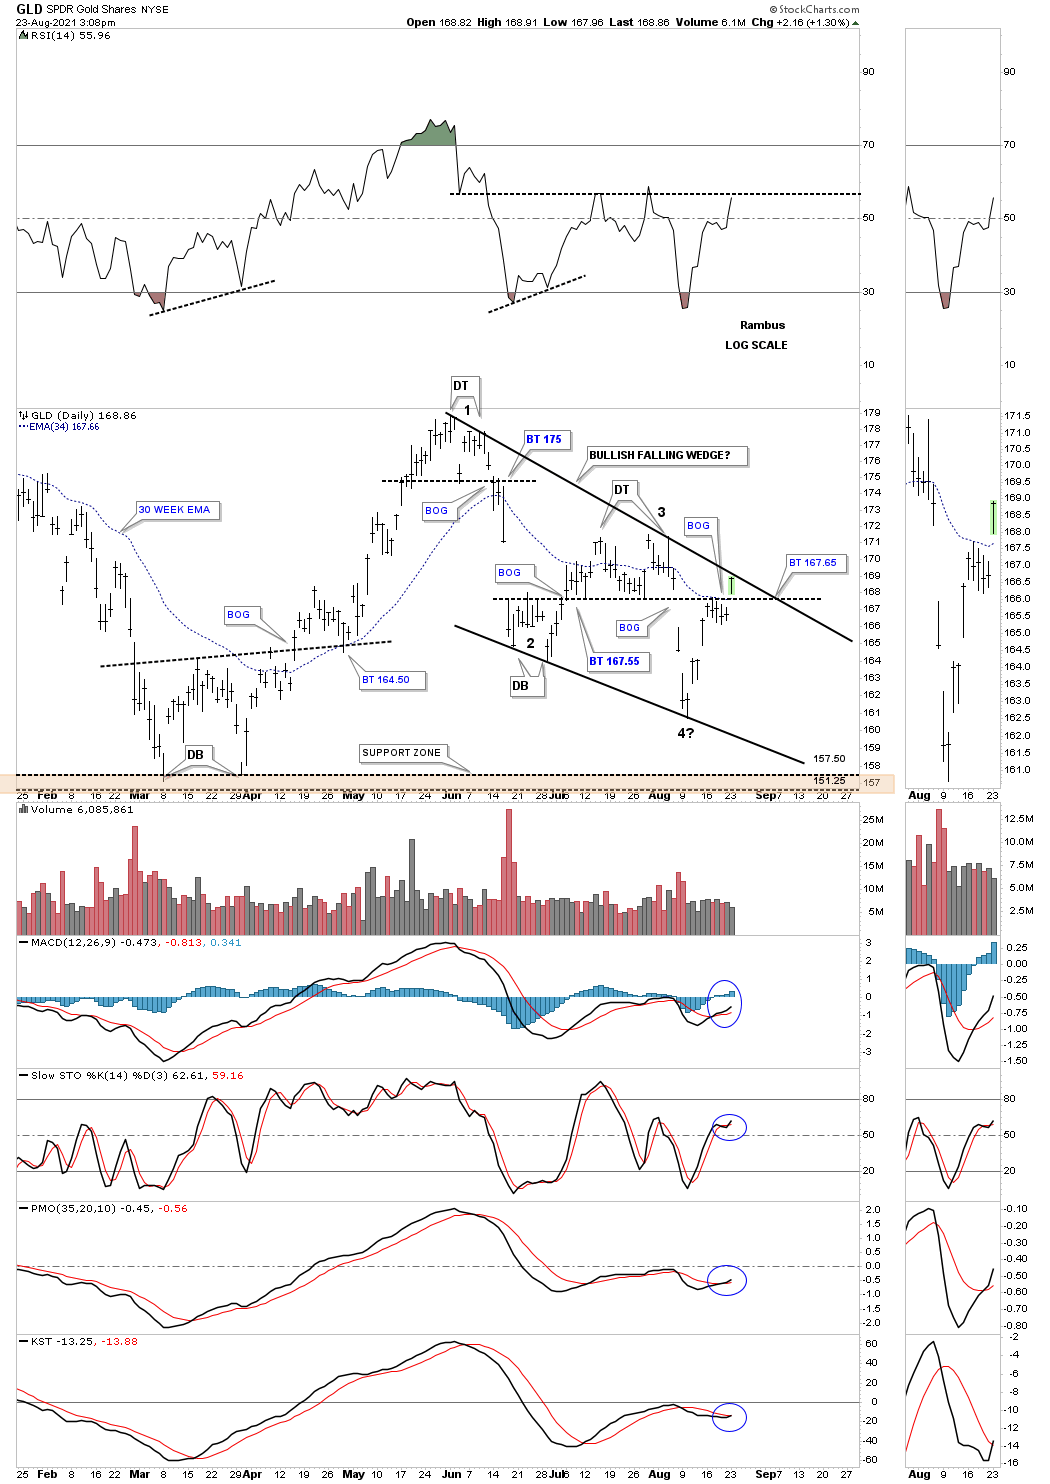
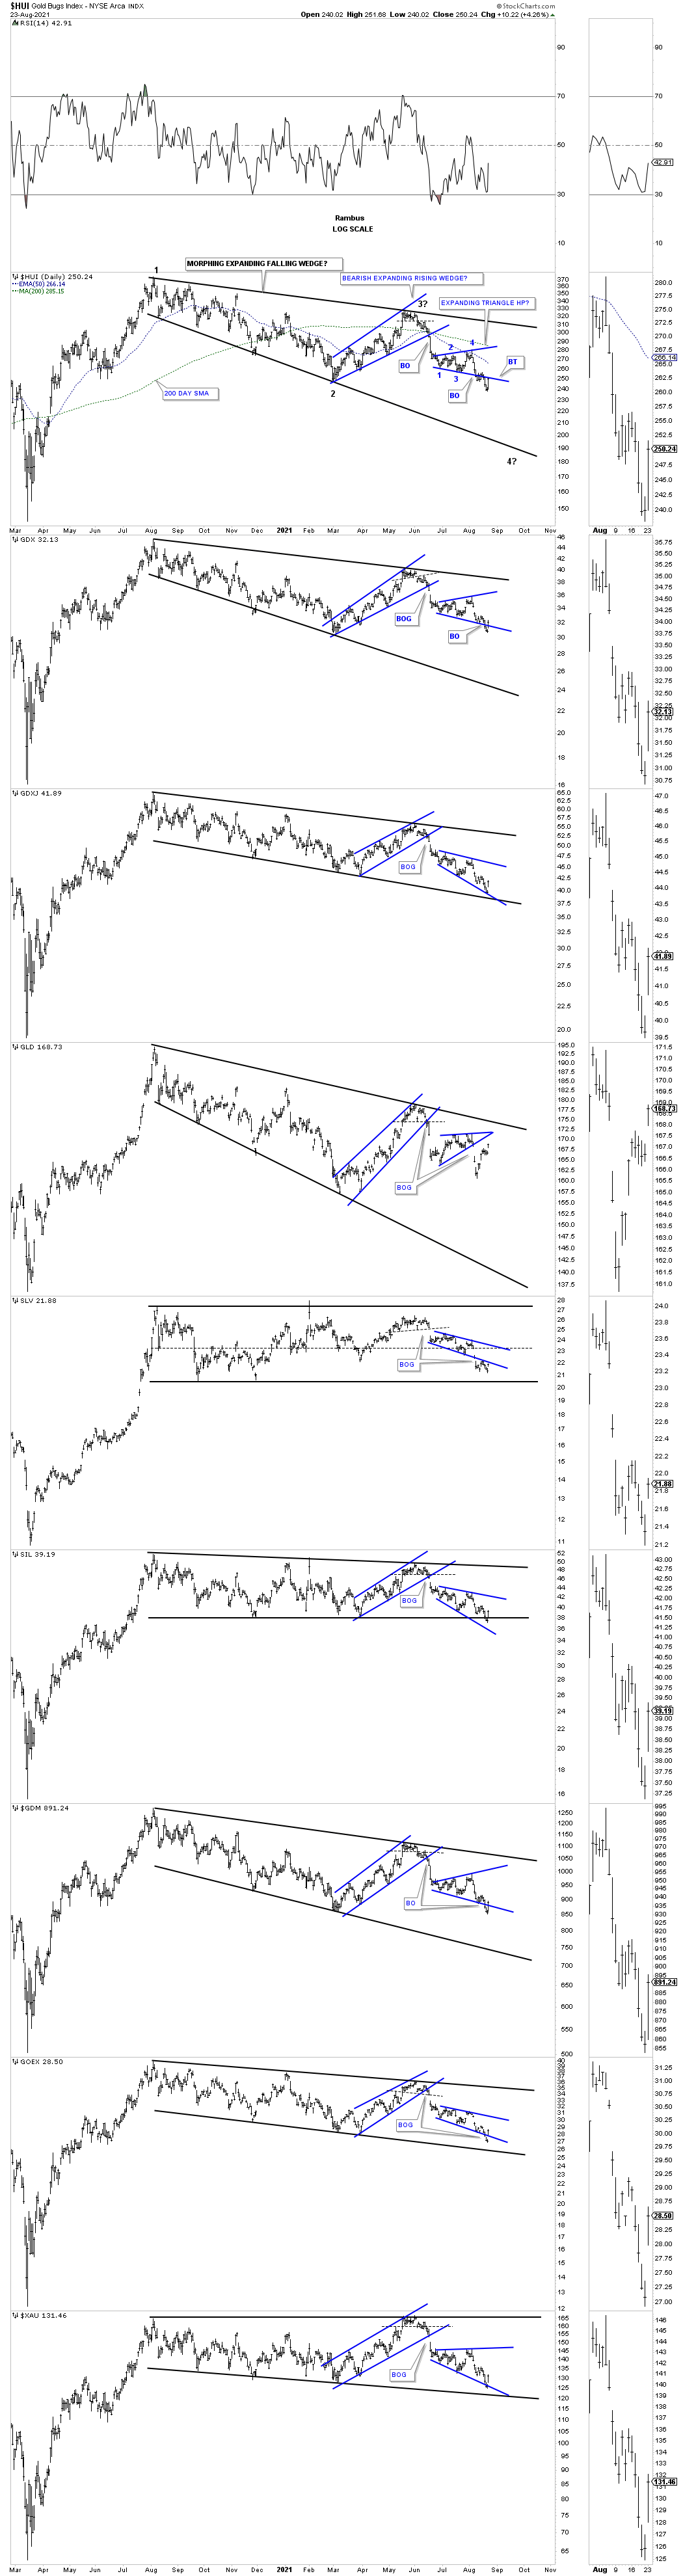
There is a potential new pattern forming in the PM complex which I first notice on the short term daily chart for GLD. Below is the daily chart GLD we looked at late last week which was showing the multiple double tops and double bottoms. The price action had been trading just below the double top trendline for about five days or so. This morning GLD gapped above the double top trendline and is now trading just below the top rail of a potential bullish falling wedge completing the all important 4th reversal point. We could possibly see a small ping pong move between the double top trendine at the 167.65 area and the top rail of the possible bullish falling wedge.
Lets put that potential bullish falling wedge in perspective by looking at a long term daily chart going back to the March 2020 crash low. Note the black dashed horizontal S&R line at 157 that stretches all the way back to the bottom rail of the blue rectangle consolidation pattern that formed during the first impulse move up. That rectangle also held support at the March 2021 double bottom low so we know that S&R line is hot.
Normally before an important move is about to begin it is not unusual to see an undercut of an important trendline that takes out all the sell/stops. So far the falling wedge is trading well above the S&R line. There is no law that says we have to see an undercut that produces a bear trap but it would be good confirmation if we did. If the bulls are in charge they should be able to take out the top rail of the falling wedge with no problem. If the bears are in charge then they should be able to stop this current right here and now.
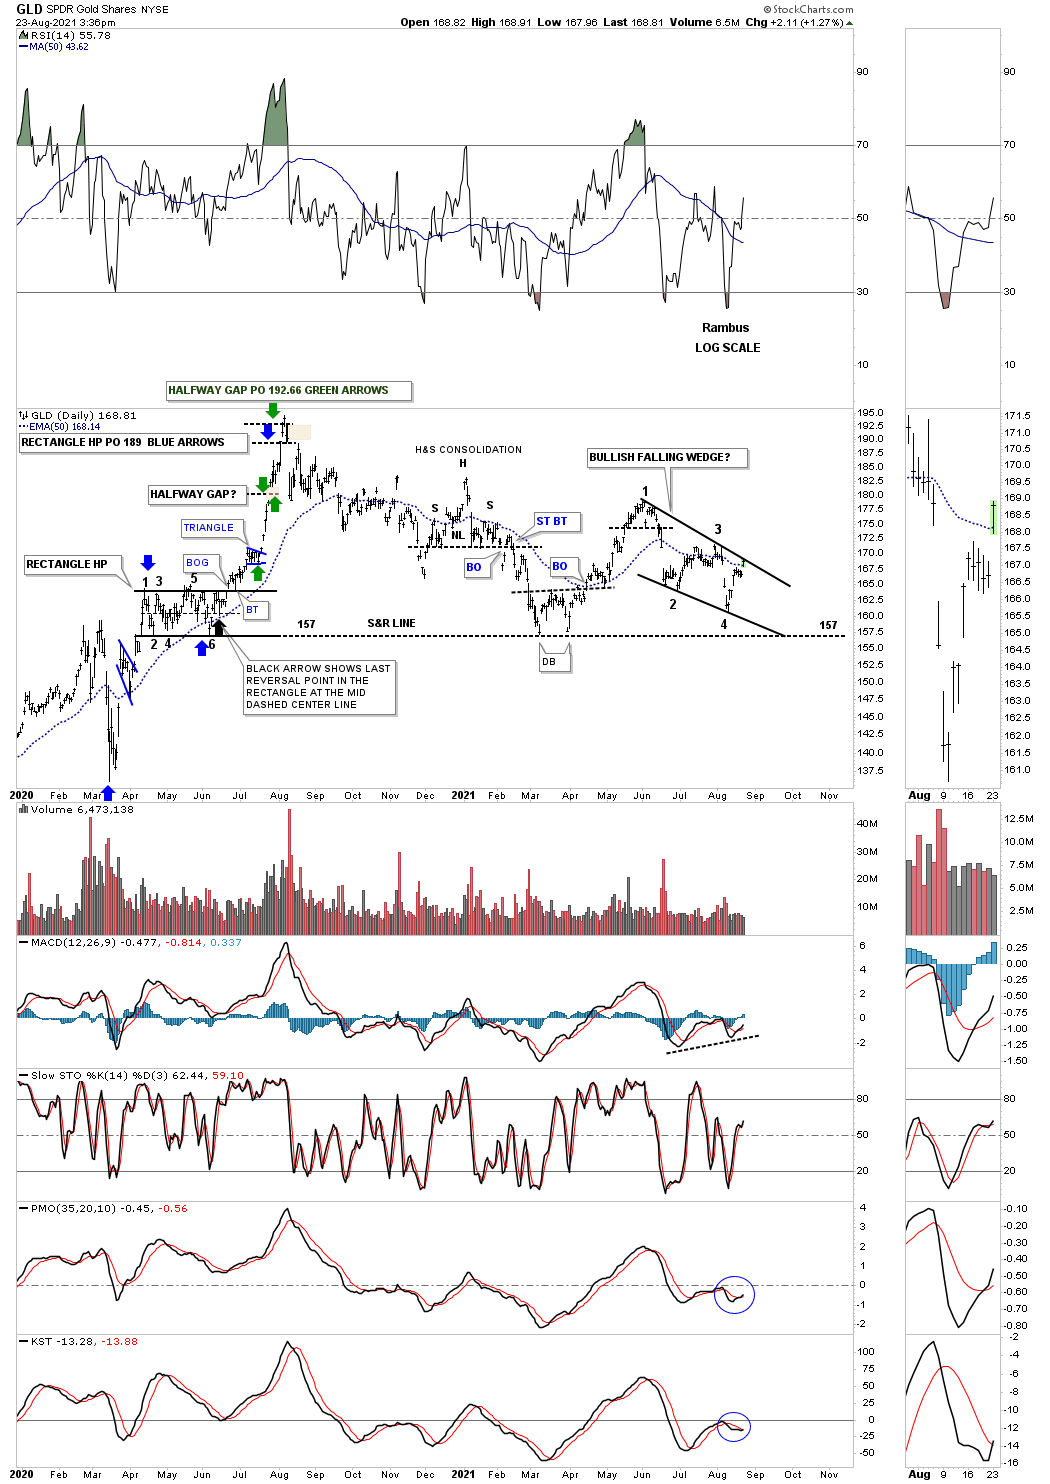
Next is the original blue bearish rising wedge which I was looking at as a halfway pattern to the downside which had a price objective down to the black horizontal line at 157. At a minimum you can expect the decline to reach the first reversal point where the wedge started to form which was accomplished but if the black falling wedge on the daily chart above is going to play out then we shouldn’t see the 157 area hit again. Today’s price action also gapped above the 50 day sma.
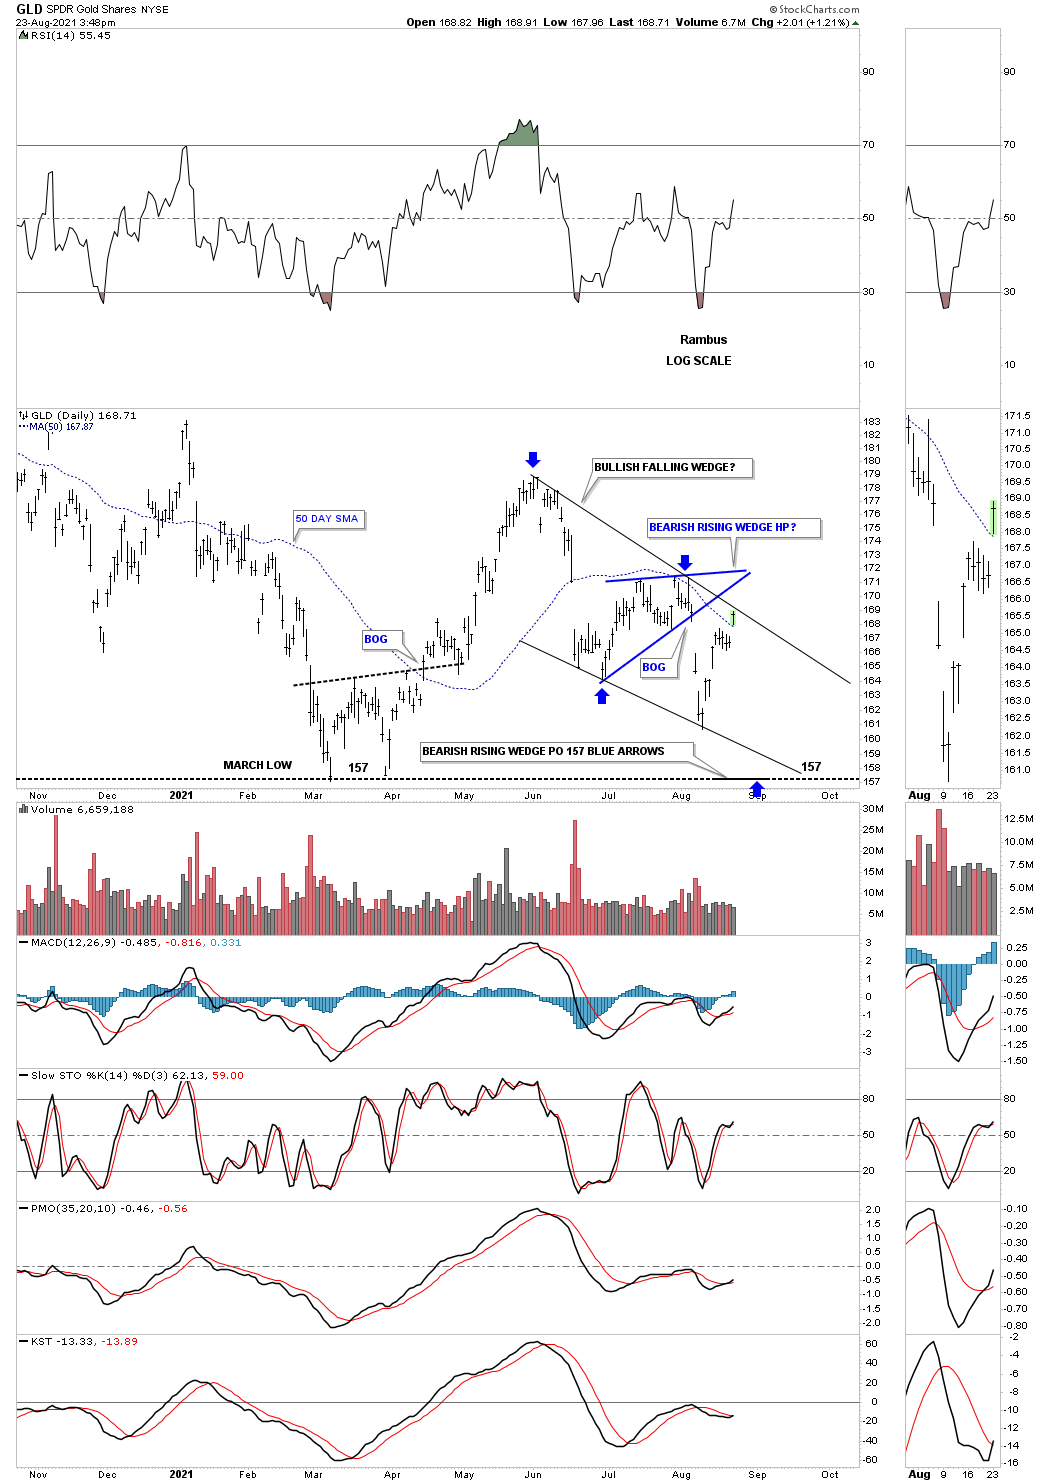
Now lets look at the other side of the coin using a daily line combo chart which is still showing the potential H&S tops in play. Note how this daily line chart shows GLD trading just above the double top trendline and the top rail of the falling wedge. Will we see some follow through to the upside tomorrow? I also mentioned last week that SLV was the only index so far that reached its H&S price objective at 21.40. The SIL which closed well below the bottom rail of its trading range last week could be showing us a bear trap as long as the price action stays above the bottom trendline. The CDNX at the top is also finding some support on its bottom trendline today.
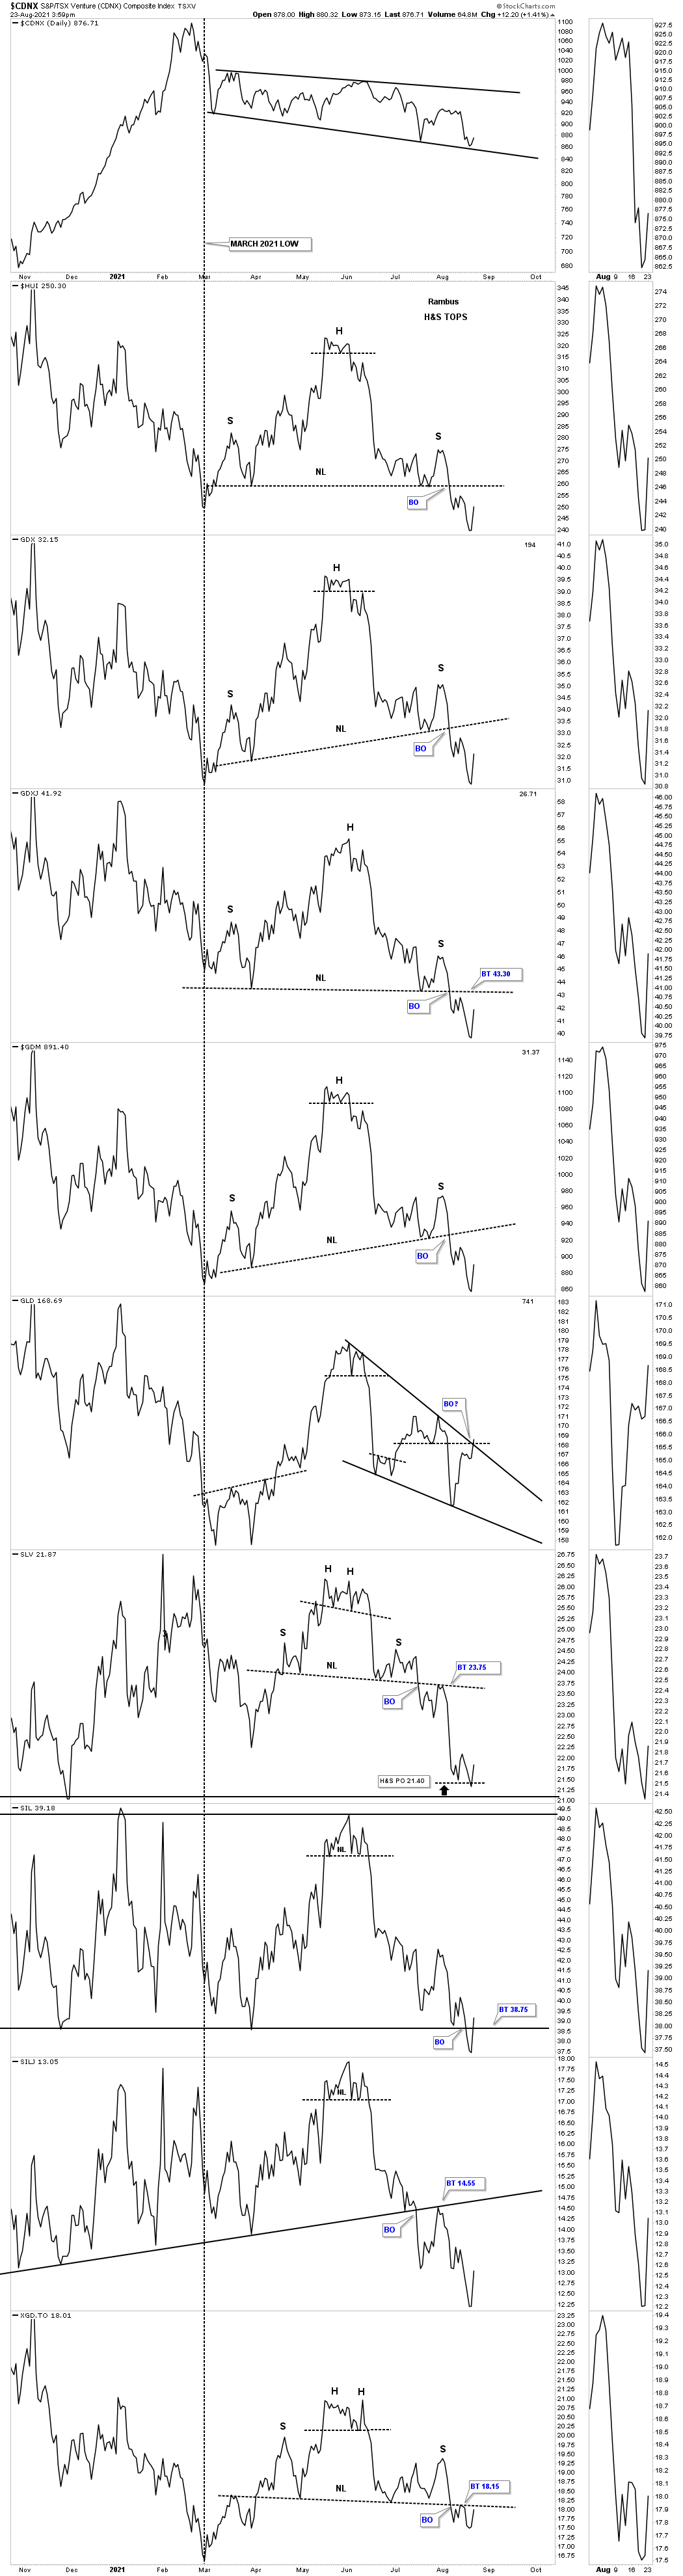
This next combo chart shows the 2020 trading range with the small blue trading ranges we’ve been following. As you can see the most recent low made last Friday held today with several of the indexes gapping back into their small blue trading ranges with a few unable so far to break through.
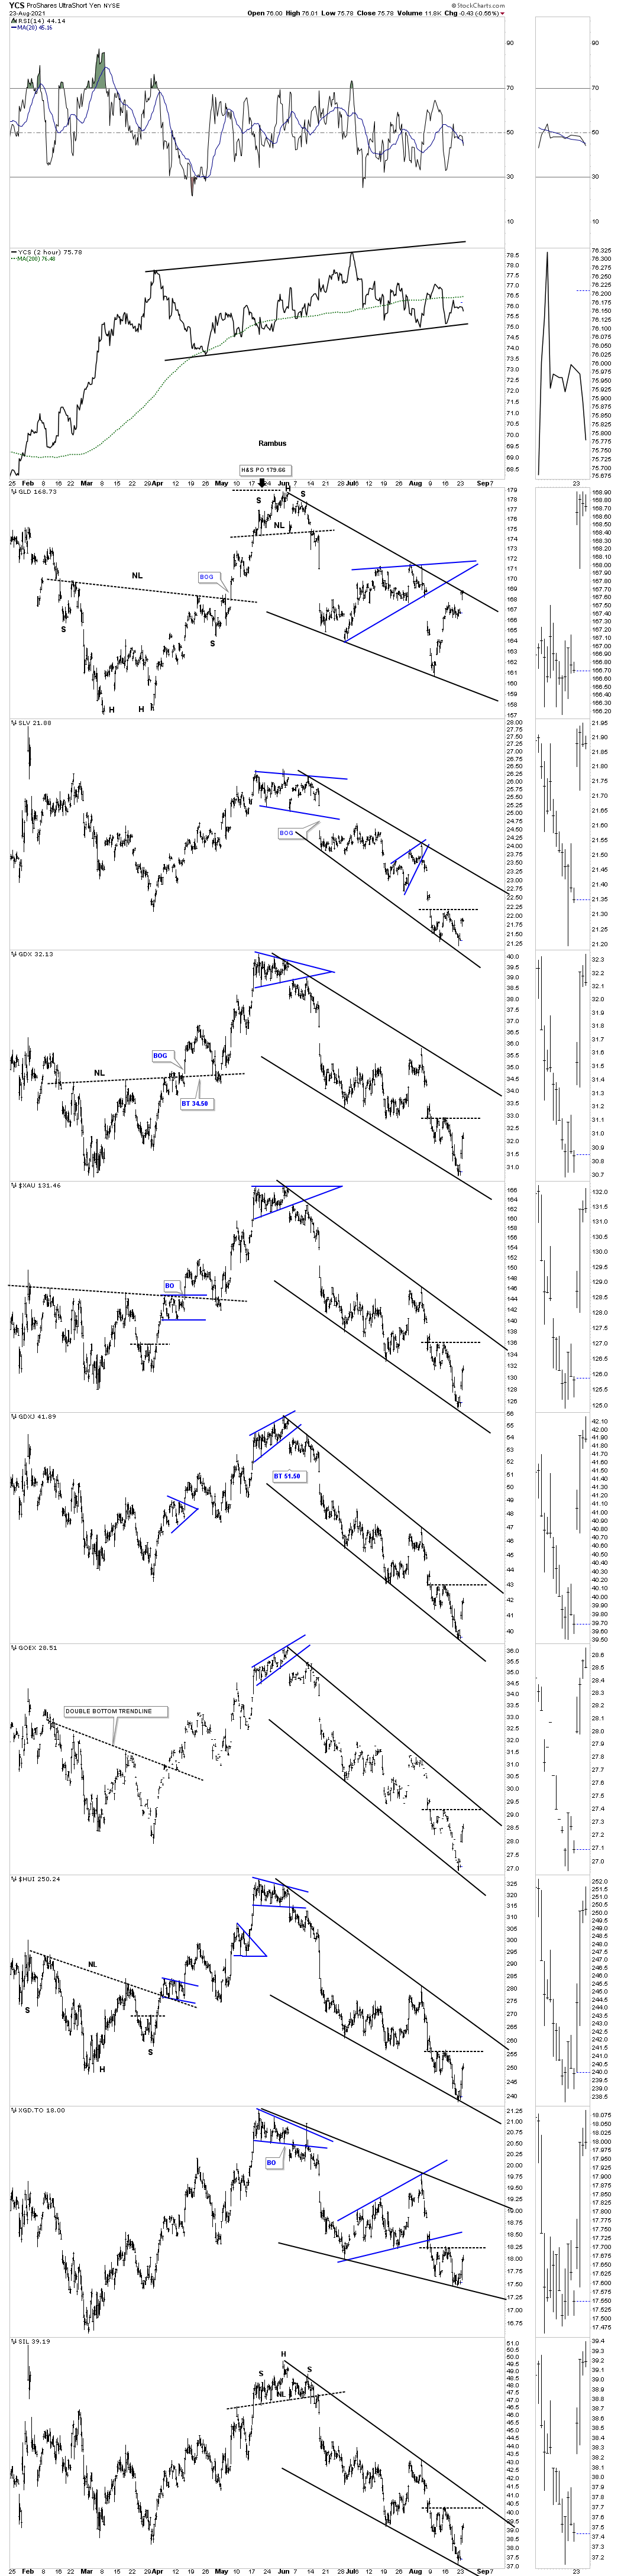
When I first saw that potential bullish falling wedge on GLD I immediately looked at the PM stock indexes to see it that pattern was relative to them. As you can see it is relative even though GLD has had a much bigger rally off of the previous low on this 2 hour chart below. In situations like this it is always important to look for some type of reversal pattern to form at the low.
If you recall there was a small consolidation pattern that formed at the June high that didn’t look like much at the time but it reversed that rally which led to Friday’s low. Typically we should be looking for either a double bottom or a H&S bottom if this downtrend is going to be reversed to the upside. I added a horizontal black dashed line which could show us either a double bottom trendline or a potential H&S neckline if this is the bottom we’ve been looking for since the August 2020 high. There is still a lot of work to do yet like building out some type of reversal pattern and if that plays out then we’ll need to see the top rail of the black trading ranges broken to the upside.
On days like today it may feel like you have missed the exact bottom which could be true but as you can see none of the lows have held since the June highs. GLD is generally the leader and has been the strongest area in the PM complex so it will most likely give us some important clues especially how it interacts with the apex of the blue rising wedge if this is the bottom. All the best…Rambus
About the author
